REVIEW 2 major objections 5 minor 25 references
Delving into the Historical Ca II K Archive from the Kodaikanal Observatory: the Potential of the Most Recent Digitised Series
T0 review · 2 major / 5 minor · reviewed 2026-08-14 · deepseek-v4-flash
Pith's one-line read The paper establishes that the newer 16-bit digitisation of the Kodaikanal Ca II K archive is superior, while the shared quality degradation in both scans is intrinsic to the original plates.
desk verdict A careful and useful comparison of the two Kodaikanal digitizations; the recommendation to prefer the 16-bit series is well supported, but the 'intrinsic artifact' conclusion is somewhat stronger than the evidence. read the letter →
The pith
A machine-rendered reading of the paper's core claim, the machinery that carries it, and where it could break.
The reading
What carries the argument
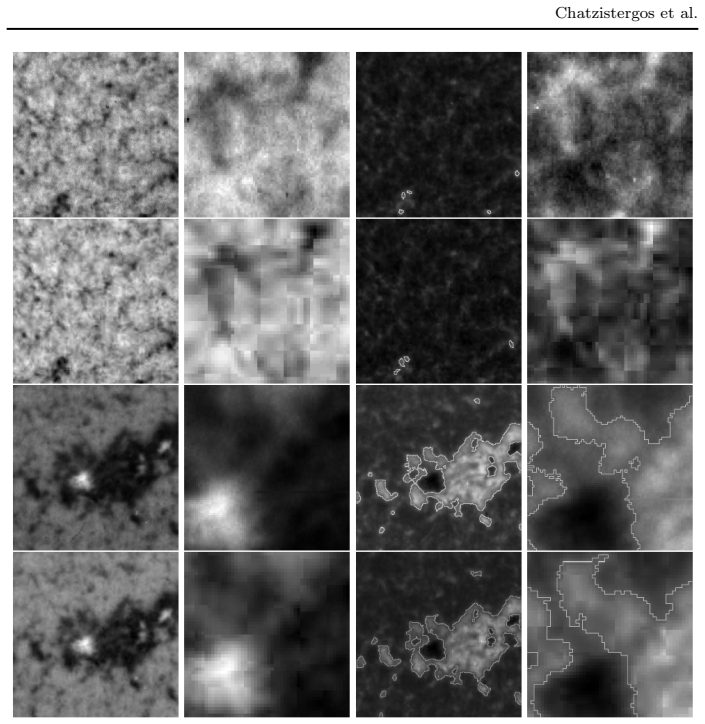
The load-bearing instrument is a single processing pipeline applied unchanged to both datasets. Images are converted to density, photometrically calibrated by fitting the quiet-Sun centre-to-limb variation to a modern reference, corrected for limb darkening, and segmented into plage using a threshold of 8.5 times the quiet-Sun contrast standard deviation. Because the pipeline is held fixed, any systematic difference between DS1 and DS2 must be attributed either to the digitisation or to the photographic material, and the matching secular drifts in eccentricity, resolution, inhomogeneities, and centre-to-limb variation residuals point to the latter.
What would settle it
Scan a stratified sample of the same Kodaikanal plates (for example, 20 plates per decade from 1904–2007) with a modern calibrated scanner and recompute the same metrics—disc eccentricity, spatial resolution, large-scale inhomogeneities, centre-to-limb variation residuals, and plage areas. If the secular trends shrink or vanish, the shared trends in DS1 and DS2 were partly scanner artefacts; if they reproduce at the same slope, the archive itself is degrading.
Extended reading notes
Core claim
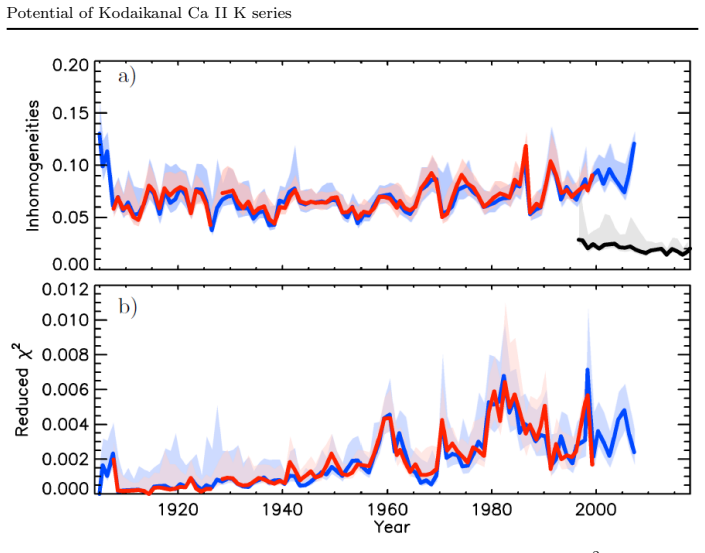
The central claim is that the two digitisations of the same physical archive carry the same time-dependent quality trends, and therefore those trends belong to the original photographic observations rather than to either scanner. Plage areas derived from DS1 and DS2 with identical techniques agree to an RMS difference of about 0.006 in disc fraction on daily values (0.005 for observations taken on the same day and time), with Pearson coefficients near 0.95–0.98, and both sets track the modern Rome/PSPT coverage in the overlap period, with Kodaikanal slightly lower. On this evidence DS2 supersedes DS1: it provides more than double the images (48,928 versus 22,158), more stable transmittance, and better spatial resolution after 1990, while its remaining imperfections are properties of the plates themselves.
Load-bearing premise
The conclusion depends on the assumption that the two digitisation campaigns, carried out more than a decade apart with different hardware, do not share some systematic artefact that happens to produce the same slow drift in image quality; only then does the matching degradation point to the original plates.
Editorial extensions
If this is right
- The 16-bit DS2 series should be the default dataset for future Kodaikanal plage-area studies, with DS1 retained mainly for years where it has better coverage, such as 1907, 1909, 1911, 1913, 1955, 1973, and 1993.
- Long-term activity reconstructions from Kodaikanal data must account for time-dependent image quality, since disc eccentricity, spatial resolution, and large-scale inhomogeneities drift secularly in both digitisations.
- Errors in the date and time metadata affect both series, so daily-mean analyses or careful metadata cleaning are needed before comparing Kodaikanal data to other archives.
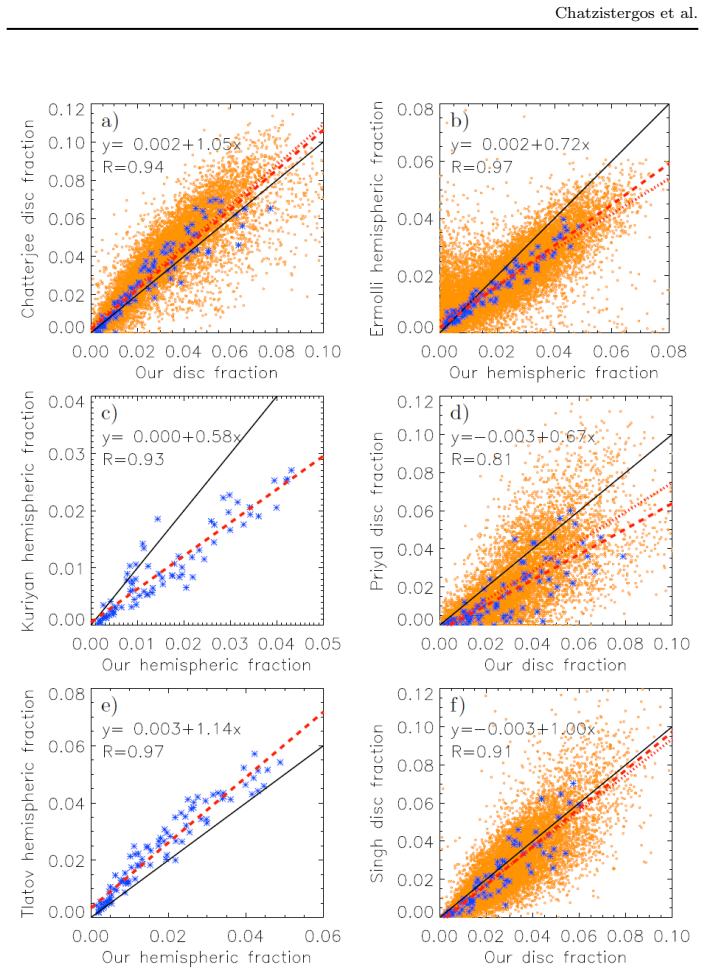
- The scatter among published Kodaikanal plage-area series stems mainly from different calibration methods and different definitions of the solar radius and normalisation area, not from the digitisation itself.
- The archive's intrinsic degradation limits the precision of century-long plage-area trends and makes cross-calibration with other Ca II K archives necessary.
Reading between the lines
- A third digitisation of the same plates with modern equipment may not add much scientific value beyond DS2 for most purposes, because the quality bottleneck appears to be the photographic material itself; a testable extension would be scanning a stratified sample of plates to check whether any remaining artefacts disappear.
- The common time-dependent trends could in principle be modelled as a quality-correction function and applied to plage areas, but that is an extension beyond what this paper attempts.
- If plate degradation is intrinsic, then other photographic solar archives of similar age may hide comparable latent trends, so cross-archive composites may need to include plate-age or observational-epoch covariates.
- The suggestion that Kodaikanal's effective bandwidth may be broader than the nominal 0.5 Å, or that the line was observed off-centre, is a testable inference that could be checked by examining the shape of the centre-to-limb variation over time.
Signed reviews
Editorial analysis
A structured set of objections, weighed in public.
Referee Report
Summary. This paper compares two digitizations of the Kodaikanal Ca II K spectroheliogram archive: DS1 (22,158 mostly 8-bit JPG images, 1907--1999) and DS2 (48,928 16-bit FITS images, 1904--2007). The authors apply the same photometric calibration, limb-darkening compensation, and plage-segmentation pipeline to both series, and also to Rome/PSPT data as a modern reference. They quantify disc eccentricity, spatial resolution, large-scale inhomogeneities, CLV-fit chi-squared, and density/contrast statistics, and derive plage areas. The main findings are: (i) both series show similar time-dependent degradation (increasing eccentricity, worsening resolution, growing inhomogeneities, changing CLV), which the authors attribute to intrinsic properties of the original photographic material; (ii) DS2 has better and more consistent image quality and roughly twice as many images; (iii) plage areas from DS1 and DS2 are highly correlated (Pearson 0.95 daily) but differ by RMS ~0.006 of disc area, with cycle-dependent offsets; and (iv) differences among published plage-area series are largely traceable to different processing choices and solar-disc definitions. The authors conclude that DS2 should be preferred.
Significance. If the conclusions hold, this is a valuable reference for users of the Kodaikanal archive and helps explain the discrepancies among previously published plage-area series. The consistent application of one pipeline to both digitizations is a real strength, as it removes processing differences as an explanation for DS1--DS2 differences, and the image-quality metrics are quantified with uncertainties. The explicit statement that the plage-area errors are tentative, not formal, is appropriately cautious. The external Rome/PSPT comparison provides a useful modern anchor. The practical recommendation that DS2 be preferred is well supported by its larger sample, better post-1990 resolution, and more stable density statistics. The main weakness is that the causal attribution of the common time-dependent trends to the original plates, rather than to the shared processing pipeline, is asserted more strongly than the evidence supports.
major comments (2)
- [Section 3.2 / Section 5] The conclusion that the time-dependent trends common to DS1 and DS2 (disc eccentricity, spatial resolution, large-scale inhomogeneities, CLV fit chi-squared) are intrinsic to the original observations is not fully supported, because both series are processed with the same analysis pipeline. The same limb-detection routine feeds the eccentricity and radius estimates, the same 98%-power-spectral-density estimator yields the resolution, and the same iterative background/CLV fitting produces the inhomogeneity and chi-squared metrics. A systematic bias in any of these routines that scales with plate scale, solar radius, dynamic range, or noise level could be impressed on both series and could mimic intrinsic secular degradation. The Rome/PSPT control covers only 1996--2007, so it cannot validate the 1904--1995 portion of the trends. Please either process both series with a second, independent analysis chain and check that the common trends persist, or add sensitivity tests of the metrics to pipeline choices (e.g., limb-detection threshold, PSD window/cutoff, background polynomial order) and soften the causal wording in Sections 3.2 and 5 from "should be ascribed to" to "are consistent with" the original photographic observations.
- [Section 4.1 / Figure 13] The DS2--Rome/PSPT overlap comparison, which is the main external validation of the DS2 plage areas, shows an RMS difference of 0.01 in disc fraction and a pronounced seasonal pattern (Rome/PSPT higher in winter, DS2 higher in summer), with a maximum absolute difference of 0.08. The paper reports this pattern but does not analyze its origin. Since a seasonal systematic in DS2 would affect the reliability of the recommended series, please investigate whether this modulation reflects a calibration effect (e.g., CLV or flat-field residuals) and explicitly discuss its impact on the claim of a "good match" between DS2 and Rome/PSPT.
minor comments (5)
- [Section 2.1] The sentence "We find only 13,835 images of each set referring to the same solar observations" is ambiguous; please rephrase to clarify that these are paired scans of the same plates, one image from each digitization.
- [Section 3.2 / Figure 9] The phrase "normalised to the maximum value from the respective digitisation" is ambiguous; state whether the normalisation is to the maximum over all images of each series or to a per-image maximum.
- [Section 3.2] The sentence "The maximum (RMS) error in the plage areas for the average disc eccentricity found for Kodaikanal data is 0.013 (0.0005)" is hard to parse; please spell out the maximum error and the RMS error separately.
- [Section 2.2] The sentence "The multiplicative factor for identifying plage was chosen to be 8.5" should explicitly state that this factor multiplies the standard deviation of the quiet-Sun intensity values, as implied later in the text.
- [Section 4.2] There is a typo in "Priyalet al. (2017)"; the word "al." should be separated from "Priyal".
Circularity Check
No significant circularity: the DS1/DS2 comparison is internally controlled and externally anchored to Rome/PSPT; the shared-pipeline ambiguity is an external-validity risk, not a circular reduction.
full rationale
The paper's central comparison is not circular. DS1 and DS2 are independent digitizations of the same Kodaikanal plates, made with different hardware, bit depth, epoch, and operators (Makarov et al. 2004 vs Priyal et al. 2014). Both series are then processed with one pipeline and one fixed segmentation threshold (8.5 sigma), a threshold chosen from Rome/PSPT versus SRPM comparison rather than fitted to the Kodaikanal data, so the DS1/DS2 agreement is a controlled comparison rather than a fitted prediction. The photometric calibration is anchored to an external modern reference, Rome/PSPT, and the overlap period 1996-2007 provides an independent benchmark for the plage-area comparison. The conclusion that common time-dependent trends in eccentricity, resolution, inhomogeneities, and CLV chi-square are intrinsic to the original Kodaikanal observations is an inductive inference from two independent realizations of the same archive, not a definitional identity. A systematic bias shared by the single processing pipeline is a legitimate alternative explanation for some of the common trends, and the text itself concedes in Section 3.2 that the quiet-Sun sigma test is 'not a conclusive test' because instrumental or observational issues could also contribute. That is an external-validity or correctness risk, not circularity, since no output quantity is mathematically identical to an input by construction. The self-citations to Chatzistergos et al. (2018a, 2019a) supply the processing method and previously published error estimates; they do not import an unverified uniqueness theorem, forbid alternative interpretations, or substitute for the comparison performed in this paper. Therefore no circular step is present.
Assumptions & free parameters
free parameters (2)
- plage segmentation threshold =
8.5 (multiplicative factor of QS standard deviation)
- disc normalization radius =
0.98 R (96% of disc area)
assumptions (3)
- domain assumption The two digitizations DS1 and DS2 are scans of the same original plates and were produced with sufficiently independent setups, so common time-dependent patterns imply origin in the plates rather than shared digitisation artefacts.
- domain assumption The quiet-Sun centre-to-limb variation of the historical Kodaikanal observations can be mapped onto the Rome/PSPT reference CLV by a per-image calibration curve that is linearly extrapolated to the non-QS regions.
- domain assumption The same segmentation threshold (8.5 sigma) identifies comparable physical plage regions on all datasets despite differences in bandwidth, resolution, and stray light.
Cite this review
Pith. "Pith review of Delving into the Historical Ca II K Archive from the Kodaikanal Observatory: the Potential of the Most Recent Digitised Series." pith.science (2026). https://pith.science/paper/HJ6WMNH3
@misc{pith2026190805493,
  author       = {Pith},
  title        = {Pith review of: Delving into the Historical Ca II K Archive from the Kodaikanal Observatory: the Potential of the Most Recent Digitised Series},
  year         = {2026},
  howpublished = {\url{https://pith.science/paper/HJ6WMNH3}},
  note         = {Machine review of arXiv:1908.05493}
}
read the original abstract
Full-disc Ca II K photographic observations of the Sun carry direct information about the evolution of solar-plage regions for more than a century and are therefore a unique dataset for solar-activity studies. For a long time Ca II K observations were barely explored, but recent digitisations of multiple archives have allowed their extensive analysis. However, various studies have reported diverse results partly due to the insufficient quality of the digitised data. Furthermore, inhomogeneities have been identified within the individual archives, which, at least partly, could be due to the digitisation. As a result, some of the archives, e.g. that from the Kodaikanal observatory, were re-digitised. The results obtained by different authors who analysed the data from the new digitisation of the Kodaikanal archive differ from each other as well as from those derived from the old digitisation. Since the data were processed and analysed using different techniques, it is not clear, however, whether the differences are due to the digitisation or the processing of the data. To understand the reasons for such discrepancies, we analyse here the data from the two most recent digitisations of this archive. We use the same techniques to consistently process the images from both archives and to derive the plage areas from them. Some issues have been identified in both digitisations, implying that they are intrinsic characteristics of the data. Moreover, errors in timing of the observations plague both digitisations. Overall, the most recent 16-bit digitisation offers an improvement over the earlier 8-bit one. It also includes considerably more data and should be preferred.
Figures


Figures from the paper (14 more)






Reference graph
Works this paper leans on
-
[1]
Journal of Geophysical Research: Space Physics 114(A7)
Balmaceda, L.A., Solanki, S.K., Krivova, N.A., Foster, S.: 2009, A homogeneous database of sunspot areas covering more than 130 years. Journal of Geophysical Research: Space Physics 114(A7). DOI. Chatterjee, S., Banerjee, D., Ravindra, B.: 2016, A butterfly diagram and carrington maps for century-long Ca II K spectroheliograms from the Kodaikanal observato...
work page 2009
-
[5]
DOI. Chatzistergos, T., Ermolli, Ilaria, Solanki, Sami K., Krivova, Natalie A., Giorgi, Fabrizio, Yeo, Kok Leng: 2019c, Recovering the unsigned photospheric magnetic field from Ca II K observations. A&A 626, A114. DOI. Ermolli, I., Berrilli, F., Florio, A.: 2003, A measure of the network radiative properties over the solar activity cycle. Astronomy and Ast...
work page 2003
-
[6]
Astronomy and Astrophysics 465,
Ermolli, I., Criscuoli, S., Centrone, M., Giorgi, F., Penza, V.: 2007, Photometric properties of facular features over the activity cycle. Astronomy and Astrophysics 465,
work page 2007
-
[15]
Plage areas presented in the literature ( y-axis) versus the ones derived here from DS2 ( x-axis): ( a) Chatterjee, Banerjee, and Ravindra (2016) from DS2; ( b) Ermolli et al. (2009a) from DS1; ( c) Kuriyan, Muralidharan, and Sampath (1983) from the actual photographs; ( d) Priyal et al. (2017) from DS2; ( e) Tlatov, Pevtsov, and Singh (2009) from DS1; ( ...
work page 2016
-
[17]
Calibrated images of Kodaikanal observation taken on 20 January 1938 (shown in Figure 16): ( a) with our method, and with the methods by ( b) Chatterjee, Banerjee, and Ravindra (2016), (c) Priyal et al. (2014), and (d) Ermolli et al. (2009a). The images processed with our method and by Ermolli et al. (2009a) are given as contrast values and are saturated ...
work page 2016
-
[23]
DOI. Skumanich, A., Lean, J.L., Livingston, W.C., White, O.R.: 1984, The sun as a star - Three- component analysis of chromospheric variability in the calcium K line. The Astrophysical Journal 282,
work page 1984
-
[27]
Kariyappa, R., Sivaraman, K.R.: 1994, Variability of the solar chromospheric network over the solar cycle. Solar Physics 152,
work page 1994
-
[51]
DOI. Singh, J., Priyal, M., Sindhuja, G., Ravindra, B.: 2018, Variations in Ca-K line profiles and Ca- K line features as a function of latitude and solar cycle during the 20th century. Proceedings of the International Astronomical Union 13(S340),
work page 2018
Show all 25 references
-
[70]
Chatzistergos, T.: 2017, Analysis of historical solar observations and long-term changes in solar irradiance, PhD thesis, Uni-edition, ??? ISBN 978-3-944072-55-5
DOI. Chatzistergos, T.: 2017, Analysis of historical solar observations and long-term changes in solar irradiance, PhD thesis, Uni-edition, ??? ISBN 978-3-944072-55-5. Chatzistergos, T., Ermolli, I., Solanki, S.K., Krivova, N.A.: 2018a, Analysis of full disc Ca II K spectrohel...
2017
-
[85]
Schrijver, C.J., Cote, J., Zwaan, C., Saar, S.H.: 1989, Relations between the photospheric magnetic field and the emission from the outer atmospheres of cool stars
DOI. Schrijver, C.J., Cote, J., Zwaan, C., Saar, S.H.: 1989, Relations between the photospheric magnetic field and the emission from the outer atmospheres of cool stars. I - The solar CA II K line core emission. The Astrophysical Journal 337,
1989
-
[87]
Chatterjee, S., Mandal, S., Banerjee, D.: 2017, Variation of Supergranule Parameters with Solar Cycles: Results from Century-long Kodaikanal Digitized Ca II K Data
DOI. Chatterjee, S., Mandal, S., Banerjee, D.: 2017, Variation of Supergranule Parameters with Solar Cycles: Results from Century-long Kodaikanal Digitized Ca II K Data. The Astrophysical Journal 841,
2017
-
[115]
Fontenla, J.M., Curdt, W., Haberreiter, M., Harder, J., Tian, H.: 2009, Semiempirical Models of the Solar Atmosphere
DOI. Fontenla, J.M., Curdt, W., Haberreiter, M., Harder, J., Tian, H.: 2009, Semiempirical Models of the Solar Atmosphere. III. Set of Non-LTE Models for Far-Ultraviolet/Extreme-Ultraviolet Irradiance Computation. The Astrophysical Journal 707,
2009
-
[125]
ISBN 1743-9221. DOI. Nesme-Ribes, E., Meunier, N., Collin, B.: 1996, Fractal analysis of magnetic patterns from Meudon spectroheliograms. Astronomy and Astrophysics 308,
1996
-
[137]
Priyal, M., Singh, J., Belur, R., Rathina, S.K.: 2017, Long-term Variations in the Intensity of Plages and Networks as Observed in Kodaikanal Ca-K Digitized Data
DOI. Priyal, M., Singh, J., Belur, R., Rathina, S.K.: 2017, Long-term Variations in the Intensity of Plages and Networks as Observed in Kodaikanal Ca-K Digitized Data. Solar Physics 292(7),
2017
-
[139]
Kuriyan, P.P., Muralidharan, V., Sampath, S.: 1983, Long-term relationships between sunspots, Ca-plages and the ionosphere
DOI. Kuriyan, P.P., Muralidharan, V., Sampath, S.: 1983, Long-term relationships between sunspots, Ca-plages and the ionosphere. Journal of Atmospheric and Terrestrial Physics 45,
1983
-
[213]
Pevtsov, A.A., Virtanen, I., Mursula, K., Tlatov, A., Bertello, L.: 2016, Reconstructing solar magnetic fields from historical observations. I. Renormalized Ca K spectroheliograms and pseudo-magnetograms. Astronomy and Astrophysics 585, A40. DOI. Priyal, M., Singh, J., Ravindra...
2016
-
[239]
SOLA: comparison_old_new_koda_arxiv.tex; 16 August 2019; 0:35; p
DOI. SOLA: comparison_old_new_koda_arxiv.tex; 16 August 2019; 0:35; p. 25 Chatzistergos et al. Figure
2019
-
[273]
SOLA: comparison_old_new_koda_arxiv.tex; 16 August 2019; 0:35; p
DOI. SOLA: comparison_old_new_koda_arxiv.tex; 16 August 2019; 0:35; p. 24 Potential of Kodaikanal Ca II K series Makarov, V.I., Tlatov, A.G., Singh, J., Gupta, S.S.: 2004, 22-years magnetic cycle in polar activity of the Sun. In: Stepanov, A.V., Benevolenskaya, E., Kosovichev,...
2019
-
[285]
Loukitcheva, M., Solanki, S.K., White, S.M.: 2009, The relationship between chromospheric emissions and magnetic field strength
DOI. Loukitcheva, M., Solanki, S.K., White, S.M.: 2009, The relationship between chromospheric emissions and magnetic field strength. Astronomy and Astrophysics 497,
2009
-
[482]
Foukal, P.: 1996, The Behavior of solar magnetic plages measured from Mt
DOI. Foukal, P.: 1996, The Behavior of solar magnetic plages measured from Mt. Wilson observations between 1915-1984. Geophysical Research Letters 23,
1996
-
[627]
Ermolli, I., Chatzistergos, T., Krivova, N.A., Solanki, S.K.: 2018, The potential of Ca II K observations for solar activity and variability studies
DOI. Ermolli, I., Chatzistergos, T., Krivova, N.A., Solanki, S.K.: 2018, The potential of Ca II K observations for solar activity and variability studies. In: Banerjee, D., Jiang, J., Kusano, K., Solanki, S. (eds.) Long-term Datasets for the Understanding of Solar and Stellar ...
2018
-
[776]
Tlatov, A.G., Pevtsov, A.A., Singh, J.: 2009, A New Method of Calibration of Photographic Plates from Three Historic Data Sets
DOI. Tlatov, A.G., Pevtsov, A.A., Singh, J.: 2009, A New Method of Calibration of Photographic Plates from Three Historic Data Sets. Solar Physics 255,
2009
-
[857]
Ermolli, I., Fofi, M., Bernacchia, C., Berrilli, F., Caccin, B., Egidi, A., Florio, A.: 1998, The Prototype Rise-Pspt Instrument Operating in Rome
DOI. Ermolli, I., Fofi, M., Bernacchia, C., Berrilli, F., Caccin, B., Egidi, A., Florio, A.: 1998, The Prototype Rise-Pspt Instrument Operating in Rome. Solar Physics 177,
1998
-
[964]
Sheeley, N.R
DOI. Sheeley, N.R. Jr., Cooper, T.J., Anderson, J.R.L.: 2011, Carrington Maps of Ca II K-line Emission for the Years 1915-1985. The Astrophysical Journal 730,
2011
-
[1938]
(2017, dashed green), Priyal et al
Circles enclose the areas considered by Chatterjee, Banerjee, and Ravindra (2016, dashed green), Priyal et al. (2017, dashed green), Priyal et al. (2014, dotted yellow), and in this work (solid blue). SOLA: comparison_old_new_koda_arxiv.tex; 16 August 2019; 0:35; p. 27 Chatzis...
2016
Reviewed August 14, 2026 · model on record in the stance chip above.
Discussion (0). Continue with ORCID to comment.