REVIEW 2 major objections 7 minor 20 references
Voltage Instability Prediction Using a Deep Recurrent Neural Network
T0 review · 2 major / 7 minor · reviewed 2026-08-14 · deepseek-v4-flash
Pith's one-line read An LSTM network fed a 60-second rolling window of standard power-system measurements can predict voltage instability several minutes ahead, reaching 100% categorical accuracy on N-1 contingencies and 97.7% on N-1-1 contingencies in…
desk verdict Genuine LSTM application to voltage instability prediction with a fair comparison, but the 560-second horizon assumption and missing error bars keep it from a clean accept. read the letter →
The pith
A machine-rendered reading of the paper's core claim, the machinery that carries it, and where it could break.
The reading
What carries the argument
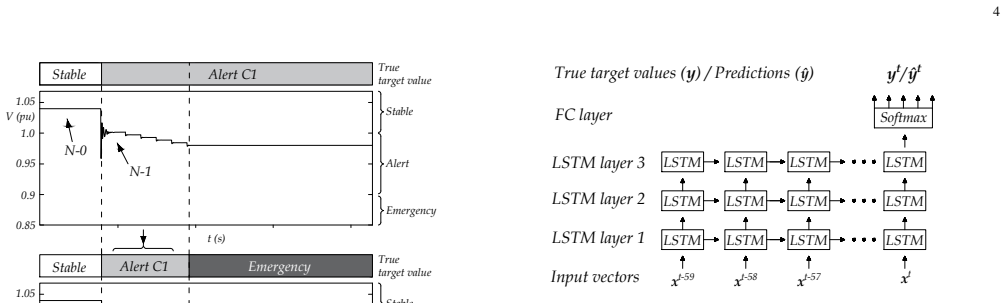
The central object is the many-to-one LSTM network: three stacked LSTM layers of 32 cells each, fed a rolling window of 60 one-second input vectors of 364 features (all bus voltage magnitudes and angles plus active and reactive power flows), and finished with a fully connected softmax layer over five outcome classes. The gated cell state is the mechanism that carries the argument: it carries information across time steps, letting the network keep pre-contingency and post-contingency context in memory. The paper shows the memory window matters by demonstrating that accuracy drops exactly when the pre-contingency information slides out of the window, and that the 60-step network outperforms both a single-snapshot feedforward network and a 30-step LSTM on the N-1-1 test set.
What would settle it
On a Nordic32 test case where the network issues an emergency warning, apply a fast remedial action such as load shedding a fixed delay later; if the voltage trajectory then diverges from the predicted emergency class, the no-action counterfactual behind the labels is violated and the reported accuracy does not measure operational performance.
Extended reading notes
Core claim
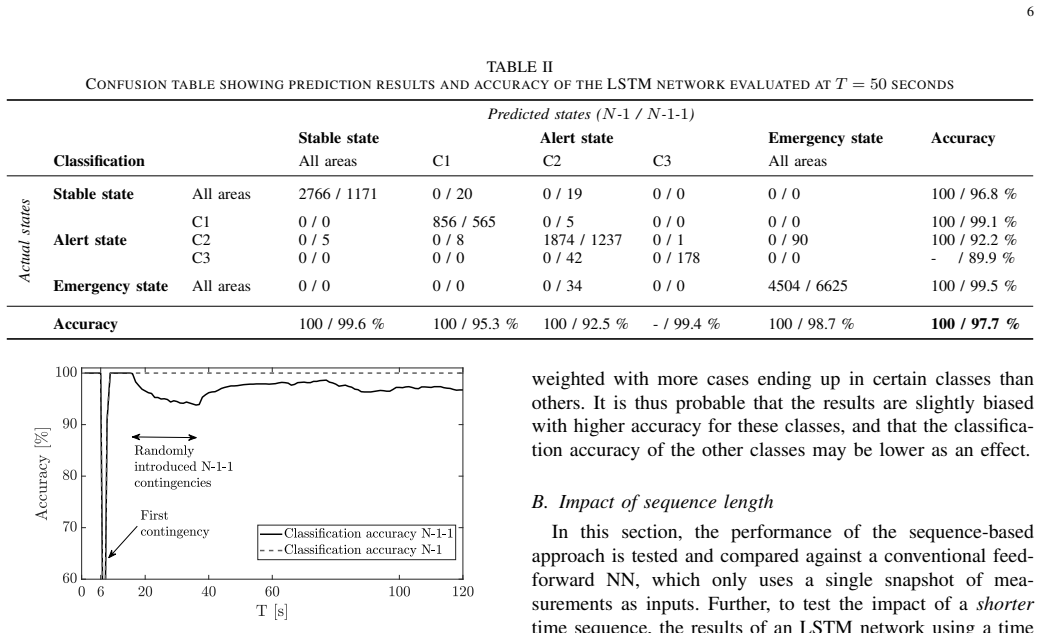
The central claim is that the future voltage-stability condition of a power system can be predicted almost perfectly in the seconds immediately following a disturbance, provided the predictor sees a sequence of recent measurements rather than a single snapshot. The paper demonstrates this on the Nordic32 system by training a three-layer LSTM, with 32 cells per layer and a 60-step input window, on 135,000 simulated cases labeled by their final state at 560 seconds. The model outputs one of five classes: stable, emergency, or alert with the low-voltage region identified as C1, C2, or C3. At T=50 seconds after the first contingency, the N-1 test set is classified with 100% accuracy and the N-1-1 set with 97.7%, with the weakest per-class results (89.9% for one alert region) coming from cases whose voltages sit near class boundaries. The result is used to argue that recurrent memory implicitly reconstructs the hidden state variables, such as generator rotor speeds and transformer tap positions, that make power-system dynamics non-Markovian in the measured quantities alone.
Load-bearing premise
The reported accuracies assume the system is left unchanged after the prediction is made, so the labels describe a no-action counterfactual; a real warning that triggers fast remedial action changes the future trajectory, and the paper's numbers do not describe that post-action operating condition.
Editorial extensions
If this is right
- Operators could receive a voltage-instability warning within seconds of an N-1 contingency, minutes before conventional detection methods would confirm instability.
- The 60-second measurement window gives a concrete, testable design rule: the memory length should exceed the expected delay between a disturbance and the information needed to classify the outcome.
- Training on N-1 cases alone is not enough for N-1-1 events; including even a small batch of N-1-1 cases markedly improves accuracy, though the full training set remains better.
- The network's region output can direct remedial actions to the area where the lowest voltage is expected, supporting more targeted countermeasures.
- Real-world accuracy will be lower than the simulated figures because of modeling errors and unknown parameter values, so the tool is proposed as a supplement to existing detection, not a replacement.
Reading between the lines
- The observed timing of the accuracy drop (exactly 60 or 30 seconds after a second contingency, matching the window length) suggests a testable extension: an architecture with attention over a longer or variable-length context could further delay or eliminate this blind spot.
- Because the labels are generated under a no-action counterfactual, the reported accuracy should be read as a property of the simulator's counterfactual world; practical deployment would need to close the loop by retraining on trajectories that include the remedial actions the warnings trigger.
- The network's softmax probabilities are uncalibrated, so using them as operator confidence would require a post-hoc calibration step; this is directly testable with reliability diagrams on the held-out test set.
- A similar sequence-based LSTM could be applied to other dynamic security assessment tasks, such as transient angle stability or frequency stability, where hidden state variables also matter; this awaits a similar simulation-based validation.
Signed reviews
Editorial analysis
A structured set of objections, weighed in public.
Referee Report
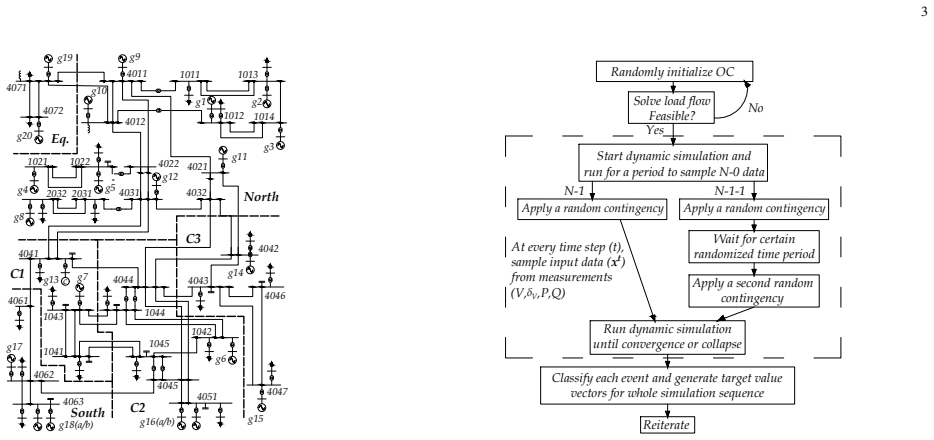
Summary. This paper proposes an LSTM-based voltage instability prediction (VIP) method for the Nordic32 test system. The network uses a rolling 60-second window of simulated measurements (bus voltage magnitudes/angles, active and reactive power flows) and classifies each time step into stable, alert (with regional localization), or emergency states. Training data are generated from randomized operating conditions and contingencies (N-1 and N-1-1) using time-domain simulation, with labels defined as the final state of a 560-second simulation under the assumption of no further changes. The method is evaluated on independent test sets of 10,000 N-1 and 10,000 N-1-1 cases, reporting 100% and 97.7% categorical accuracy at T=50 s, respectively. The authors also compare the 60-step LSTM to a feedforward neural network and a 30-step LSTM, finding improved accuracy and linking the improvement to the retention of pre-contingency information.
Significance. The manuscript addresses a practically relevant problem and provides a clear pipeline from simulation data generation to LSTM training and evaluation. I credit the authors for using separate train/test sets, presenting confusion tables, and designing a sequence-length ablation that demonstrates the value of remembering pre-contingency dynamics. The N-1-1 generalization study is also a useful empirical contribution. However, the central accuracy claims are conditional on two assumptions that are not fully validated: the 560-second labeling horizon and the absence of remedial actions. The paper does not release code or data, which limits reproducibility. If the horizon issue is resolved and the statistical claims are properly supported, the contribution would be a solid application paper in dynamic security assessment.
major comments (2)
- [Section III-D, Table II] The 560-second simulation horizon is asserted, not verified. The label for every time step is the final state at 560 s under the no-change assumption, so any trajectory that would collapse or further degrade after 560 s would be mislabeled. Voltage instability can develop over 10+ minutes through slow OLTC, overexcitation limiter, and load-restoration dynamics; the reported 100% (N-1) and 97.7% (N-1-1) accuracies are therefore upper bounds conditional on this assumption. Please add a sensitivity analysis that extends the horizon (e.g., to 900 or 1200 s) for at least a representative sample of test cases and reports how many labels would change, and if no labels change, state that explicitly.
- [Abstract, Section IV-B, Fig. 8] The word 'significantly' is used without statistical support. No confidence intervals, repeated training runs, or hypothesis tests are reported. The observed differences in Fig. 8 (approximately 96–98% vs. 93% for the feedforward NN) are promising but not statistically quantified. I request bootstrap confidence intervals for the accuracy curves and for Table II's per-class accuracies, or multiple-seed experiments with a paired test, to substantiate the comparative claims in the abstract and conclusions.
minor comments (7)
- [Section III-D] The interpretation of the prediction as a 'fixed horizon' problem is unclear because the horizon is the terminal state at 560 s regardless of the current time t, so the actual look-ahead horizon shrinks as t grows; please clarify this definition.
- [Section IV-A, Table II] Because the N-1-1 test set is imbalanced (6,625 of 10,000 cases are emergency), the total categorical accuracy is dominated by the majority class; report balanced accuracy or macro-averaged F1 alongside the total accuracy.
- [Section IV-B, Fig. 8] The accuracy curves would be easier to interpret with error bars or confidence bands, and the word 'significantly' should be reserved for statistically tested differences.
- [Abstract, Section IV-A] The abstract states the method predicts 'only seconds after a disturbance'; the T=50 s evaluation corresponds to 44 s after the first contingency and 14–34 s after the second contingency, so please use the actual relative times to avoid overstatement.
- [Section III-A] The labeling of the period between the first and second contingency in N-1-1 cases uses the final state of the corresponding N-1 simulation; this modeling choice should be justified, since the trajectory is later interrupted by the second contingency.
- [Section III-D] The no-change assumption is stated, but the paper should more explicitly discuss that in a real deployment any successful warning will alter the future trajectory, so the reported accuracies are for the open-loop counterfactual and may not reflect closed-loop performance.
- [Abstract] There is a grammar error: 'The proposed method use' should be 'The proposed method uses'; similar minor grammatical issues appear elsewhere.
Circularity Check
No significant circularity: the LSTM predicts held-out simulated future states; the only self-citation ([11]) is a non-load-bearing design antecedent.
full rationale
The derivation chain is self-contained: the authors simulate Nordic32 trajectories, sample measurement vectors x_t, define labels y_t as the classification of the final state over the remaining horizon under the no-change assumption (Section III-A.5), and train an LSTM to map the measurement sequence to y_t. On the held-out test sets, y_t is computed from the simulation but withheld from the network, so the reported accuracies are genuine out-of-sample predictions of future simulated states rather than reproductions of the inputs or fitted parameters. The only self-citation, [11], is used to motivate the location-classification output ("following the approach developed in [11]") and is not load-bearing: it supplies neither the labels nor the accuracy claim. The one explicit assumption, that "extending the simulation horizon even further, for this particular system beyond 560 seconds, would not change the partitioning of the state space" (Section III-D), is a correctness/generalization risk if slow dynamics act beyond 560 s, but it is not a circularity because the labels are not defined in terms of the network output or fitted values.
Assumptions & free parameters
free parameters (10)
- Sequence length =
60 time steps
- LSTM layers and hidden cells =
3 layers, 32 cells per layer
- Learning rate =
0.0001
- Dropout and recurrent dropout =
50% / 50%
- Subsequence extraction range =
t in [60,180], 120 subsequences per case
- Mini-batch size =
1000 subsequences
- Early stopping patience =
6 epochs
- Load variation range =
80% to 120% of base load
- Secondary contingency delay =
uniform in [10,30] seconds
- Simulation horizon =
560 seconds
assumptions (6)
- standard math LSTM equations (1)-(6) correctly implement standard LSTM gating.
- domain assumption PSS/E 34.2.0 with Nordic32 models from [16] and [17] produces credible dynamic responses for voltage stability assessment.
- domain assumption The 560-second simulation horizon is long enough that extending it would not change the stable/alert/emergency classification.
- domain assumption No load or generation changes during the dynamic simulation are negligible for stability classification.
- domain assumption The 60 seconds of sampled measurements (voltage magnitudes/angles, P and Q flows) contain enough information to infer relevant unmeasured dynamic states such as tap positions and rotor speeds.
- domain assumption The final-state labels are unaffected by the operator actions that the warning system is intended to trigger.
Cite this review
Pith. "Pith review of Voltage Instability Prediction Using a Deep Recurrent Neural Network." pith.science (2026). https://pith.science/paper/2ZB5IOGA
@misc{pith2026190805554,
  author       = {Pith},
  title        = {Pith review of: Voltage Instability Prediction Using a Deep Recurrent Neural Network},
  year         = {2026},
  howpublished = {\url{https://pith.science/paper/2ZB5IOGA}},
  note         = {Machine review of arXiv:1908.05554}
}
read the original abstract
This paper develops a new method for voltage instability prediction using a recurrent neural network with long short-term memory. The method is aimed to be used as a supplementary warning system for system operators, capable of assessing whether the current state will cause voltage instability issues several minutes into the future. The proposed method use a long sequence-based network, where both real-time and historic data are used to enhance the classification accuracy. The network is trained and tested on the Nordic32 test system, wherecombinations of different operating conditions and contingency scenarios are generated using time-domain simulations. The method shows that almost all N-1 contingency test cases were predicted correctly, and N-1-1 contingency test cases were predicted with over 93 % accuracy only seconds after a disturbance. Further, the impact of sequence length is examined, showing that the proposed long sequenced-based method provides significantly better classification accuracy than both a feedforward neural network and a network using a shorter sequence.
Figures

Figures from the paper (3 more)

Reference graph
Works this paper leans on
-
[1]
P. Kundur et al., “Definition and classification of power system stability IEEE/CIGRE joint task force on stability terms and definitions,” IEEE Trans. Power Syst., vol. 19, no. 3, pp. 1387–1401, Aug 2004
work page 2004
-
[2]
A short survey of methods for voltage instability detection,
M. Glavic and T. Van Cutsem, “A short survey of methods for voltage instability detection,” in Proc. (IEEE) PES General Meeting , Detroit, MI, Jul 2011, pp. 1–8
work page 2011
-
[3]
Implementation of a massively parallel dynamic security assessment platform for large-scale grids,
I. Konstantelos et al., “Implementation of a massively parallel dynamic security assessment platform for large-scale grids,” IEEE Trans. Smart Grid, vol. 8, no. 3, pp. 1417–1426, May 2017
work page 2017
-
[4]
Decision tree approaches to voltage security assessment,
T. Van Cutsem et al. , “Decision tree approaches to voltage security assessment,” IEE Proceedings C - Generation, Transmission and Dis- tribution, vol. 140, no. 3, pp. 189–198, May 1993
work page 1993
-
[5]
Large scale dynamic security screening and ranking using neural networks,
Y . Mansour et al., “Large scale dynamic security screening and ranking using neural networks,” IEEE Trans. Power Syst. , vol. 12, no. 2, pp. 954–960, May 1997
work page 1997
-
[6]
An online dynamic security assessment scheme using phasor measurements and decision trees,
K. Sun et al. , “An online dynamic security assessment scheme using phasor measurements and decision trees,” IEEE Trans. Power Syst. , vol. 22, no. 4, pp. 1935–1943, Nov 2007
work page 1935
-
[7]
Fast online dynamic voltage in- stability prediction and voltage stability classification,
H. Khoshkhoo and S. M. Shahrtash, “Fast online dynamic voltage in- stability prediction and voltage stability classification,” IET Generation, Transmission & Distribution, vol. 8, no. 5, pp. 957–965, May 2014
work page 2014
-
[8]
An accurate online dynamic security assessment scheme based on random forest,
C. Liu, F. Tang, and C. L. Bak, “An accurate online dynamic security assessment scheme based on random forest,” Energies, vol. 11, no. 7, 2018
work page 2018
Show all 20 references
-
[9]
Decision tree-based online voltage security assessment using PMU measurements,
R. Diao et al., “Decision tree-based online voltage security assessment using PMU measurements,” IEEE Trans. on Power Syst., vol. 24, no. 2, pp. 832–839, May 2009
2009
-
[10]
On-line dynamic voltage instability prediction based on decision tree supported by a wide-area measurement system,
H. Khoshkhoo and S. M. Shahrtash, “On-line dynamic voltage instability prediction based on decision tree supported by a wide-area measurement system,” IET Generation, Transmission & Distribution , vol. 6, no. 11, pp. 1143–1152, November 2012
2012
-
[11]
On-line voltage instability prediction using an artificial neural network,
H. Hagmar et al. , “On-line voltage instability prediction using an artificial neural network,” in 2019 IEEE Milano PowerTech , June 2019 (Accepted), pp. 1–6
2019
-
[12]
R. S. Sutton and A. G. Barto, Reinforcement Learning: An Introduction. Cambridge, Massachusetts London, England: The MIT Press, 2015
2015
-
[13]
LSTM: A Search Space Odyssey,
K. Greff et al., “LSTM: A Search Space Odyssey,” IEEE Trans. Neural Netw. & Learning Syst. , vol. 28, no. 10, pp. 2222–2232, Oct 2017
2017
-
[14]
Learning represen- tations by back-propagating errors,
D. E. Rumelhart, G. E. Hinton, and R. J. Williams, “Learning represen- tations by back-propagating errors,” Nature, vol. 323, no. 6088, p. 533, 1986
1986
-
[15]
Long short-term memory,
S. Hochreiter and J. Schmidhuber, “Long short-term memory,” Neural computation, vol. 9, pp. 1735–80, 12 1997
1997
-
[16]
Test systems for voltage stability analysis and security assessment,
T. Van Cutsem et al. , “Test systems for voltage stability analysis and security assessment,” IEEE/PES Task Force, Tech. Rep. PES-TR19, Aug. 2015. [Online]. Available: http://resourcecenter.ieee-pes.org/pes/ product/technical-publications/PESTR19
2015
-
[17]
PSS®E 34.2.0 Model Library , Siemens Power Technologies Interna- tional, Schenectady, NY , Apr. 2017
2017
-
[18]
Efficient database generation for data-driven security assessment of power systems,
F. Thams et al. , “Efficient database generation for data-driven security assessment of power systems,” IEEE Trans. Power Syst., pp. 1–1, 2019
2019
-
[19]
Adam: A Method for Stochastic Optimization,
D. P. Kingma and J. Ba, “Adam: A Method for Stochastic Optimization,” arXiv e-prints, p. arXiv:1412.6980, Dec 2014
2014 arXiv
-
[20]
A systematic approach to n-1-1 analysis for power sys- tem security assessment,
P. Mitra et al., “A systematic approach to n-1-1 analysis for power sys- tem security assessment,” IEEE Power and Energy Technology Systems Journal, vol. 3, no. 2, pp. 71–80, June 2016. Hannes Hagmar (S’17) received the M.Sc. degree in electric power engineer- ing from Chalmer...
2016
Reviewed August 14, 2026 · model on record in the stance chip above.
Discussion (0). Continue with ORCID to comment.