REVIEW 3 major objections 5 minor 126 references
[OII] emitters in MultiDark-Galaxies and DEEP2
T0 review · 3 major / 5 minor · reviewed 2026-08-14 · deepseek-v4-flash
Pith's one-line read Estimating [O II] luminosity from a galaxy's average star formation rate agrees with the full photoionisation calculation to within five percent for typical emitters, and the large-scale clustering of these galaxies is independent of the…
desk verdict Solid methods paper with a genuinely useful new result on average vs instantaneous SFR for [OII] mocks, and one untested extrapolation that should be fixed before the 5% claim goes general. read the letter →
The pith
A machine-rendered reading of the paper's core claim, the machinery that carries it, and where it could break.
The reading
What carries the argument
The central object is the photoionisation-based mapping from star formation rate and cold-gas metallicity to [O II] luminosity, implemented in the public get_emlines code. In this prescription, $L(\lambda_j) = 1.37\times 10^{-12}\, Q_{H^0}\, F(\lambda_j,q,Z_{\rm cold})/F({\rm H}\alpha,q,Z_{\rm cold})$, where $Q_{H^0} \propto \mathrm{SFR}$ is the hydrogen-ionising photon rate and the flux ratio comes from a pre-computed grid of H II region models with ionisation parameter $q(Z) = q_0 (Z_{\rm cold}/Z_0)^{-\gamma}$. The argument proceeds by comparing this mapping fed with the instantaneous SFR (available in SAG only) against the same mapping fed with the average SFR, and then by testing linear proxies built from SFR and observed-frame u/g magnitudes as substitutes for the full calculation.
What would settle it
Re-run the two models that lack instantaneous star formation output with a time-substepping scheme that resolves the last ~10–25 Myr of star formation, recompute [O II] luminosities with get_emlines using that resolved SFR, and compare the resulting dust-attenuated luminosity function at L[OII] < $10^{42}$.2 erg/s with the one obtained from their average SFR; a discrepancy larger than 5% would show the claim is model-specific.
Extended reading notes
Core claim
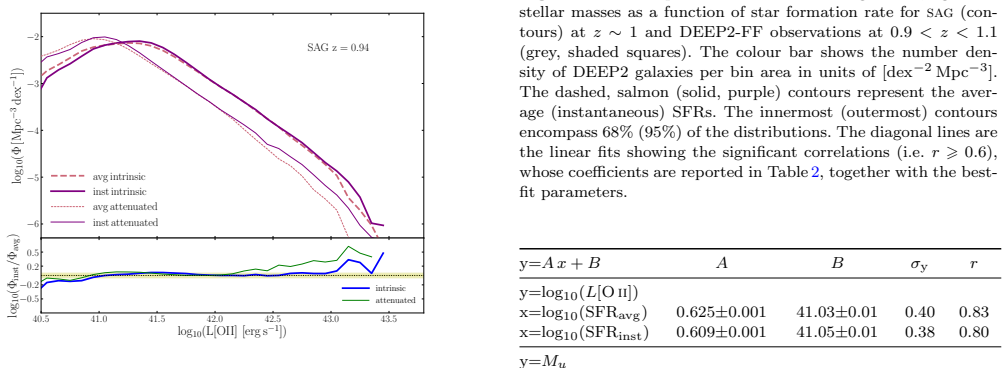
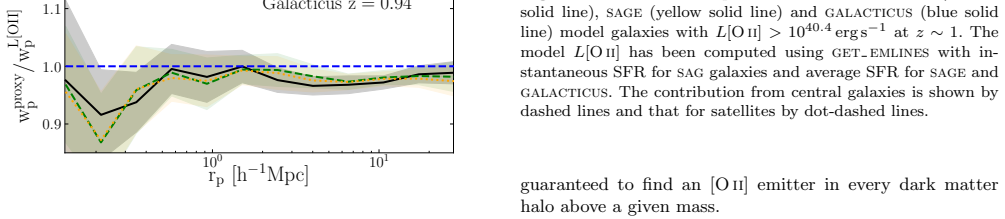
The central claim is that the post-processing computation of [O II] luminosity from average star formation rates is accurate for model galaxies with dust-attenuated L[OII] ≲ $10^{42}$.2 erg/s (less than 5% discrepancy), and that in all three models considered the amplitude of the clustering at scales above 1 $h^{-1}$ Mpc remains unchanged independently of the method used to derive L[OII]. This is established by comparing, within the SAG model, the [O II] luminosity functions obtained by feeding the get_emlines photoionisation prescription with instantaneous versus average SFRs; the two agree within 5% over the range $10^{41}$–$10^{42}$.2 erg/s for attenuated luminosities. The clustering robustness is demonstrated by computing projected two-point correlation functions for galaxies selected at L[OII] > $10^{40}$.4 erg/s, using direct code output, three linear proxies (SFR, u-band and g-band absolute magnitudes), and an observational SFR–metallicity conversion; across SAG, SAGE, and Galacticus, the methods agree within roughly 5–12% on scales above 1 $h^{-1}$ Mpc.
Load-bearing premise
The five-percent agreement was measured inside only one of the three models, where 'instantaneous' star formation means the mass of stars formed over the last ~10–25 Myr; the paper assumes the same insensitivity to SFR time resolution holds for the other two models, which subdivide time into ten steps and have different star formation histories, and this transferability is asserted rather than tested.
Editorial extensions
If this is right
- Semi-analytic galaxy formation models that output only average star formation rates can be post-processed with get_emlines to obtain [O II] luminosities within 5% of the instantaneous-rate result for typical emitters, so no re-simulation with finer time steps is needed for those galaxies.
- Simple linear L[OII] proxies based on SFR or rest-frame UV u/g magnitudes yield luminosity functions whose shapes depend on the model, so they are not reliable for predicting number densities of bright [O II] emitters.
- The projected two-point clustering of [O II] emitters above 1 h^-1 Mpc is robust to the luminosity-estimation method, with agreement within roughly 5–12% across models and estimators, supporting the use of cheap proxies in survey forecasts.
- The halo occupation distribution of [O II] emitters changes little when different luminosity proxies are used, which justifies using simple proxies when building mock catalogues that need HODs.
Reading between the lines
- Because the 5% agreement was only established in one model, models with coarser output steps or burstier star formation histories (the other two considered here) could exceed that threshold; re-running them with shorter substeps would test this directly.
- The clustering robustness means that BAO and redshift-space-distortion forecasts for upcoming emission-line surveys can safely use simple SFR or magnitude proxies, even though any measurement relying on accurate luminosity functions cannot.
- The u/g magnitude proxies, if calibrated on real photometric surveys, could provide a way to estimate [O II] luminosity for galaxies without spectra, assuming the model correlations hold in the real Universe.
- The finding that the 5% agreement region widens with redshift suggests the average-SFR approximation becomes more reliable at higher z, possibly because star formation is steadier; this could be checked by extending the SAG comparison beyond z = 1.2.
Signed reviews
Editorial analysis
A structured set of objections, weighed in public.
Referee Report
Summary. The paper uses three semi-analytic models (SAG, SAGE, Galacticus) run on the same MultiDark Planck 2 simulation to predict the properties of [O II] emitters at 0.6 < z < 1.2, comparing with DEEP2-Firefly and DEEP2+VVDS observations. The authors compute L[O II] with the get_emlines code, which ideally requires instantaneous SFRs; only SAG provides these, while SAGE and Galacticus output only average SFRs. Using SAG, they test average versus instantaneous SFR as inputs and report <5% differences in the resulting luminosity functions for a limited luminosity range. They also derive simple proxies for L[O II] from SFR and u/g magnitudes, and test these proxies against luminosity functions, halo occupation distributions, and the projected two-point correlation function, finding that the clustering amplitude above about 1 h^-1 Mpc is robust to the choice of proxy.
Significance. If the stated accuracy of using average SFRs holds beyond SAG, the paper provides useful practical guidance for adding emission-line luminosities to semi-analytic mock catalogues for DESI/Euclid-type surveys. The work has clear strengths: the three SAMs share the same dark-matter simulation and halo catalogues, the average-versus-instantaneous SFR test in Sec. 3.3 is a controlled internal comparison, the public data release includes DEEP2-Firefly quantities and model emission-line luminosities, and the dust implementation is made available on GitHub. The clustering conclusion is well supported by the proxy comparisons in Sec. 4.4.2. However, the central 5% accuracy claim is currently stated more generally than what is actually tested, and part of the luminosity-function agreement with observations is calibrated rather than predicted. These issues are fixable but require changes to the presentation and, ideally, an additional test.
major comments (3)
- [Secs. 2.1.4, 3.3, 3.4 and abstract] The 5% average-versus-instantaneous SFR result is established only within SAG, which subdivides the time between snapshots into 25 steps. SAGE and Galacticus split time into 10 steps and output only average SFRs, as stated in Sec. 2.1.4, and the paper itself notes at the beginning of Sec. 3 that a time-averaged SFR can include contributions from stellar populations older than those responsible for the nebular emission. No test shows that SAG's 5% margin survives the factor-of-2.5 coarser time sampling or the different star formation histories of SAGE and Galacticus, yet Sec. 3.4 applies average SFRs to these models and the abstract and Sec. 5 state the 5% result as a general finding. Please either add a direct test using a coarser SFR output from a model that also tracks a recent burst component, or explicitly restrict the claim to SAG and to the tested SFR time resolution.
- [Sec. 3.2 and Fig. 9] The dust attenuation parameters cos(theta)=0.60 and omega_lambda=0.80 are chosen to obtain the best agreement with the DEEP2+VVDS luminosity functions, as stated in Sec. 3.2. The agreement shown in Fig. 9 is therefore partly a calibration product rather than an independent validation of the get_emlines L[O II] prescription. The paper should explicitly acknowledge this in the conclusions where the luminosity-function agreement is highlighted, and ideally show the sensitivity of the comparison to these two parameters. The internal average-versus-instantaneous ratio analysis in Sec. 3.3 is less affected by this issue because both inputs share the same attenuation model.
- [Abstract, Sec. 3.3, Sec. 5] The abstract states that post-processing L[O II] from average SFRs is accurate to <5% for dust-attenuated L[O II] <~ 10^42.2 erg/s, but Sec. 3.3 reports <5% agreement only in the narrower range 10^41-10^42.2 erg/s and states that the discrepancy grows to about 20% at fainter luminosities. The lower bound is essential and should not be dropped. The paper also gives conflicting lower bounds for the same range (10^41 in Sec. 3.3 and the summary versus 10^40.9 in the final paragraph of Sec. 3.3) and conflicting SFR ranges (10^-0.2 to 10^1.6 in Sec. 3.3 versus 1 to 10^1.5 in Sec. 5). These numbers need to be reconciled because the applicability range is part of the central claim.
minor comments (5)
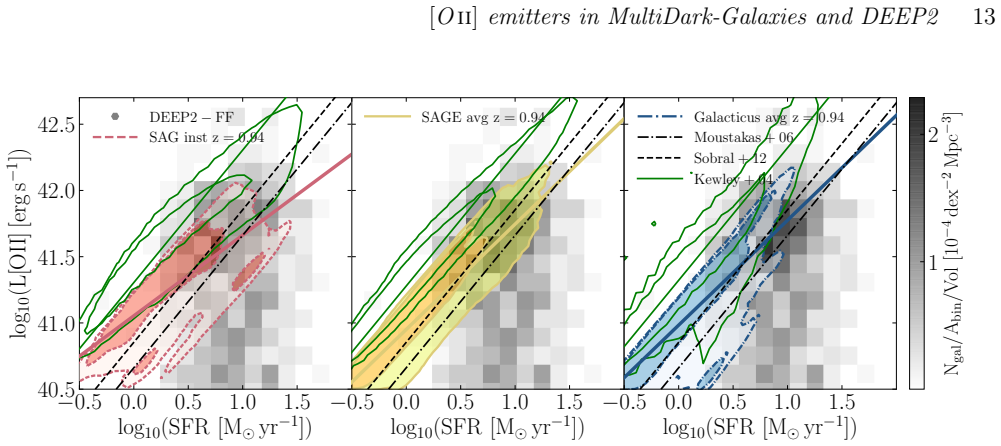
- [Table 2 caption] The caption says the relations use 'the instantaneous SFR for sage and average SFR for sage and galacticus'; the first occurrence should be SAG rather than sage.
- [Fig. C1 and Table C1 caption] The SAGE panels are labelled 'SAGE inst z=0.94' although SAGE provides only average SFRs; this is inconsistent with the main text and should be corrected to avoid confusion.
- [Sec. 3.1] The text refers to the 'BTP diagram' when describing the Baldwin-Phillips-Terlevich diagram; this should read 'BPT diagram'.
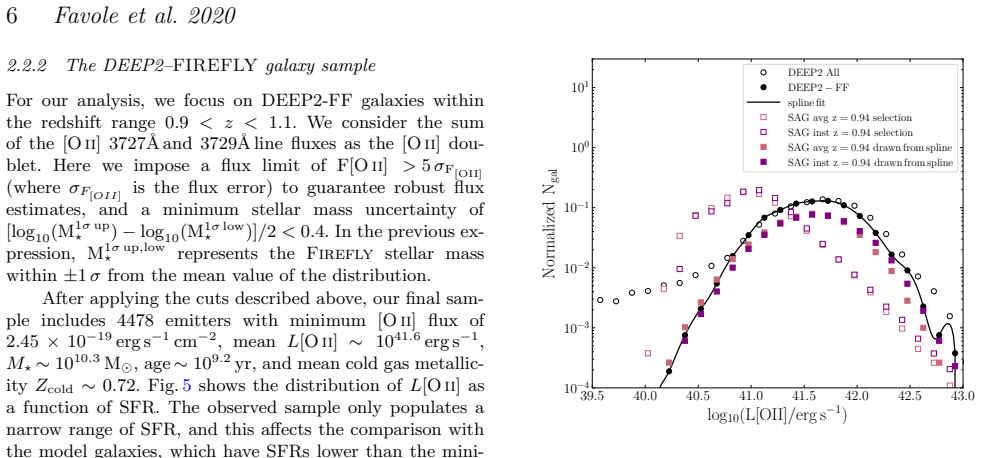
- [Sec. 3.3, Fig. 8] The DEEP2-Firefly comparison is described with the redshift range '0.9 < z < 11' in the text accompanying Fig. 8; this should be '0.9 < z < 1.1'.
- [Sec. 4.4.1] When describing the proxy luminosity functions, the shading is said to come from 100 Gaussian realisations but the covariance between the proxies and L[O II] is not discussed; a brief statement that the scatter is treated as independent would clarify the uncertainty estimate.
Circularity Check
Secondary [OII] luminosity-function validation is partly fitted via dust parameters tuned to DEEP2+VVDS, while the central average-vs-instantaneous SFR result is an independent internal test.
-
fitted input called prediction
[Sec. 3.2 (Eqs. 9-10) and Sec. 3.4 / Fig. 9]
"We assume cosθ = 0.60 and ωλ = 0.80, meaning that the scattering is not isotropic but more forward-oriented, and that 80% of the extinction is scattering. These are the values that return the best agreement with DEEP2+VVDS observations in Fig. 9. ... There are varying degrees of agreement between the models and observational data across the ∼3 decades in [O ii] luminosity and redshift range considered. Nevertheless, the trends from all the data sources are consistent."
The dust attenuation parameters cosθ and ωλ are explicitly tuned to reproduce the DEEP2+VVDS [O ii] luminosity functions, and then the same DEEP2+VVDS comparison is presented in Sec. 3.4 and Fig. 9 as evidence that the model [O ii] luminosity functions agree with observations. Because the attenuation correction was optimized against that exact dataset, the resulting agreement is partly guaranteed by construction and cannot serve as an independent validation of the predicted luminosity functions. This circularity is confined to the secondary LF validation; the central average-vs-instantaneous SFR comparison applies the same attenuation to both inputs and does not reduce to this fit.
full rationale
The core derivation is self-contained: the <5% accuracy claim for post-processing L[OII] from average SFRs is obtained by feeding SAG's instantaneous and average SFRs through the same get_emlines pipeline (Sec. 3.3, Figs. 6-7). Both inputs receive identical dust and photoionization treatment, so the ratio is an internal empirical comparison rather than a fitted result. The paper is also transparent that L[OII] from get_emlines is tightly related to SFR 'by construction' (Sec. 4.4). The one concrete circular step found is the secondary luminosity-function validation: the dust parameters are fitted to DEEP2+VVDS, and the same data are then used to demonstrate agreement in Fig. 9 and the conclusions. The use of get_emlines, calibrated in Orsi et al. (2014) with overlapping authorship, is a disclosed external tool calibration and is not load-bearing for the central result. The extension of the 5% result to SAGE and Galacticus, which output coarser 10-step average SFRs, is an untested transferability assumption; that is a correctness/limitation issue, not a circularity. Overall, the central claim has independent internal grounding, so the paper is only mildly circular.
Assumptions & free parameters
free parameters (4)
- Dust scattering angle cos(theta) =
0.60
- Dust albedo omega_lambda =
0.80
- Ionisation parameter normalization q0 =
2.8e7 cm/s
- Ionisation parameter slope gamma =
1.3
assumptions (5)
- domain assumption Planck 2015 cosmological parameters are assumed throughout (Omega_m=0.6929, Omega_Lambda=0.3071, h=0.6777).
- domain assumption The three semi-analytic models (SAG, SAGE, Galacticus) adequately describe galaxy formation and produce reliable stellar masses and SFRs in the studied redshift range.
- domain assumption The MAPPINGS-III photoionisation model grid, as implemented in get_emlines, correctly predicts relative [OII] fluxes as a function of ionisation parameter and cold gas metallicity.
- domain assumption SAG's instantaneous SFR, defined over the last ~10-25 Myr substep, is the physically relevant timescale for [OII] emission.
- domain assumption The dust attenuation model of Eqs 9-14 (slab geometry, fixed albedo and scattering angle, hydrogen column density from disc scale length) applies uniformly to all model [OII] emitters.
Cite this review
Pith. "Pith review of [OII] emitters in MultiDark-Galaxies and DEEP2." pith.science (2026). https://pith.science/paper/4VHDGHOB
@misc{pith2026190805626,
  author       = {Pith},
  title        = {Pith review of: [OII] emitters in MultiDark-Galaxies and DEEP2},
  year         = {2026},
  howpublished = {\url{https://pith.science/paper/4VHDGHOB}},
  note         = {Machine review of arXiv:1908.05626}
}
abstract
We use three semi-analytic models (SAMs) of galaxy formation and evolution, run on the same 1$h^{-1}$Gpc MultiDark Planck2 cosmological simulation, to investigate the properties of [OII] emission line galaxies in the redshift range $0.6<z<1.2$. We compare model predictions with different observational data sets, including DEEP2--Firefly galaxies with absolute magnitudes. We estimate the [OII] luminosity, L[OII], using simple relations derived both from the models and observations and also using a public code. This code ideally uses as input instantaneous star formation rates (SFRs), which are only provided by one of the SAMs under consideration. We use this SAM to study the feasibility of inferring galaxies' L[OII] for models that only provide average SFRs. We find that the post-processing computation of L[OII] from average SFRs is accurate for model galaxies with dust attenuated L[OII]$\lesssim10^{42.2}$erg s$^{-1}$ ($<5\%$ discrepancy). We also explore how to derive the [OII] luminosity from simple relations using global properties usually output by SAMs. Besides the SFR, the model L[OII] is best correlated with the observed-frame $u$ and $g$ broad-band magnitudes. These correlations have coefficients (r-values) above 0.64 and a dispersion that varies with L[OII]. We use these correlations and an observational one based on SFR and metallicity to derive L[OII]. These relations result in [OII] luminosity functions and halo occupation distributions with shapes that vary depending on both the model and the method used. Nevertheless, for all the considered models, the amplitude of the clustering at scales above 1$h^{-1}$Mpc remains unchanged independently of the method used to derive L[OII].
Figures


Figures from the paper (12 more)







Reference graph
Works this paper leans on
-
[1]
Alam S. et al. , 2015, , 219, 12
2015
-
[2]
G., Groves B
Allen M. G., Groves B. A., Dopita M. A., Sutherland R. S., Kewley L. J., 2008, The Astrophysical Journal Supplement Series, 178, 20
2008
-
[3]
L., Asplund M., 2001, , 556, L63
Allende Prieto C., Lambert D. L., Asplund M., 2001, , 556, L63
2001
-
[4]
J., Scott P., 2009, , 47, 481
Asplund M., Grevesse N., Sauval A. J., Scott P., 2009, , 47, 481
2009
-
[5]
K., Glazebrook K., Driver S
Baldry I. K., Glazebrook K., Driver S. P., 2008, , 388, 945
2008
-
[6]
A., Phillips M
Baldwin J. A., Phillips M. M., Terlevich R., 1981, , 93, 5
1981
-
[7]
M., 2006, Reports of Progress in Physics, 69, 3101
Baugh C. M., 2006, Reports of Progress in Physics, 69, 3101
2006
-
[8]
S., Conroy C., Wechsler R
Behroozi P. S., Conroy C., Wechsler R. H., 2010, , 717, 379
2010
Show all 126 references
-
[9]
S., Wechsler R
Behroozi P. S., Wechsler R. H., Conroy C., 2013, , 770, 57
2013
-
[10]
J., 2010, , 495, 33
Benson A. J., 2010, , 495, 33
2010
-
[11]
J., 2012, , 17, 175
Benson A. J., 2012, , 17, 175
2012
-
[12]
A., Weinberg D
Berlind A. A., Weinberg D. H., 2002, , 575, 587
2002
-
[13]
Boselli A., Cortese L., Boquien M., Boissier S., Catinella B., Lagos C., Saintonge A., 2014, , 564, A66
2014
-
[14]
G., Benson A
Bower R. G., Benson A. J., Malbon R., Helly J. C., Frenk C. S., Baugh C. M., Cole S., Lacey C. G., 2006, , 370, 645
2006
-
[15]
M., Kauffmann G., Tremonti C., White S
Brinchmann J., Charlot S., Heckman T. M., Kauffmann G., Tremonti C., White S. D. M., 2004, ArXiv, astro-ph/0406220
2004 arXiv
-
[16]
C., Kinney A
Calzetti D., Armus L., Bohlin R. C., Kinney A. L., Koornneef J., Storchi-Bergmann T., 2000, , 533, 682
2000
-
[17]
A., Clayton G
Cardelli J. A., Clayton G. C., Mathis J. S., 1989, , 345, 245
1989
-
[18]
Chabrier G., 2003, , 115, 763
2003
-
[19]
Chabrier G., Hennebelle P., Charlot S., 2014, , 796, 75
2014
-
[20]
K., Best P
Cochrane R. K., Best P. N., 2018, , 480, 864
2018
-
[21]
K., Best P
Cochrane R. K., Best P. N., Sobral D., Smail I., Wake D. A., Stott J. P., Geach J. E., 2017, , 469, 2913
2017
-
[22]
A., Lagos C
Collacchioni F., Cora S. A., Lagos C. D. P., Vega-Mart \' nez C. A., 2018, , 481, 954
2018
-
[23]
Comparat J. et al. , 2017, ArXiv e-prints:1711.06575
2017 arXiv
-
[24]
Comparat J. et al. , 2015, , 575, A40
2015
-
[25]
Comparat J. et al. , 2016, , 461, 1076
2016
-
[26]
H., Kravtsov A
Conroy C., Wechsler R. H., Kravtsov A. V., 2006, , 647, 201
2006
-
[27]
M., Norberg P., Padilla N., 2013, , 432, 2717
Contreras S., Baugh C. M., Norberg P., Padilla N., 2013, , 432, 2717
2013
-
[28]
Cooray A., Sheth R., 2002, , 372, 1
2002
-
[29]
A., 2006, , 368, 1540
Cora S. A., 2006, , 368, 1540
2006
-
[30]
Cora S. A. et al. , 2018, , 479, 2
2018
-
[31]
Croton D. J. et al. , 2006, , 365, 11
2006
-
[32]
Croton D. J. et al. , 2016, , 222, 22
2016
-
[33]
Dawson K. S. et al. , 2016, , 151, 44
2016
-
[34]
De Lucia G., Blaizot J., 2007, , 375, 2
2007
-
[35]
J., Fontanot F., Monaco P., 2010, , 406, 1533
De Lucia G., Boylan-Kolchin M., Benson A. J., Fontanot F., Monaco P., 2010, , 406, 1533
2010
-
[36]
Devriendt J. E. G., Guiderdoni B., Sadat R., 1999, , 350, 381
1999
-
[37]
Dickey C. M. et al. , 2016, , 828, L11
2016
-
[38]
T., 2003, Annual Review of Astronomy and Astrophysics, 41, 241
Draine B. T., 2003, Annual Review of Astronomy and Astrophysics, 41, 241
2003
-
[39]
Driver S. P. et al. , 2018, , 475, 2891
2018
-
[40]
Eisenstein D. J. et al. , 2005, , 633, 560
2005
-
[41]
Etherington J. et al. , 2017, , 466, 228
2017
-
[42]
Faber S. M. et al. , 2003, in Society of Photo-Optical Instrumentation Engineers (SPIE) Conference Series, Vol. 4841, Instrument Design and Performance for Optical/Infrared Ground-based Telescopes, Iye M., Moorwood A. F. M., eds., pp. 1657--1669
2003
-
[43]
H., 2013, Secular Evolution of Galaxies
Falc \'o n-Barroso J., Knapen J. H., 2013, Secular Evolution of Galaxies
2013
-
[44]
Favole G. et al. , 2016 a , , 461, 3421
2016
-
[45]
K., Eisenstein D
Favole G., McBride C. K., Eisenstein D. J., Prada F., Swanson M. E., Chuang C.-H., Schneider D. P., 2016 b , , 462, 2218
2016
-
[46]
A., Comparat J., Prada F., Guo H., Klypin A., Montero-Dorta A
Favole G., Rodr \' guez-Torres S. A., Comparat J., Prada F., Guo H., Klypin A., Montero-Dorta A. D., 2017, , 472, 550
2017
-
[47]
S., Johnston K
Font A. S., Johnston K. V., Ferguson A. M. N., Bullock J. S., Robertson B. E., Tumlinson J., Guhathakurta P., 2008, , 673, 215
2008
-
[48]
Gargiulo I. D. et al. , 2015, , 446, 3820
2015
-
[49]
E., Sobral D., Hickox R
Geach J. E., Sobral D., Hickox R. C., Wake D. A., Smail I., Best P. N., Baugh C. M., Stott J. P., 2012, , 426, 679
2012
-
[50]
Gonzalez-Perez V. et al. , 2018, , 474, 4024
2018
-
[51]
G., Baugh C
Gonzalez-Perez V., Lacey C. G., Baugh C. M., Lagos C. D. P., Helly J., Campbell D. J. R., Mitchell P. D., 2014, , 439, 264
2014
-
[52]
A., Dopita M
Groves B. A., Dopita M. A., Sutherland R. S., 2004, The Astrophysical Journal Supplement Series, 153, 9
2004
-
[53]
Gruppioni C. et al. , 2015, , 451, 3419
2015
-
[54]
Guiderdoni B., Rocca-Volmerange B., 1987, , 186, 1
1987
-
[55]
Guo H. et al. , 2018, arXiv:1810.05318 [astro-ph], arXiv: 1810.05318
2018 arXiv
-
[56]
Guo Q. et al. , 2011, , 413, 101
2011
-
[57]
Hatton S., Devriendt J. E. G., Ninin S., Bouchet F. R., Guiderdoni B., Vibert D., 2003, , 343, 75
2003
-
[58]
Henriques B., Maraston C., Monaco P., Fontanot F., Menci N., De Lucia G., Tonini C., 2011, , 415, 3571
2011
-
[59]
Henriques B. M. B., White S. D. M., Thomas P. A., Angulo R., Guo Q., Lemson G., Springel V., Overzier R., 2015, , 451, 2663
2015
-
[60]
Henriques B. M. B., White S. D. M., Thomas P. A., Angulo R. E., Guo Q., Lemson G., Springel V., 2013, , 431, 3373
2013
-
[61]
P., Somerville R
Hirschmann M., Charlot S., Feltre A., Naab T., Choi E., Ostriker J. P., Somerville R. S., 2017, , 472, 2468
2017
-
[62]
Hirschmann M., De Lucia G., Fontanot F., 2016, , 461, 1760
2016
-
[63]
S., Burkert A., Oser L., 2012, , 419, 3200
Hirschmann M., Naab T., Somerville R. S., Burkert A., Oser L., 2012, , 419, 3200
2012
-
[64]
G., Frenk C
Hou J., Lacey C. G., Frenk C. S., 2017, ArXiv e-prints
2017
-
[65]
D., 2007, Computing In Science & Engineering, 9, 90
Hunter J. D., 2007, Computing In Science & Engineering, 9, 90
2007
-
[66]
Izquierdo-Villalba D., Bonoli S., Spinoso D., Rosas-Guevara Y., Henriques B. M. B., Hern \'a ndez-Monteagudo C., 2019, , 488, 609
2019
-
[67]
M., Gonzalez-Perez V., 2019, arXiv e-prints, arXiv:1906.04298
Jim \'e nez E., Contreras S., Padilla N., Zehavi I., Baugh C. M., Gonzalez-Perez V., 2019, arXiv e-prints, arXiv:1906.04298
2019 arXiv
-
[68]
Jouvel S. et al. , 2009, , 504, 359
2009
-
[69]
Kauffmann G., White S. D. M., Guiderdoni B., 1993, , 264, 201
1993
-
[70]
Kennicutt , Jr. R. C., 1998, , 36, 189
1998
-
[71]
J., Geller M
Kewley L. J., Geller M. J., Jansen R. A., 2004, , 127, 2002
2004
-
[72]
Klypin A., Yepes G., Gottl \"o ber S., Prada F., He S., 2016, , 457, 4340
2016
-
[73]
Knebe A. et al. , 2018, , 474, 5206
2018
-
[74]
C., 2013, , 51, 511
Kormendy J., Ho L. C., 2013, , 51, 511
2013
-
[75]
V., Berlind A
Kravtsov A. V., Berlind A. A., Wechsler R. H., Klypin A. A., Gottl \"o ber S., Allgood B., Primack J. R., 2004, , 609, 35
2004
-
[76]
Kroupa P., 2001, , 322, 231
2001
-
[77]
Lagos C. D. P., Baugh C. M., Lacey C. G., Benson A. J., Kim H.-S., Power C., 2011, , 418, 1649
2011
-
[78]
Lagos C. D. P., Cora S. A., Padilla N. D., 2008, , 388, 587
2008
-
[79]
Lagos C. d. P., Lacey C. G., Baugh C. M., 2013, , 436, 1787
2013
-
[80]
D., Szalay A
Landy S. D., Szalay A. S., 1993, , 412, 64
1993
-
[81]
Laureijs R. et al. , 2011, ArXiv e-prints: 1110.3193
2011 arXiv
-
[82]
M., Kewley L
Levesque E. M., Kewley L. J., Graham J. F., Fruchter A. S., 2010, , 712, L26
2010
-
[83]
Li C., White S. D. M., 2009, , 398, 2177
2009
-
[84]
Madau P., Dickinson M., 2014, Annual Review of Astronomy and Astrophysics, 52, 415
2014
-
[85]
Maraston C. et al. , 2013, , 435, 2764
2013
-
[86]
Maraston C., Str \"o mb \"a ck G., 2011, , 418, 2785
2011
-
[87]
M., Papastergis E., Giovanelli R., Haynes M
Martin A. M., Papastergis E., Giovanelli R., Haynes M. P., Springob C. M., Stierwalt S., 2010, , 723, 1359
2010
-
[88]
J., Newman J
Matthews D. J., Newman J. A., Coil A. L., Cooper M. C., Gwyn S. D. J., 2013, , 204, 21
2013
-
[89]
J., Ma C.-P., 2013, , 764, 184
McConnell N. J., Ma C.-P., 2013, , 764, 184
2013
-
[90]
Merson A., Wang Y., Benson A., Faisst A., Masters D., Kiessling A., Rhodes J., 2018, , 474, 177
2018
-
[91]
I., Baugh C
Merson A. I., Baugh C. M., Gonzalez-Perez V., Abdalla F. B., Lagos C. d. P., Mei S., 2016, , 456, 1681
2016
-
[92]
Mohammad F. G. et al. , 2018, , 610, A59
2018
-
[93]
J., De Lucia G., Fontanot F., Borgani S., Boylan-Kolchin M., 2014, , 441, 2058
Monaco P., Benson A. J., De Lucia G., Fontanot F., Borgani S., Boylan-Kolchin M., 2014, , 441, 2058
2014
-
[94]
Moustakas J. et al. , 2013, , 767, 50
2013
-
[95]
Moustakas J., Kennicutt , Jr. R. C., Tremonti C. A., 2006, , 642, 775
2006
-
[96]
M., Navarrete F
Mu \ n oz Arancibia A. M., Navarrete F. P., Padilla N. D., Cora S. A., Gawiser E., Kurczynski P., Ruiz A. N., 2015, , 446, 2291
2015
-
[97]
Newman J. A. et al. , 2013, , 208, 5
2013
-
[98]
Nuza S. E. et al. , 2013, , 432, 743
2013
-
[99]
Orsi \'A ., Padilla N., Groves B., Cora S., Tecce T., Gargiulo I., Ruiz A., 2014, , 443, 799
2014
-
[100]
A., Angulo R
Orsi \'A . A., Angulo R. E., 2018, , 475, 2530
2018
-
[101]
E., 1989, Astrophysics of gaseous nebulae and active galactic nuclei
Osterbrock D. E., 1989, Astrophysics of gaseous nebulae and active galactic nuclei
1989
-
[102]
Pagel B. E. J., Edmunds M. G., Blackwell D. E., Chun M. S., Smith G., 1979, , 189, 95
1979
-
[103]
, 2015, ArXiv e-prints
Planck Collaboration et al. , 2015, ArXiv e-prints
2015
-
[104]
Prugniel P., Soubiran C., Koleva M., Le Borgne D., 2007, ArXiv, astro-ph/0703658
2007 arXiv
-
[105]
Ruiz A. N. et al. , 2015, , 801, 139
2015
-
[106]
Sartoris B. et al. , 2015, ArXiv e-prints: 1505.02165
2015 arXiv
-
[107]
Schlegel D. J. et al. , 2015, in American Astronomical Society Meeting Abstracts, Vol. 225, American Astronomical Society Meeting Abstracts
2015
-
[108]
N., Matsuda Y., Smail I., Geach J
Sobral D., Best P. N., Matsuda Y., Smail I., Geach J. E., Cirasuolo M., 2012, , 420, 1926
2012
-
[109]
S., Dav \'e R., 2015, , 53, 51
Somerville R. S., Dav \'e R., 2015, , 53, 51
2015
-
[110]
Spitzer L., 1978, Physical processes in the interstellar medium
1978
-
[111]
Stevens A. R. H., Brown T., 2017, , 471, 447
2017
-
[112]
Talia M. et al. , 2015, , 582, A80
2015
-
[113]
Tomczak A. R. et al. , 2014, , 783, 85
2014
-
[114]
Tonini C., Maraston C., Devriendt J., Thomas D., Silk J., 2009, , 396, L36
2009
-
[115]
Tremonti C. A. et al. , 2004, , 613, 898
2004
-
[116]
J., 2011, , 742, 16
Trujillo-Gomez S., Klypin A., Primack J., Romanowsky A. J., 2011, , 742, 16
2011
-
[117]
B., Fisher J
Tully R. B., Fisher J. R., 1977, , 54, 661
1977
-
[118]
Valentino F. et al. , 2017, , 472, 4878
2017
-
[119]
M., van den Bosch F
Weinmann S. M., van den Bosch F. C., Yang X., Mo H. J., Croton D. J., Moore B., 2006, , 372, 1161
2006
-
[120]
White S. D. M., Frenk C. S., 1991, , 379, 52
1991
-
[121]
M., Maraston C., Goddard D., Thomas D., Parikh T., 2017, , 472, 4297
Wilkinson D. M., Maraston C., Goddard D., Thomas D., Parikh T., 2017, , 472, 4297
2017
-
[122]
M., 2014, The chemical evolution of galaxies in semi-analytic models and observations
Yates R. M., 2014, The chemical evolution of galaxies in semi-analytic models and observations
2014
-
[123]
Zheng Z. et al. , 2005, , 633, 791
2005
-
[124]
L., Zehavi I., 2007, , 667, 760
Zheng Z., Coil A. L., Zehavi I., 2007, , 667, 760
2007
-
[125]
, " * write output.state after.block = add.period write newline
ENTRY address author booktitle chapter edition editor howpublished institution journal key month note number organization pages publisher school series title type volume year label extra.label sort.label short.list INTEGERS output.state before.all mid.sentence after.sentence a...
-
[126]
write newline
" write newline "" before.all 'output.state := FUNCTION n.dashify 't := "" t empty not t #1 #1 substring "-" = t #1 #2 substring "--" = not "--" * t #2 global.max substring 't := t #1 #1 substring "-" = "-" * t #2 global.max substring 't := while if t #1 #1 substring * t #2 gl...
Reviewed August 14, 2026 · model on record in the stance chip above.
Discussion (0). Continue with ORCID to comment.