REVIEW 3 major objections 6 minor 78 references
IRC+10216 mass loss properties through the study of $\lambda$3mm emission: Large spatial scale distribution of SiO, SiS, and CS
T0 review · 3 major / 6 minor · reviewed 2026-08-14 · deepseek-v4-flash
Pith's one-line read High-resolution millimetre maps of SiO, SiS, and CS around the carbon star IRC+10216 reveal concentric gas shells that the paper argues are direct evidence of episodic mass loss on timescales of hundreds of years.
desk verdict Strong new maps of SiO/SiS/CS in IRC+10216 that will become a reference; the episodic mass-loss conclusion is probably right, but the abstract's 'proves' outruns the model evidence. read the letter →
The pith
A machine-rendered reading of the paper's core claim, the machinery that carries it, and where it could break.
The reading
What carries the argument
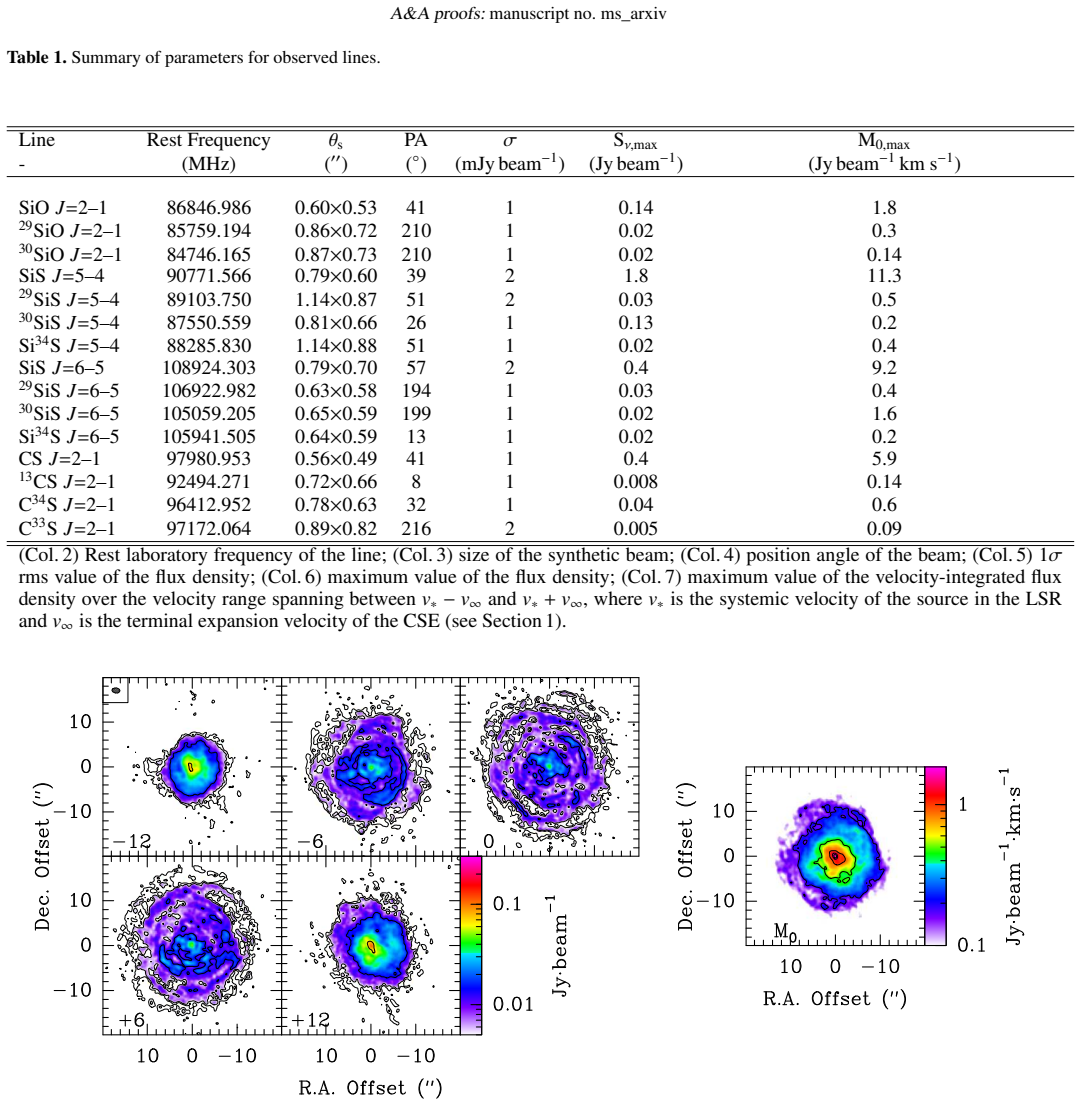
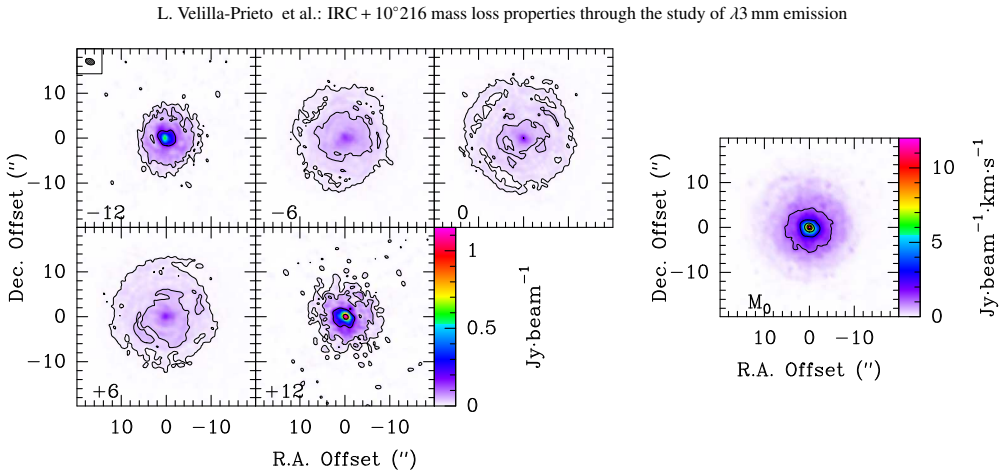
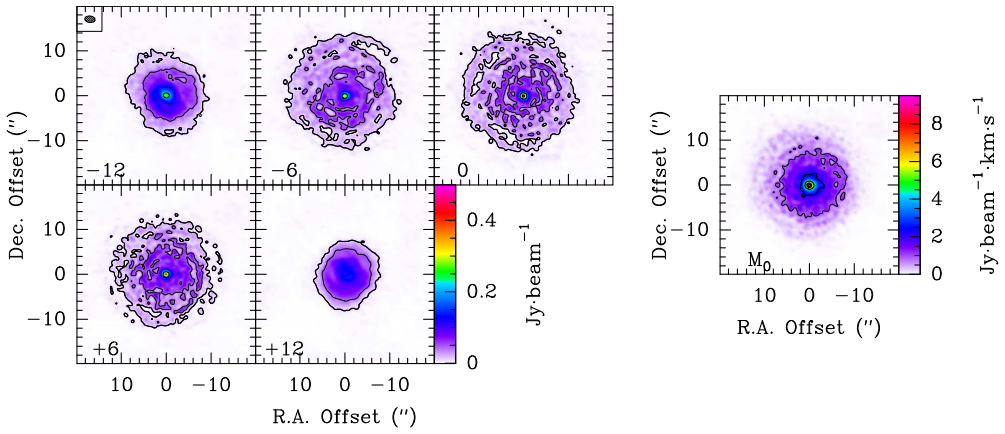
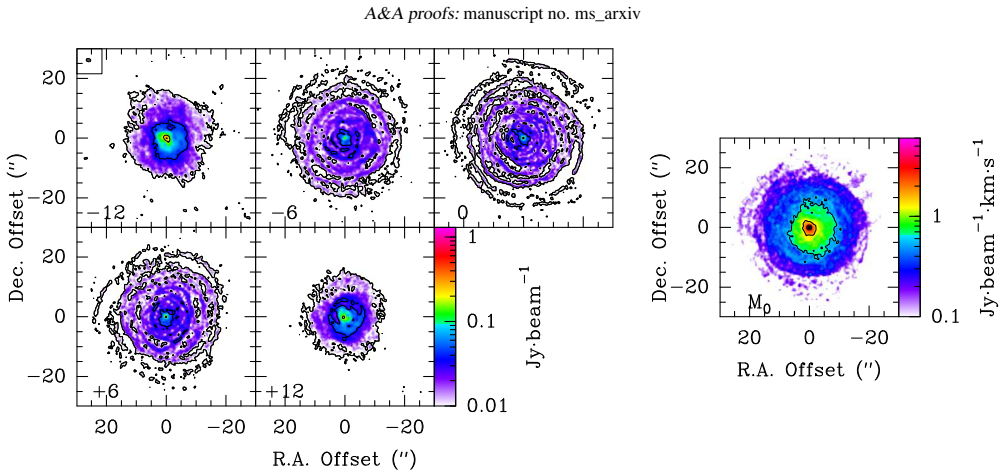
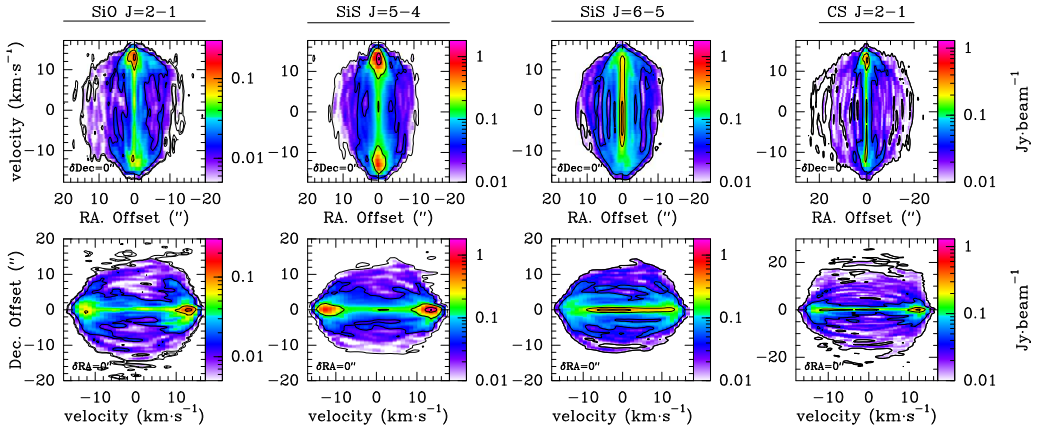
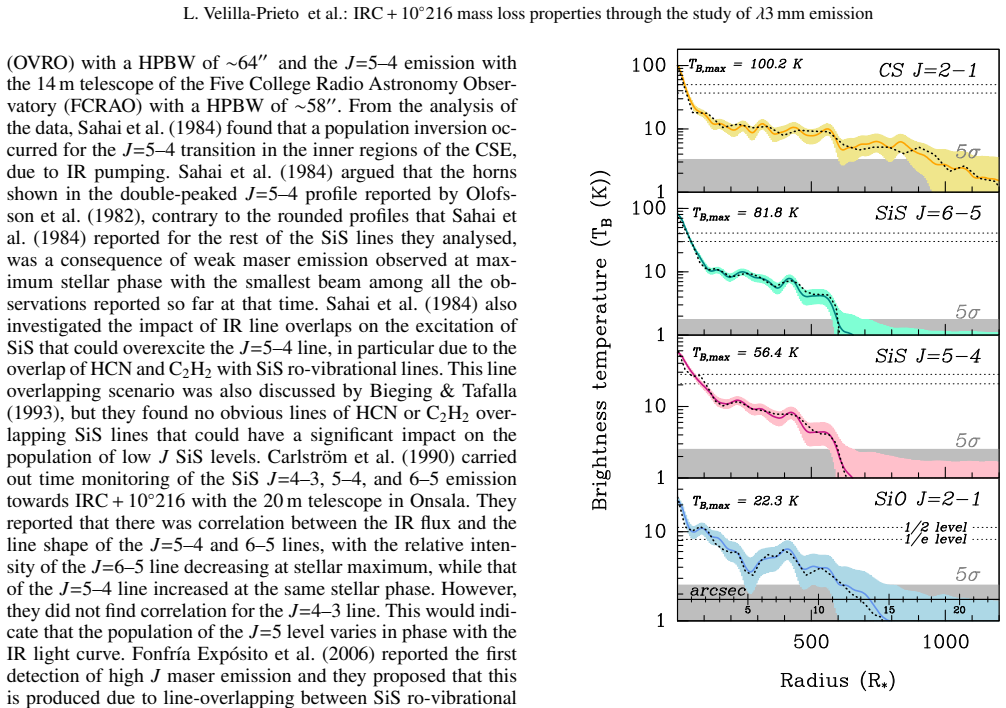
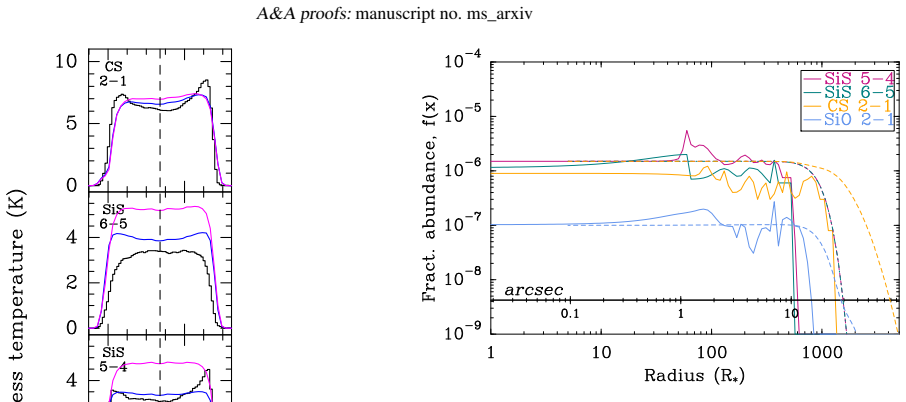
The central device is the azimuthally averaged radial brightness profile of each line in the channel at the source's systemic velocity, the channel that selects gas moving in the plane of the sky. Bumps in these profiles define the shells, and they are compared with predictions of a spherically symmetric large-velocity-gradient radiative-transfer model whose input is a radial fractional-abundance profile per molecule. The model reproduces the average radial decline and the order of photo-dissociation fall-off (SiS first, then SiO, then CS), but it cannot by itself distinguish an over-density from an abundance enhancement; the paper therefore leans on the spatial coincidence of the gas shells with dust arcs seen in earlier scattered-light images to tie the bumps to density. A complementary chemical model with roughly 8,000 reactions predicts the photo-dissociation sequence but not the shell oscillations, which the authors attribute to missing gas-dust surface chemistry.
What would settle it
Map low-J CO or another total-gas tracer at the same angular resolution as these data and check whether the brightness bumps at roughly 2.8, 6, 8.2, and 10.6 arcseconds appear at the same radii. If a total-gas tracer shows no corresponding enhancement, the shells are abundance or excitation features and the episodic mass-loss conclusion does not follow. A second check would be to resolve one shell in at least two rotational lines of the same molecule with different critical densities: if the bump is purely excitation, its apparent radius should shift between lines.
Extended reading notes
Core claim
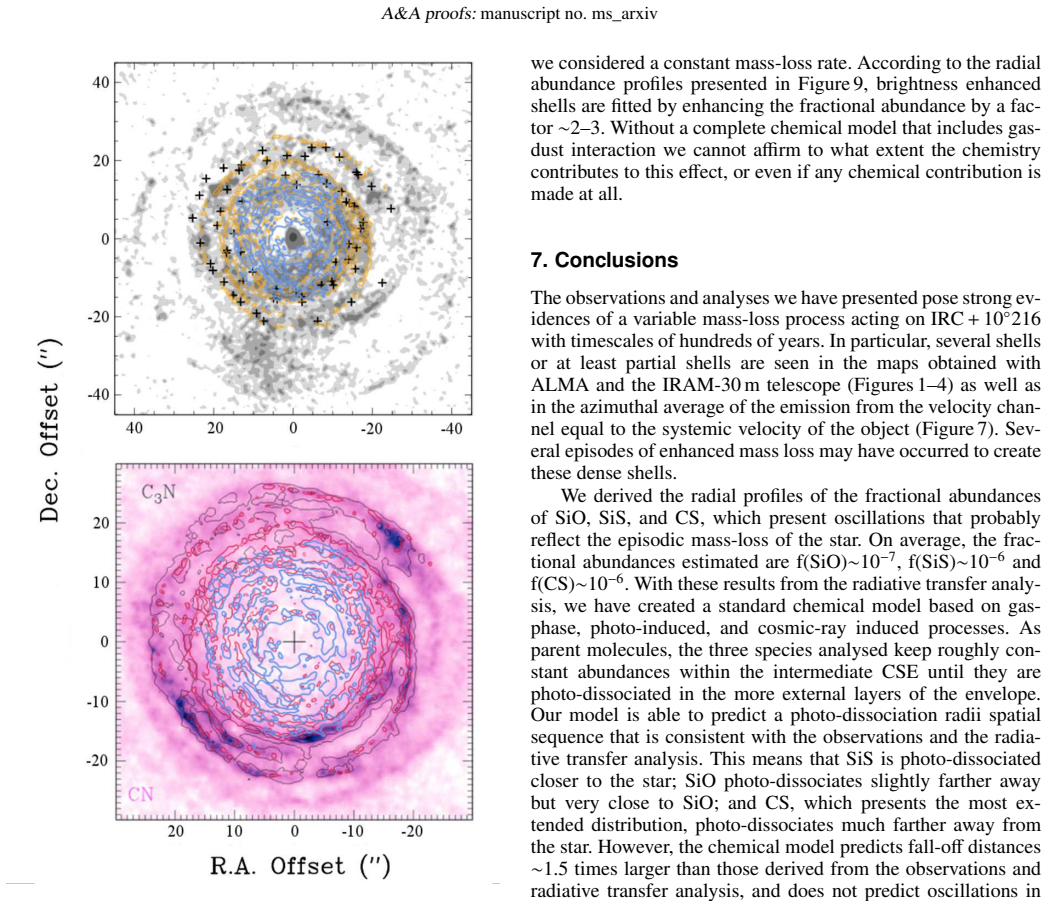
The central claim is that the spatial distribution of the molecular gas around IRC+10216 is inconsistent with a smooth, constant mass-loss wind and instead shows the imprint of episodic mass loss. The evidence is the set of brightness-enhanced shells seen in the azimuthally averaged emission of SiO, SiS, and CS at the systemic velocity, with several shared radii of roughly 150, 315, 420, and 560 $R_*$. Because the shells appear in several molecules at the same locations and line up with dust arcs seen in scattered light, the paper interprets them as over-dense shells formed by enhanced mass-loss events. Under a constant expansion speed of 14.5 km s$^{-1}$, the shell at about 420 $R_*$ has a kinematic age of about 365 years. The paper also measures the radial extent of each species, with CS reaching about 1000 $R_*$, and uses radiative-transfer and chemical models to infer that the envelope is clumpy enough that interstellar ultraviolet radiation can penetrate deeper than a homogeneous wind would allow, shifting photo-dissociation inward.
Load-bearing premise
The bright shells in the maps are really denser gas, not just regions where chemistry or excitation makes the molecules shine brighter; the models cannot tell these apart, so the episodic mass-loss conclusion rests on that identification.
Editorial extensions
If this is right
- The mass-loss rate of IRC+10216 has not been constant over the past few centuries; reproducing the shells requires episodes of enhanced mass loss separated by timescales of hundreds of years.
- The shared shell radii across SiO, SiS, and CS imply that the enhanced episodes affected the envelope roughly isotropically, rather than being limited to one molecule or one direction.
- The photo-dissociation order SiS then SiO then CS means the three molecules probe different depths of the envelope, with CS emission tracing the outer wind out to about 1000 $R_*$.
- Clumpy, low-density regions between shells allow interstellar ultraviolet radiation to penetrate deeper, so photo-dissociation radii inferred from emission sizes are smaller than a smooth-wind model would predict.
- Radiative-transfer fits that reproduce the shells require local abundance enhancements of a factor of 2-3, which the paper notes could equally be read as local density enhancements of similar size.
Reading between the lines
- If the shells are over-dense, a consistent episodic history could be reconstructed from the full set of shell radii and the expansion speed; the paper does not attempt such a reconstruction, but the data would support dating individual mass-loss surges.
- A decisive test would be to map a tracer of total gas column density, such as low-J CO, at comparable resolution: if the same shell radii appear in CO, the density interpretation is confirmed, whereas if only the parent molecules show bumps, chemistry or excitation is the cause.
- The inferred clumpy envelope has a general implication: photo-dissociation calculations for AGB envelopes that assume smooth density will overestimate molecular survival radii whenever mass loss is episodic.
- Because the radiative-transfer model cannot distinguish density from abundance enhancements, observations of multiple rotational lines of the same molecules at the same positions would break the degeneracy and strengthen or weaken the episodic conclusion.
Signed reviews
Editorial analysis
A structured set of objections, weighed in public.
Referee Report
Summary. This paper presents ALMA Band 3 observations at sub-arcsecond resolution combined with IRAM-30m OTF data of several lines of SiO, SiS, and CS (including isotopologues) towards the carbon-rich AGB star IRC+10216. The authors map the spatial distribution, identify arcs and shells in the azimuthal averages, and use an LVG radiative transfer code to derive radial fractional abundance profiles. They then run a chemical model to predict photo-dissociation radii. The main scientific conclusion is that the spatial distribution of the gas proves episodic, variable mass loss on timescales of hundreds of years, with the shell near 420 R* having a kinematic age of ~365 years.
Significance. If confirmed, the result that the observed shells trace over-dense gas episodes would be an important constraint on mass-loss mechanisms in AGB stars. The paper's strengths include the combination of ALMA and IRAM-30m data to recover short-spacing flux, the detection of multiple isotopologues, the careful use of updated collisional rate coefficients, tests of IR pumping, and the public availability of reduced data cubes (stated in the footnote). The spatial coincidence of gas and dust shells (Mauron & Huggins 1999) is a valuable morphological comparison. The paper is honest in acknowledging degeneracies, but the central claim as stated in the abstract overreaches the evidence.
major comments (3)
- [Section 4, Section 6.1] The episodic mass-loss conclusion depends on the brightness-enhanced shells being over-dense. Section 4 explicitly states that the same emission enhancement can be produced by increasing the total gas density or the local fractional abundance, and that "we cannot conclude which of the two scenarios is more realistic" until chemical predictions are tested. The chemical model in Section 5 does not reproduce the abundance oscillations, but the authors attribute this to model simplicity (missing gas-dust interaction, uncertain N_H/A_v, unknown SiS photo-dissociation rate) rather than treating it as evidence against abundance variations. The density interpretation therefore rests on morphological coincidence with dust arcs (Mauron & Huggins 1999) and the absence of an obvious chemical mechanism at ~420 R*. This is an external correlation, not an internal proof, and the abstract's "proves" and Section 7's "pose strong evidences" overstate the support. Please reframe the conclusion as "consistent with" episodic mass loss and discuss how future multi-line observations or gas-grain chemical models could break the degeneracy.
- [Section 5, Table 3, Section 7] The chemical model's parent abundances for CS, SiO, and SiS are taken from the radiative transfer fits to the same observations (Table 3, flagged "This work"), and the SiS photo-dissociation rate is assumed equal to that of SiO (Section 5). The resulting photo-dissociation radius ordering (SiS < SiO < CS) is therefore at least partly inherited from fitted inputs and an assumed rate, not an independent prediction. The conclusions (Section 7) present the chemical model as "able to predict a photo-dissociation radii spatial sequence that is consistent with the observations", which overstates the model's independence. I recommend re-running the chemical model with literature-based parent abundances and a range of SiS photo-dissociation rates to assess robustness, and clearly separating the fitted inputs from the predicted outputs in the presentation.
- [Section 4] The abundance derivation for SiO and CS relies on a single rotational line each, and on two lines for SiS, under the LVG approximation with fixed mass-loss rate, temperature profile, and gas-to-dust ratio taken from the literature. As the paper itself notes, "a perfect fitting could be achieved by modifying the density, the input abundances, and the excitation conditions as a function of radius in different combinations". This degeneracy means the reported abundances (f(SiO)~1e-7, f(SiS)~1e-6, f(CS)~1e-6) and especially the local abundance bumps are not uniquely constrained. Adding an exploration of the density/excitation parameter space or quantitative uncertainty estimates would strengthen the presentation of the radial abundance profiles.
minor comments (6)
- [Abstract and Section 1] The word "subarsecond" appears in the abstract and should read "subarcsecond".
- [Sections 3.1 and 3.2] The adjective "inhomogeneus" appears twice and should read "inhomogeneous".
- [Section 7] In the concluding paragraph, "SiO photo-dissociates slightly farther away but very close to SiO" is tautological; the intended meaning is presumably "very close to SiS". Please correct.
- [Section 5] The statement that N_H/A_v is "1.5 times lower than the classical value" should state explicitly that this lower value is an ad hoc adjustment chosen to reproduce earlier observations, so that its impact on the predicted photo-dissociation radii is transparent.
- [Section 6.2] The text says the chemical model predicts fall-off distances ~1.5 times larger than observed; this is a non-negligible discrepancy that sits somewhat uncomfortably with the abstract's "compatible" characterization. A quantitative statement of the comparison, including calibration and model uncertainties, would help.
- [Figure 7] The figure marks a "5-sigma level detection limit" in each panel, but the text does not explain how this limit was estimated from the azimuthal averages. A sentence in Section 3 describing the procedure would be helpful.
Circularity Check
Chemical-model photo-dissociation 'prediction' inherits fitted abundances and an assumed SiS rate; episodic mass-loss inference itself is externally anchored and not circular.
-
fitted input called prediction
[Section 5 (Chemistry), Table 3; Abstract]
"The abundances taken for these species are presented in Table 3, which are the values used in Agúndez et al. (2017) after updating the abundances of CS, SiO, and SiS according to our results from the radiative transfer analysis. ... In the case of SiS, there are no estimates of its photo-dissociation rate, thus as an educated guess, we assumed the same value than that of SiO."
The paper presents the chemical model as predicting the observed photo-dissociation radii (Abstract: 'Our chemical model predicts photo-dissociation radii compatible with those derived from the observations'), but the parent abundances of CS, SiO, and SiS are re-fit outputs of the same ALMA/IRAM-30m radiative-transfer analysis (Table 3, 'This work'). The shielding parameter N_H/Av is also calibrated to the same team's earlier reproduction of photochemistry-region observations (Agúndez et al. 2017), and the SiS photodissociation rate is assumed equal to that of SiO.
full rationale
The central claim that IRC+10216 undergoes episodic mass loss is not circular: it rests on the observed shell/arc morphology in independent molecular lines and on spatial coincidence with external dust-arc images (Mauron & Huggins 1999), and the paper openly flags the density-versus-abundance degeneracy in Section 4 ('this can also be achieved by increasing the total gas density without a significant increase of the fractional abundance ... we cannot conclude which of the two scenarios is more realistic'). That admitted degeneracy weakens the inference but does not make it a reduction of a prediction to its input. The one circular-adjacent step is the chemical-model comparison: the parent abundances of CS, SiO, and SiS are re-fit outputs of the same radiative-transfer analysis (Table 3), the SiS photodissociation rate is assumed equal to SiO, and the N_H/Av shielding parameter is calibrated with the same team's earlier model (Agúndez et al. 2017), so the claimed 'prediction' of compatible photo-dissociation radii is substantially inherited from fitted and assumed values. However, the predicted falloff radii still depend on independent literature rates and shielding physics and are not identical to the inputs, and the episodic mass-loss conclusion does not rely on the chemical-model agreement; hence the circularity is partial, not total.
Assumptions & free parameters
free parameters (6)
- SiO radial abundance profile =
~1e-7 average, with local enhancements to ~2-3e-7 at shells
- SiS radial abundance profile =
~1-2e-6, mildly decreasing outward, with local enhancements
- CS radial abundance profile =
~1e-6 in inner envelope, ~5e-7 between 100 and 300 R*, with local enhancements
- Local shell abundance enhancement factor =
factor ~2-3 at specific radii (e.g., ~420 R*)
- N_H/A_v ratio scaling =
1.5 times lower than Bohlin et al. (1978) value
- SiS photo-dissociation rate =
assumed equal to SiO rate, 1.6e-9 exp(-2.66 A_v) s^-1
assumptions (7)
- domain assumption The CSE is spherically symmetric and expands at constant velocity (with a three-region velocity law)
- domain assumption The LVG (Sobolev) approximation is valid for these lines
- domain assumption The systemic-velocity channel traces gas in the plane of the sky
- domain assumption Collisional excitation by H2 dominates, with published collisional rate coefficients
- domain assumption The interstellar UV field is the standard Draine (1978) field and the cosmic-ray ionization rate is 1.2e-17 s^-1
- domain assumption The chemical network (UMIST/KIDA plus literature rates) is sufficiently complete to model the outer CSE
- domain assumption The dust and gas are dynamically coupled with gas-to-dust ratio 300 and dust condensation radius 5 R*
Cite this review
Pith. "Pith review of IRC+10216 mass loss properties through the study of $\lambda$3mm emission: Large spatial scale distribution of SiO, SiS, and CS." pith.science (2026). https://pith.science/paper/UX4K3J2B
@misc{pith2026190805652,
  author       = {Pith},
  title        = {Pith review of: IRC+10216 mass loss properties through the study of $\lambda$3mm emission: Large spatial scale distribution of SiO, SiS, and CS},
  year         = {2026},
  howpublished = {\url{https://pith.science/paper/UX4K3J2B}},
  note         = {Machine review of arXiv:1908.05652}
}
abstract
The study of the gas in the envelopes surrounding asymptotic giant branch (AGB) stars through observations in the millimetre wavelength range provides information about the history and nature of these molecular factories. Here we present ALMA observations at subarsecond resolution, complemented with IRAM-30m data, of several lines of SiO, SiS, and CS towards the best-studied AGB circumstellar envelope, IRC+10216. We aim to characterise their spatial distribution and determine their fractional abundances mainly through radiative transfer and chemical modelling. The three species display extended emission with several enhanced emission shells. CS displays the most extended distribution reaching distances up to approximately 20''. SiS and SiO emission have similar sizes of approximately 11'', but SiS emission is slightly more compact. We have estimated fractional abundances relative to H$_2$, which on average are equal to f(SiO)$\sim$10$^{-7}$, f(SiS)$\sim$10$^{-6}$, and f(CS)$\sim$10$^{-6}$ up to the photo-dissociation region. The observations and analysis presented here show evidence that the circumstellar material displays clear deviations from an homogeneous spherical wind, with clumps and low density shells that may allow UV photons from the interstellar medium (ISM) to penetrate deep into the envelope, shifting the photo-dissociation radius inwards. Our chemical model predicts photo-dissociation radii compatible with those derived from the observations, although it is unable to predict abundance variations from the starting radius of the calculations ($\sim$10$R_{*}$), which may reflect the simplicity of the model. We conclude that the spatial distribution of the gas proves the episodic and variable nature of the mass loss mechanism of IRC+10216, on timescales of hundreds of years.
Figures
Figures from the paper (8 more)



Reference graph
Works this paper leans on
-
[1]
Ag \'u ndez, M., & Cernicharo, J.\ 2006, , 650, 374
work page 2006
-
[2]
Ag \'u ndez, M., Cernicharo, J., & Gu \'e lin, M.\ 2007, , 662, L91
work page 2007
-
[3]
Ag \'u ndez, M., Cernicharo, J., & Gu \'e lin, M.\ 2010, , 724, L133
work page 2010
-
[4]
P., Cernicharo, J., et al.\ 2012, , 543, A48
Ag \'u ndez, M., Fonfr \' a, J. P., Cernicharo, J., et al.\ 2012, , 543, A48
2012
-
[5]
Ag \'u ndez, M., Cernicharo, J., Decin, L., Encrenaz, P., & Teyssier, D.\ 2014, , 790, L27
work page 2014
-
[6]
Ag \'u ndez, M., Cernicharo, J., Quintana-Lacaci, G., et al.\ 2017, , 601, A4
work page 2017
-
[7]
Balan c a, C., & Dayou, F.\ 2017, , 469, 1673
work page 2017
- [8]
Show all 78 references
-
[9]
C., Savage, B
Bohlin, R. C., Savage, B. D., & Drake, J. F.\ 1978, , 224, 132
1978
-
[10]
Carlstr\"om, U., Olofsson, H., Johansson, L. E. B., et al.\ 1990, From Miras to Planetary Nebulae: Which Path for Stellar Evolution?, 170
1990
-
[11]
I.\ 1970, , 149, 111
Castor, J. I.\ 1970, , 149, 111
1970
-
[12]
Cernicharo, J., Kahane, C., Gomez-Gonzalez, J., & Guelin, M.\ 1986, , 164, L1
1986
-
[13]
A., Guelin, M., Thaddeus, P., & Vrtilek, J
Cernicharo, J., Gottlieb, C. A., Guelin, M., Thaddeus, P., & Vrtilek, J. M.\ 1989, , 341, L25
1989
-
[14]
Cernicharo, J., Gu \'e lin, M., & Kahane, C.\ 2000, , 142, 181
2000
-
[15]
Cernicharo, J., Waters, L. B. F. M., Decin, L., et al.\ 2010, , 521, L8
2010
-
[16]
Cernicharo, J., Daniel, F., Castro-Carrizo, A., et al.\ 2013, , 778, L25
2013
-
[17]
Cernicharo, J., Teyssier, D., Quintana-Lacaci, G., et al.\ 2014, , 796, L21
2014
-
[18]
Cernicharo, J., Marcelino, N., Ag \'u ndez, M., & Gu \'e lin, M.\ 2015, , 575, A91
2015
-
[19]
Cernicharo, J., Ag \'u ndez, M., Velilla Prieto, L., et al.\ 2017, , 606, L5
2017
-
[20]
Cherchneff, I.\ 2012, , 545, A12
2012
-
[21]
Dayou, F., & Balan c a, C.\ 2006, , 459, 297
2006
-
[22]
De Beck, E., Lombaert, R., Ag \'u ndez, M., et al.\ 2012, , 539, A108
2012
-
[23]
J., et al.\ 2010, , 467, 64
Decin, L., Ag \'u ndez, M., Barlow, M. J., et al.\ 2010, , 467, 64
2010
-
[24]
Denis-Alpizar, O., Stoecklin, T., Guilloteau, S., & Dutrey, A.\ 2018, , 478, 1811
2018
-
[25]
T.\ 1978, , 36, 595
Draine, B. T.\ 1978, , 36, 595
1978
-
[26]
P., Ag \'u ndez, M., Tercero, B., et al.\ 2006, , 646, L127
Fonfr \' a Exp \'o sito, J. P., Ag \'u ndez, M., Tercero, B., et al.\ 2006, , 646, L127
2006
-
[27]
P., Cernicharo, J., Richter, M
Fonfr \' a, J. P., Cernicharo, J., Richter, M. J., & Lacy, J. H.\ 2008, , 673, 445-469
2008
-
[28]
P., Fern \'a ndez-L \'o pez, M., Ag \'u ndez, M., et al.\ 2014, , 445, 3289
Fonfr \' a, J. P., Fern \'a ndez-L \'o pez, M., Ag \'u ndez, M., et al.\ 2014, , 445, 3289
2014
-
[29]
P., Cernicharo, J., Richter, M
Fonfr \' a, J. P., Cernicharo, J., Richter, M. J., et al.\ 2015, , 453, 439
2015
-
[30]
P., Hinkle, K
Fonfr \' a, J. P., Hinkle, K. H., Cernicharo, J., et al.\ 2017, , 835, 196
2017
-
[31]
P., Fern \'a ndez-L \'o pez, M., Pardo, J
Fonfr \' a, J. P., Fern \'a ndez-L \'o pez, M., Pardo, J. R., et al.\ 2018, , 860, 162
2018
-
[32]
Gail, H.-P., & Sedlmayr, E.\ 1986, , 166, 225
1986
-
[33]
Gail, H.-P., Wetzel, S., Pucci, A., & Tamanai, A.\ 2013, , 555, A119
2013
-
[34]
Gail, H.-P., & Sedlmayr, E.\ 2013, Physics and Chemistry of Circumstellar Dust Shells, by Hans-Peter Gail , Erwin Sedlmayr, Cambridge, UK: Cambridge University Press, 2013,
2013
-
[35]
Goldreich, P., & Kwan, J.\ 1974, , 189, 441
1974
-
[36]
Groenewegen, M. A. T.\ 1997, , 317, 503
1997
-
[37]
Groenewegen, M. A. T., Barlow, M. J., Blommaert, J. A. D. L., et al.\ 2012, , 543, L8
2012
-
[38]
Gu \'e lin, M., Lucas, R., & Cernicharo, J.\ 1993, , 280, L19
1993
-
[39]
A., Bremer, M., et al.\ 2018, , 610, A4
Gu \'e lin, M., Patel, N. A., Bremer, M., et al.\ 2018, , 610, A4
2018
-
[40]
J., & Olofsson, H.\ 2003, Asymptotic giant branch stars, by Harm J
Habing, H. J., & Olofsson, H.\ 2003, Asymptotic giant branch stars, by Harm J. Habing and Hans Olofsson. Astronomy and astrophysics library, New York, Berlin: Springer, 2003
2003
-
[41]
I., Kwok, S., Koning, N., et al.\ 2006, , 637, 791
Hasegawa, T. I., Kwok, S., Koning, N., et al.\ 2006, , 637, 791
2006
-
[42]
N., Bosman, A
Heays, A. N., Bosman, A. D., & van Dishoeck, E. F.\ 2017, , 602, A105
2017
-
[43]
A.\ 1974, , 15, 417
H \"o gbom, J. A.\ 1974, , 15, 417
1974
-
[44]
J., & Ridgway, S
Keady, J. J., & Ridgway, S. T.\ 1993, , 406, 199
1993
-
[45]
K os, J., & Lique, F.\ 2008, , 390, 239
2008
-
[46]
C., de Laverny, P., M \'e karnia, D., de Medeiros, J
Le \ a o, I. C., de Laverny, P., M \'e karnia, D., de Medeiros, J. R., & Vandame, B.\ 2006, , 455, 187
2006
-
[47]
Lucas, R., Bujarrabal, V., Guilloteau, S., et al.\ 1992, , 262, 491
1992
-
[48]
Lucas, R., Gu \'e lin, M., Kahane, C., Audinos, P., & Cernicharo, J.\ 1995, , 224, 293
1995
-
[49]
Lucas, R., & Gu \'e lin, M.\ 1999, Asymptotic Giant Branch Stars, 191, 305
1999
-
[50]
G., & Rogers, C.\ 1987, , 322, 374
Martin, P. G., & Rogers, C.\ 1987, , 322, 374
1987
-
[51]
J.\ 1999, , 349, 203
Mauron, N., & Huggins, P. J.\ 1999, , 349, 203
1999
-
[52]
J.\ 2000, , 359, 707
Mauron, N., & Huggins, P. J.\ 2000, , 359, 707
2000
-
[53]
Mauron, N., de Laverny, P., & Lopez, B.\ 2003, , 401, 985
2003
-
[54]
J., et al.\ 2013, , 550, A36
McElroy, D., Walsh, C., Markwick, A. J., et al.\ 2013, , 550, A36
2013
-
[55]
P., Waters, B., Schiebel, D., Young, W., & Golap, K.\ 2007, Astronomical Data Analysis Software and Systems XVI, 376, 127
McMullin, J. P., Waters, B., Schiebel, D., Young, W., & Golap, K.\ 2007, Astronomical Data Analysis Software and Systems XVI, 376, 127
2007
-
[56]
M., Reid, M
Menten, K. M., Reid, M. J., Kami \'n ski, T., & Claussen, M. J.\ 2012, , 543, A73
2012
-
[57]
B.\ 1969, NASA SP, Washington: NASA, 1969
Neugebauer, G., & Leighton, R. B.\ 1969, NASA SP, Washington: NASA, 1969
1969
-
[58]
Olofsson, H., Johansson, L. E. B., Hjalmarson, A., & Nguyen-Quang-Rieu 1982, , 107, 128
1982
-
[59]
Olofsson, H., Bergman, P., Eriksson, K., & Gustafsson, B.\ 1996, , 311, 587
1996
-
[60]
A., Young, K
Patel, N. A., Young, K. H., Gottlieb, C. A., et al.\ 2011, , 193, 17
2011
-
[61]
J., Cieszewski, R., Stancil, P
Pattillo, R. J., Cieszewski, R., Stancil, P. C., et al.\ 2018, , 858, 10
2018
-
[62]
Pety, J., & Rodr \' guez-Fern \'a ndez, N.\ 2010, , 517, A12
2010
-
[63]
J.\ 1988, , 326, 843
Ridgway, S., & Keady, J. J.\ 1988, , 326, 843
1988
-
[64]
S \'a nchez Contreras, C., Velilla Prieto, L., Ag \'u ndez, M., et al.\ 2015, , 577, A52
2015
-
[65]
Sahai, R., Wootten, A., & Clegg, R. E. S.\ 1984, , 284, 144
1984
-
[66]
L., Fong, D., Olofsson, H., Zhang, Q., & Patel, N.\ 2006, , 649, 965
Sch \"o ier, F. L., Fong, D., Olofsson, H., Zhang, Q., & Patel, N.\ 2006, , 649, 965
2006
-
[67]
J., Justtanont, K., Tielens, A
Skinner, C. J., Justtanont, K., Tielens, A. G. G. M., et al.\ 1999, , 302, 293
1999
-
[68]
V.\ 1960, Cambridge: Harvard University Press, 1960
Sobolev, V. V.\ 1960, Cambridge: Harvard University Press, 1960
1960
-
[69]
B., Penzias, A
Solomon, P., Jefferts, K. B., Penzias, A. A., & Wilson, R. W.\ 1971, , 163, L53
1971
-
[70]
G., Dewdney, P
Steer, D. G., Dewdney, P. E., & Ito, M. R.\ 1984, , 137, 159
1984
-
[71]
Tobo a, R., Lique, F., K os, J., & Cha asi \'n ski, G.\ 2008, Journal of Physics B Atomic Molecular Physics, 41, 155702
2008
-
[72]
E.\ 1971, , 163, L35
Turner, B. E.\ 1971, , 163, L35
1971
-
[73]
J.\ 2019, , 873, 36
Van de Sande, M., & Millar, T. J.\ 2019, , 873, 36
2019
-
[74]
Velilla Prieto, L., Cernicharo, J., Quintana-Lacaci, G., et al.\ 2015, , 805, L13
2015
-
[75]
Velilla Prieto, L., S \'a nchez Contreras, C., Cernicharo, J., et al.\ 2017, , 597, A25
2017
-
[76]
Wakelam, V., Loison, J.-C., Herbst, E., et al.\ 2015, , 217, 20
2015
-
[77]
Woitke, P.\ 2006, , 452, 537
2006
-
[78]
Zanchet, A., Roncero, O., Ag \'u ndez, M., & Cernicharo, J.\ 2018, , 862, 38
2018
Reviewed August 14, 2026 · model on record in the stance chip above.
Discussion (0). Continue with ORCID to comment.