REVIEW 2 major objections 3 minor 42 references
Task Bench: A Parameterized Benchmark for Evaluating Parallel Runtime Performance
T0 review · 2 major / 3 minor · reviewed 2026-08-14 · deepseek-v4-flash
Pith's one-line read Task Bench claims that separating benchmark specification from runtime implementation cuts benchmarking cost from $O(mn)$ to $O(m+n)$, and that measured overheads show 100 microseconds as the practical floor on task granularity at scale.
desk verdict Task Bench is a real step forward in runtime benchmarking—the O(m+n) separation and METG are worth the field's attention, but the 100us bound is scoped to their task-graph patterns, not a universal law. read the letter →
The pith
A machine-rendered reading of the paper's core claim, the machinery that carries it, and where it could break.
The reading
What carries the argument
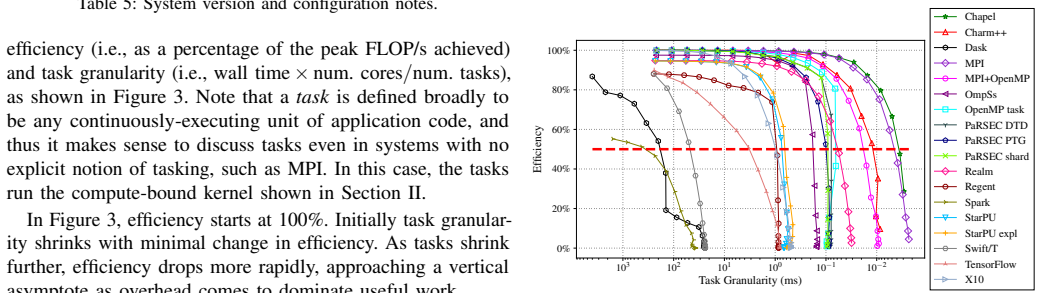
The central object is Task Bench itself, a parameterized task-graph benchmark: a two-dimensional iteration space (time steps by parallel columns) with a configurable dependence relation, kernel, and per-dependency payload. The load-bearing mechanism is the separation between the graph specification and a small core API shared by all implementations, which makes each new system an $O(1)$ adapter and each new benchmark an $O(1)$ graph description. The other key object is the METG(50%) metric, defined as the smallest average task duration at which an application keeps at least 50 percent of its peak achievable performance; it converts a raw FLOP/s-versus-problem-size curve into a single overhead number that behaves predictably under weak and strong scaling.
What would settle it
Take a production application whose average task duration is below 100 microseconds and run it on 256 nodes with one of the lowest-overhead systems studied; if strong-scaling efficiency stays at or above 50% at node counts where the paper's METG curve predicts it should fall, the 100-microsecond floor is violated. A cheaper test is to implement a new dependence pattern from a real irregular workload (for example, variable-degree sparse-matrix dependencies) in Task Bench and measure METG(50%); if its METG differs from the stencil, nearest, spread, FFT, sweep, tree, and random patterns by more than the observed spread, the built-in patterns are not representative.
Extended reading notes
Core claim
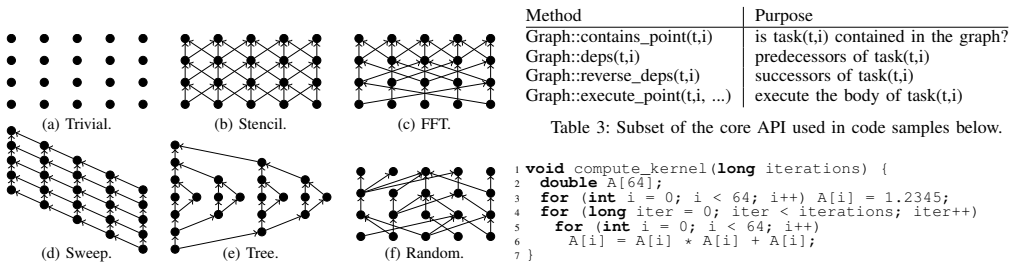
Task Bench's central discovery is that benchmark design and runtime implementation can be made orthogonal. Every benchmark is written once as a task graph with tunable height, width, dependence pattern, kernel type, payload size, and load imbalance; a shared core API provides kernels and graph utilities, while each of the 15 systems supplies a thin adapter implementing 'execute this task' and 'transfer this data.' This reduces developer effort from $O(mn)$ to $O(m+n)$ for $m$ benchmarks on $n$ systems. Using this setup, the paper measures minimum effective task granularity, METG(50%), for each system across node counts and dependence patterns, finding overheads that vary by over five orders of magnitude, with the best systems reaching sub-microsecond METG for trivial dependencies but roughly an order of magnitude worse at 256 nodes or with nontrivial dependencies. The paper's headline quantitative conclusion is that 100 microseconds is a realistic lower bound on task granularity for nearly any application running at scale with current technologies.
Load-bearing premise
The whole study transfers to real applications only if the six task-graph patterns and two kernels in Task Bench capture the dependency structures and computational shapes of actual parallel workloads; if real applications have different dependency structures, the measured METG values and the 100-microsecond rule would not generalize.
Editorial extensions
If this is right
- Any new benchmark written as a Task Bench graph runs immediately on all 15 systems, and any new runtime needs only an adapter; comparative studies can grow far beyond the 6-7 systems that previous proxy-app efforts reached.
- METG(50%) measured in place predicts strong-scaling behavior: the intersection of the efficiency-limited time-to-solution curve with ideal scaling estimates the node count at which efficiency drops below 50%, with mean separation from actual measurements of at most 1.96x in node count in the patterns tested.
- A practical floor of 100 microseconds per task at scale means application developers choosing a runtime should not assume fine-grained tasks will run efficiently; tasks below this granularity are dominated by runtime and communication overhead in every current system.
- Asynchronous systems pay off only when their baseline overhead stays near 100 microseconds per task; above that, their load-balancing and communication-hiding benefits are nullified by overhead.
- Implicitly parallel task-based systems that discover dependencies via runtime analysis show sequential bottlenecks as node count grows, while compile-time approaches such as control replication achieve constant per-node overhead, guiding where runtime design should invest.
Reading between the lines
- Over time, METG could serve as a standard yardstick for runtime improvements: re-running the same Task Bench configuration after a runtime release would show whether scheduler, communication, or graph-analysis changes actually lowered the 100-microsecond floor, an extension the paper does not itself pursue.
- Because the 100-microsecond figure is tied to current interconnect latencies and runtime implementations, it should be re-derived as networks and accelerators evolve; the paper's method, not the number, is the durable contribution.
- Task Bench's parameter space could be extended to dependency patterns from real irregular applications, such as sparse solvers or adaptive mesh refinement; comparing their METG curves to the six built-in patterns would test whether the reported bound transfers to those workloads.
Signed reviews
Editorial analysis
A structured set of objections, weighed in public.
Referee Report
Summary. The paper presents Task Bench, a parameterized benchmark that separates the specification of task-graph benchmarks from implementations in specific programming systems, so that one implementation per system runs all benchmarks. The authors implement Task Bench in 15 distributed and parallel programming systems, evaluate them on up to 256 nodes of Cori (plus GPU experiments on Piz Daint), and introduce a new metric, minimum effective task granularity (METG), defined as the smallest average task duration at which an application maintains 50% efficiency relative to its measured peak. Using METG they report that runtime overheads vary by five orders of magnitude across systems, that 100 us is a practical lower bound on task granularity at scale with current technologies, that METG can be used to estimate strong-scaling limits, and that Task Bench helped discover several performance bugs in existing runtimes.
Significance. If the claims hold, this is a genuinely useful contribution to the parallel-systems benchmarking literature. The O(m+n) separation of benchmark and implementation is an important design idea, and the comparison of 15 systems on a common set of parameterized patterns is far broader than prior studies. The METG metric is a clear improvement over raw tasks-per-second because it constrains useful work, and the paper provides a quantitative validation (Table 6) of the relationship between METG and strong scaling. The paper also credits system developers and reports several acknowledged performance bugs, which is a positive and reproducible form of contribution. The main weakness is that the breadth of the task-graph model is claimed as 'without loss of generality,' but that claim is not overhead-preserving, and the 100 us rule is extrapolated from a restricted pattern class.
major comments (2)
- [Section II, paragraph after Table 1; Section VIII, conclusion bullet] The statement that constraining the iteration space to two dimensions with dependencies only on the immediately preceding time step is 'without loss of generality' is not valid when the measured quantity is per-task runtime overhead. Any application DAG with edges spanning more than one time step must be represented by inserting intermediate tasks and dependencies, and each inserted task incurs real scheduling, communication, and dependency-checking overhead in every implementation. The six patterns in Table 2 and Figure 1 therefore cover only layered graphs with unit-depth edges, and the paper gives no argument that this class is overhead-equivalent to the 'large space of application behaviors' claimed in Section I. Since the 100 us rule in the abstract and Section VIII is an extrapolation from METG measurements over this restricted space, it is not established for applications with arbitrary dependency structure (e.g., sparse direct solvers, AMR with temporal subcycling, asynchronous event-driven codes). The authors should either restrict the generalization claims to the layered-graph class, add a formal statement of what the reduction preserves (task graph structure, but not overhead), or provide empirical evidence that overhead is insensitive to the depth of dependency edges.
- [Section V-I, Figure 14 and Table 6] The claim that METG 'predicts' strong scaling is stronger than what the experiments support. METG(50%) is measured separately at each node count, as described in Section IV and shown in Figure 9, so the 'limit 50%' curve at node count N is constructed from measurements taken at that same node count, not from the one-node application run alone. The agreement in Table 6 is therefore an in-sample consistency check between two ways of estimating efficiency at a given node count, rather than an independent prediction of scaling from small-scale data. If the intended claim is that one-node measurements suffice, the paper would need a model of how METG depends on node count; otherwise the text should characterize the method as a consistency-based estimate and should state clearly which inputs (one-node run plus METG at all node counts) are required.
minor comments (3)
- [Section V, Figures 6-14] Most figures report only point values; Figure 6 states that each point is a mean of 5 runs, but no standard deviations or confidence intervals are given for the METG values and efficiency curves that drive the 100 us and five-orders-of-magnitude conclusions. Please add variance information or a justification that run-to-run variability is negligible.
- [Section V-A and Figure 7] The text says that in most cases task granularity asymptotes prior to the 50% efficiency line, and that some systems continue to improve at lower values. It would be useful to state explicitly which systems do not reach 50% efficiency in which configurations, and how missing METG values are handled in the summary plots such as Figure 9.
- [Section V-B, Figure 8] The text says nearly all systems hit 100% of peak memory bandwidth, but the figure appears to show several systems clearly below 79 GB/s; please reconcile the textual claim with the plotted data.
Circularity Check
Core METG measurements and the 100 us bound are self-contained; the only definitional tautology is the Section V-I 'limit 50%' strong-scaling validation, which is an in-sample consistency check rather than an independent prediction.
-
self definitional
[Section V-I, Figure 14 and Table 6]
"Lines marked 'actual' represent strong scaling measurements, while ones marked 'limit 50%' are computed by multiplying METG(50%) by tasks per core (in this case, 1000) to obtain wall clock time. Intuitively, 'limit' is the smallest time to solution that can be achieved for any problem size at that node count, while maintaining 50% efficiency."
Section IV defines task granularity as wall time times cores divided by task count, so wall time equals granularity times tasks per core, and METG(50%) is by definition the granularity at which efficiency is 50%. Therefore the 'limit 50%' curve is just the METG definition rearranged into wall-clock units; the intersection with 'actual' is forced to occur where granularity equals METG, i.e., where efficiency is 50%. The claimed 'validation' is an algebraic consistency check on the same systems and patterns, not an independent prediction of strong-scaling behavior.
full rationale
Task Bench's central results are measurements, not derived predictions: METG(50%) is defined directly from efficiency-versus-granularity curves and read off Figures 3 and 7, with no fitted parameters. The 100 us 'reasonable bound' is an inductive summary of those measurements, and the O(m+n) effort claim is a design property of the core-API separation. The self-citations to Realm, Regent, and Control Replication [16], [17], [19] are used to explain implementation mechanisms or to reference prior system work; they are not the evidence for the paper's comparative METG numbers, which come from measurements in this paper. The one definitional tautology is the Section V-I 'limit 50%' strong-scaling prediction: it is computed by multiplying METG by tasks per core, which is the definition of METG converted to time units, so the match with 'actual' curves is an in-sample consistency check. This does not undermine the METG metric or the overhead comparisons, but it means the strong-scaling 'prediction' is not an independent empirical forecast. Overall circularity is minor.
Assumptions & free parameters
free parameters (1)
- METG efficiency threshold =
50%
assumptions (4)
- domain assumption Many parallel applications can be modeled as task graphs with tasks as vertices and dependencies as edges
- domain assumption The implemented dependence patterns (trivial, stencil, FFT, sweep, tree, random) and kernels (compute, memory) are representative of larger applications
- domain assumption The 15 system implementations are of comparable quality and fairly configured
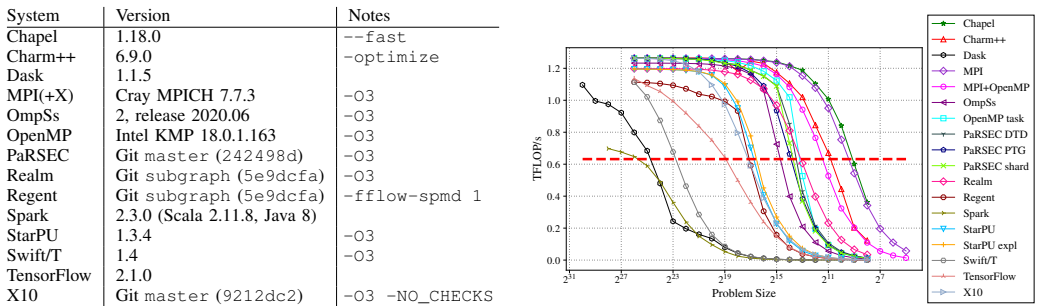
- domain assumption The measured peak performance values (1.26 TFLOP/s per node, 79 GB/s memory bandwidth) are correct baselines
Cite this review
Pith. "Pith review of Task Bench: A Parameterized Benchmark for Evaluating Parallel Runtime Performance." pith.science (2026). https://pith.science/paper/BJQ57DKT
@misc{pith2026190805790,
  author       = {Pith},
  title        = {Pith review of: Task Bench: A Parameterized Benchmark for Evaluating Parallel Runtime Performance},
  year         = {2026},
  howpublished = {\url{https://pith.science/paper/BJQ57DKT}},
  note         = {Machine review of arXiv:1908.05790}
}
read the original abstract
We present Task Bench, a parameterized benchmark designed to explore the performance of parallel and distributed programming systems under a variety of application scenarios. Task Bench lowers the barrier to benchmarking multiple programming systems by making the implementation for a given system orthogonal to the benchmarks themselves: every benchmark constructed with Task Bench runs on every Task Bench implementation. Furthermore, Task Bench's parameterization enables a wide variety of benchmark scenarios that distill the key characteristics of larger applications. We conduct a comprehensive study with implementations of Task Bench in 15 programming systems on up to 256 Haswell nodes of the Cori supercomputer. We introduce a novel metric, minimum effective task granularity to study the baseline runtime overhead of each system. We show that when running at scale, 100 {\mu}s is the smallest granularity that even the most efficient systems can reliably support with current technologies. We also study each system's scalability, ability to hide communication and mitigate load imbalance.
Figures


Figures from the paper (8 more)


Reference graph
Works this paper leans on
-
[1]
Exploring traditional and emerging parallel programming models using a proxy application,
I. Karlin, A. Bhatele, J. Keasler, B. L. Chamberlain, J. Cohen, Z. Devito, R. Haque, D. Laney, E. Luke, F. Wang, D. Richards, M. Schulz, and C. H. Still, “Exploring traditional and emerging parallel programming models using a proxy application,” in International Parallel and Distributed Processing Symposium (IPDPS) . IEEE, 2013
work page 2013
-
[2]
Performance portability across diverse computer architectures,
T. Deakin, S. McIntosh-Smith, J. Price, A. Poenaru, P. Atkinson, C. Popa, and J. Salmon, “Performance portability across diverse computer architectures,” in Workshop on Performance, Portability and Productivity in HPC (P3HPC) . IEEE, 2019, pp. 1–13
work page 2019
-
[3]
Canary: A Scheduling Architecture for High Performance Cloud Computing
H. Qu, O. Mashayekhi, D. Terei, and P. Levis, “Canary: A scheduling architecture for high performance cloud computing,” CoRR, vol. abs/1602.01412, 2016. [Online]. Available: http://arxiv.org/abs/1602. 01412
work page Pith review arXiv 2016
-
[4]
Com- piler techniques for massively scalable implicit task parallelism,
T. G. Armstrong, J. M. Wozniak, M. Wilde, and I. T. Foster, “Com- piler techniques for massively scalable implicit task parallelism,” in Supercomputing (SC), 2014
work page 2014
-
[5]
Dynamic Tracing: Memoization of task graphs for dynamic task-based runtimes,
W. Lee, E. Slaughter, M. Bauer, S. Treichler, T. Warszawski, M. Garland, and A. Aiken, “Dynamic Tracing: Memoization of task graphs for dynamic task-based runtimes,” in Supercomputing (SC), 2018
work page 2018
-
[6]
“Cori Configuration,” https://www.nersc.gov/users/ computational-systems/cori/configuration/, 2015
work page 2015
-
[7]
Communicating sequential processes,
C. A. R. Hoare, “Communicating sequential processes,” Communications of the ACM , vol. 21, no. 8, pp. 666–677, 1978
work page 1978
-
[8]
M. Snir, S. Otto, S. Huss-Lederman, D. Walker, and J. Dongarra,MPI-The Complete Reference. MIT Press, 1998
work page 1998
Show all 42 references
-
[9]
B. L. Chamberlain, “Chapel,” in Programming Models for Parallel Computing, P. Balaji, Ed. MIT Press, 2015, pp. 129–159
2015
-
[10]
CHARM++: A portable concurrent object oriented system based on C++,
L. V . Kalé and S. Krishnan, “CHARM++: A portable concurrent object oriented system based on C++,” in OOPSLA, 1993, pp. 91–108
1993
-
[11]
X10: An object-oriented approach to non- uniform cluster computing,
P. Charles, C. Grothoff, V . Saraswat, C. Donawa, A. Kielstra, K. Ebcioglu, C. V on Praun, and V . Sarkar, “X10: An object-oriented approach to non- uniform cluster computing,” in OOPSLA, 2005
2005
-
[12]
OmpSs: A proposal for programming heterogeneous multi-core architectures,
A. Duran, E. Ayguadé, R. M. Badia, J. Labarta, L. Martinell, X. Martorell, and J. Planas, “OmpSs: A proposal for programming heterogeneous multi-core architectures,” Parallel Processing Letters, vol. 21, no. 02, pp. 173–193, 2011
2011
-
[13]
OpenMP application program interface,
“OpenMP application program interface,” http://www.openmp.org/ wp-content/uploads/OpenMP4.0.0.pdf, 2013
2013
-
[14]
PaRSEC: Exploiting heterogeneity to enhance scalability,
G. Bosilca, A. Bouteiller, A. Danalis, M. Faverge, T. Hérault, and J. J. Dongarra, “PaRSEC: Exploiting heterogeneity to enhance scalability,” Computing in Science & Engineering , vol. 15, no. 6, pp. 36–45, 2013
2013
-
[15]
Dynamic task discovery in PaRSEC: A data-flow task-based runtime,
R. Hoque, T. Herault, G. Bosilca, and J. Dongarra, “Dynamic task discovery in PaRSEC: A data-flow task-based runtime,” in Proceedings of the 8th Workshop on Latest Advances in Scalable Algorithms for Large-Scale Systems , ser. ScalA ’17. New York, NY , USA: ACM, 2017, pp. 6:1–6...
2017
-
[16]
Realm: An event-based low-level runtime for distributed memory architectures,
S. Treichler, M. Bauer, and A. Aiken, “Realm: An event-based low-level runtime for distributed memory architectures,” in Parallel Architectures and Compilation Techniques (PACT), 2014
2014
-
[17]
Regent: A high-productivity programming language for HPC with logical regions,
E. Slaughter, W. Lee, S. Treichler, M. Bauer, and A. Aiken, “Regent: A high-productivity programming language for HPC with logical regions,” in Supercomputing (SC), 2015
2015
-
[18]
StarPU: A unified platform for task scheduling on heterogeneous multicore architectures,
C. Augonnet, S. Thibault, R. Namyst, and P.-A. Wacrenier, “StarPU: A unified platform for task scheduling on heterogeneous multicore architectures,” Concurrency and Computation: Practice and Experience , vol. 23, pp. 187–198, Feb. 2011
2011
-
[19]
Control Replication: Compiling implicit parallelism to efficient SPMD with logical regions,
E. Slaughter, W. Lee, S. Treichler, W. Zhang, M. Bauer, G. Shipman, P. McCormick, and A. Aiken, “Control Replication: Compiling implicit parallelism to efficient SPMD with logical regions,” in Supercomputing (SC), 2017
2017
-
[20]
Dask: Parallel computation with blocked algorithms and task scheduling,
M. Rocklin, “Dask: Parallel computation with blocked algorithms and task scheduling,” in Python in Science Conference (SciPy) , no. 130-136. Citeseer, 2015
2015
-
[21]
Spark: Cluster computing with working sets,
M. Zaharia, M. Chowdhury, M. J. Franklin, S. Shenker, and I. Stoica, “Spark: Cluster computing with working sets,” HotCloud, vol. 10, pp. 10–10, 2010
2010
-
[22]
TensorFlow: Large-scale machine learning on heterogeneous systems,
M. Abadi, A. Agarwal, P. Barham, E. Brevdo, Z. Chen, C. Citro, G. S. Corrado, A. Davis, J. Dean, M. Devin, S. Ghemawat, I. Goodfellow, A. Harp, G. Irving, M. Isard, Y . Jia, R. Jozefowicz, L. Kaiser, M. Kudlur, J. Levenberg, D. Mané, R. Monga, S. Moore, D. Murray, C. Olah, M. ...
2015
-
[23]
Swift/T: Large-scale application composition via distributed- memory dataflow processing,
J. M. Wozniak, T. G. Armstrong, M. Wilde, D. S. Katz, E. Lusk, and I. T. Foster, “Swift/T: Large-scale application composition via distributed- memory dataflow processing,” in Cluster, Cloud and Grid Computing (CCGrid), 2013
2013
-
[24]
Technical Report - CSCS,
“Technical Report - CSCS,” https://user.cscs.ch/access/report, 2019
2019
-
[25]
Piz Daint - CSCS,
“Piz Daint - CSCS,” http://www.cscs.ch/computers/piz_daint, 2016
2016
-
[26]
STREAM benchmark,
J. D. McCalpin, “STREAM benchmark,” https://www.cs.virginia.edu/ stream/, 1995
1995
-
[27]
PENNANT: an unstructured mesh mini-app for advanced architecture research,
C. R. Ferenbaugh, “PENNANT: an unstructured mesh mini-app for advanced architecture research,” Concurrency and Computation: Practice and Experience, 2014
2014
-
[28]
Optimizing PGAS overhead in a multi-locale Chapel implementation of CoMD,
R. Haque and D. Richards, “Optimizing PGAS overhead in a multi-locale Chapel implementation of CoMD,” in PGAS Applications Workshop (PAW). IEEE, 2016, pp. 25–32
2016
-
[29]
Exploring dynamic load imbalance solutions with the comd proxy application,
O. Pearce, H. Ahmed, R. W. Larsen, P. Pirkelbauer, and D. F. Richards, “Exploring dynamic load imbalance solutions with the comd proxy application,” Future Generation Computer Systems , 2017
2017
-
[30]
An evaluation of threaded models for a classical md proxy application,
P. Cicotti, S. M. Mniszewski, and L. Carrington, “An evaluation of threaded models for a classical md proxy application,” in Workshop on Hardware-Software Co-Design for High Performance Computing . IEEE Press, 2014, pp. 41–48
2014
-
[31]
Improving Performance via Mini-applications,
M. A. Heroux, D. W. Doerfler, P. S. Crozier, J. M. Willenbring, H. C. Edwards, A. Williams, M. Rajan, E. R. Keiter, H. K. Thornquist, and R. W. Numrich, “Improving Performance via Mini-applications,” Sandia National Laboratories, Tech. Rep. SAND2009-5574, 2009
2009
-
[32]
ASC ATDM Level 2 milestone #5325: Asynchronous many-task runtime system analysis and assessment for next generation platforms,
J. Bennett, R. Clay, G. Baker, M. Gamell, D. Hollman, S. Knight, H. Kolla, G. Sjaardema, N. Slattengren, K. Teranishi, J. Wilke, M. Bettencourt, S. Bova, K. Franko, P. Lin, R. Grant, S. Hammond, S. Olivier, L. Kale, N. Jain, E. Mikida, A. Aiken, M. Bauer, W. Lee, E. Slaughter,...
2015
-
[33]
The parallel research kernels,
R. F. Van der Wijngaart and T. G. Mattson, “The parallel research kernels,” in HPEC, 2014, pp. 1–6
2014
-
[34]
Comparing runtime systems with exascale ambitions using the parallel research kernels,
R. F. Van der Wijngaart, A. Kayi, J. R. Hammond, G. Jost, T. S. John, S. Sridharan, T. G. Mattson, J. Abercrombie, and J. Nelson, “Comparing runtime systems with exascale ambitions using the parallel research kernels,” in International Conference on High Performance Computing ...
2016
-
[35]
The NAS parallel benchmarks summary and preliminary results,
D. H. Bailey, E. Barszcz, J. T. Barton, D. S. Browning, R. L. Carter, L. Dagum, R. A. Fatoohi, P. O. Frederickson, T. A. Lasinski, R. S. Schreiber, and H. D. Simon, “The NAS parallel benchmarks summary and preliminary results,” in Supercomputing (SC), 1991
1991
-
[36]
The NAS parallel benchmarks 2.0,
D. Bailey, T. Harris, W. Saphir, R. Van Der Wijngaart, A. Woo, and M. Yarrow, “The NAS parallel benchmarks 2.0,” Technical Report NAS- 95-020, NASA Ames Research Center, Tech. Rep., 1995
1995
-
[37]
The OpenMP implementation of NAS parallel benchmarks and its performance,
H.-Q. Jin, M. Frumkin, and J. Yan, “The OpenMP implementation of NAS parallel benchmarks and its performance,” 1999
1999
-
[38]
MPI versus MPI+OpenMP on IBM SP for the NAS benchmarks,
F. Cappello and D. Etiemble, “MPI versus MPI+OpenMP on IBM SP for the NAS benchmarks,” in Supercomputing (SC), 2000, p. 12
2000
-
[39]
Object-oriented implemen- tation of the NAS parallel benchmarks using Charm++,
S. Krishnan, M. Bhandarkar, and L. V . Kalé, “Object-oriented implemen- tation of the NAS parallel benchmarks using Charm++,” 1996
1996
-
[40]
Reproducible measurements of MPI performance characteristics,
W. Gropp and E. L. Lusk, “Reproducible measurements of MPI performance characteristics,” in Recent Advances in Parallel Virtual Machine and Message Passing Interface, 6th European PVM/MPI Users’ Group Meeting, 1999, pp. 11–18
1999
-
[41]
Precise MPI performance measurement using mpibench,
D. Grove, P. Coddington et al., “Precise MPI performance measurement using mpibench,” in Proceedings of HPC Asia . Citeseer, 2001, pp. 24–28
2001
-
[42]
The design and implementation of a domain-specific language for network performance testing,
S. Pakin, “The design and implementation of a domain-specific language for network performance testing,” IEEE Transactions on Parallel and Distributed Systems, vol. 18, no. 10, pp. 1436–1449, 2007
2007
Reviewed August 14, 2026 · model on record in the stance chip above.
Discussion (0). Continue with ORCID to comment.