REVIEW 3 major objections 5 minor 66 references
EZOA -- A catalogue of EBHIS HI detected galaxies in the northern Zone of Avoidance
T0 review · 3 major / 5 minor · reviewed 2026-08-14 · deepseek-v4-flash
Pith's one-line read A blind 21-cm survey of the northern galactic plane delivers 170 HI detections, 67 of them new, including two dwarf galaxies at the Local Volume edge.
desk verdict A useful new HI catalogue for the northern Zone of Avoidance with 67 genuinely new detections; the two '10.1 Mpc Local Volume dwarfs' rest on Hubble-flow distances without peculiar-velocity corrections, so that specific claim needs qualification. read the letter →
The pith
A machine-rendered reading of the paper's core claim, the machinery that carries it, and where it could break.
The reading
What carries the argument
The machinery is the blind 21-cm survey itself: a northern-sky single-dish survey at 23 mJy per beam sensitivity, 10.24 km per second velocity resolution, and a 10.8-arcminute beam, gridded into overlapping 12-degree cubes. Detections are found by visual inspection of raw and baseline-subtracted cubes, then parametrised by Gaussian position fits and line-profile analysis; reliability is established by cross-matching against earlier surveys, comparing parameters with published values, and testing completeness against a Euclidean flux-count slope. The derived distances and HI masses are the load-bearing products, computed as $D = v_{\rm LG}/H_0$ with $H_0 = 75\, {\rm km\, s^{-1}\, Mpc^{-1}}$ and a simple Local Group velocity correction.
What would settle it
Measure the tip-of-the-red-giant-branch distance to EZOA J0506+31 and EZOA J0301+56 with deep optical or near-infrared imaging; if either distance is not within the adopted Local Volume boundary of roughly 11 Mpc, then the claim of two new Local Volume dwarf galaxies at 10.1 Mpc is refuted.
Extended reading notes
Core claim
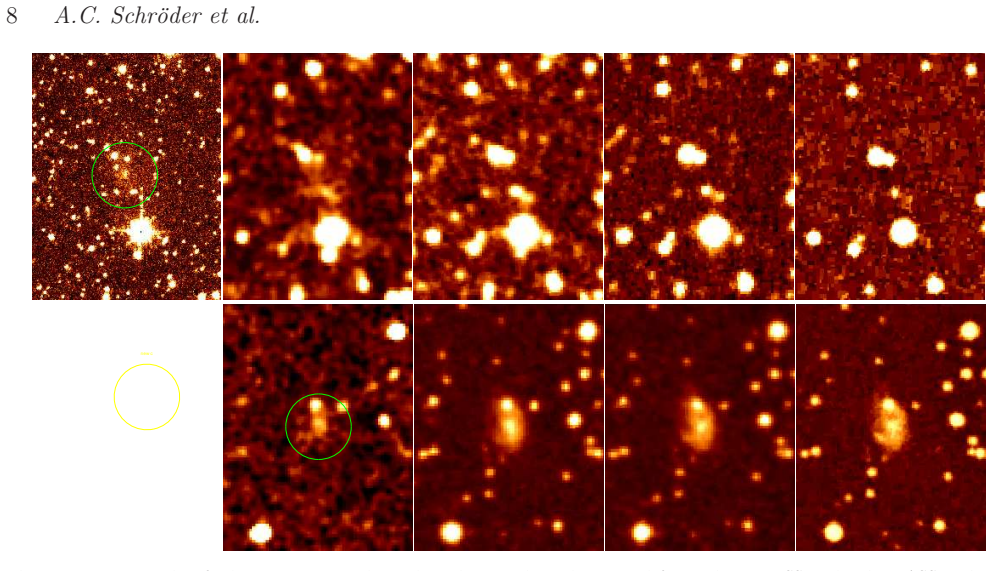
The central discovery is the catalogue itself and its statistical message. In a region that had been extensively observed with targeted pointed HI observations, a blind survey at a modest 23 mJy per beam sensitivity still turns up a 39 percent rate of galaxies never before recorded in HI. The 170 sources include 62 new redshift measurements; 48 detections have an optical or near-infrared counterpart that was never catalogued, and 29 have no counterpart at any wavelength. The authors single out two new dwarf galaxies, EZOA J0506+31 and EZOA J0301+56, at a derived distance of 10.1 Mpc, which places them just at the Local Volume boundary. They also report that the previously empty patch near Galactic longitude 70 degrees, slightly below the plane, is populated by ten new detections whose redshifts suggest a possible filament, and they conclude that the full northern-sky survey will add many more detections in the Zone of Avoidance.
Load-bearing premise
The claim that the two new dwarfs sit at 10.1 Mpc depends on the assumption that their observed velocities are almost entirely cosmic expansion; a peculiar velocity of a few hundred km per second would shift them by several Mpc, either outside or inside the Local Volume.
Editorial extensions
If this is right
- The catalogue raises the total number of galaxies known behind the northern Galactic plane and provides 62 new redshift measurements, strengthening the map of filaments that cross the Zone of Avoidance, including the Supergalactic Plane and the tail of the Perseus-Pisces structure.
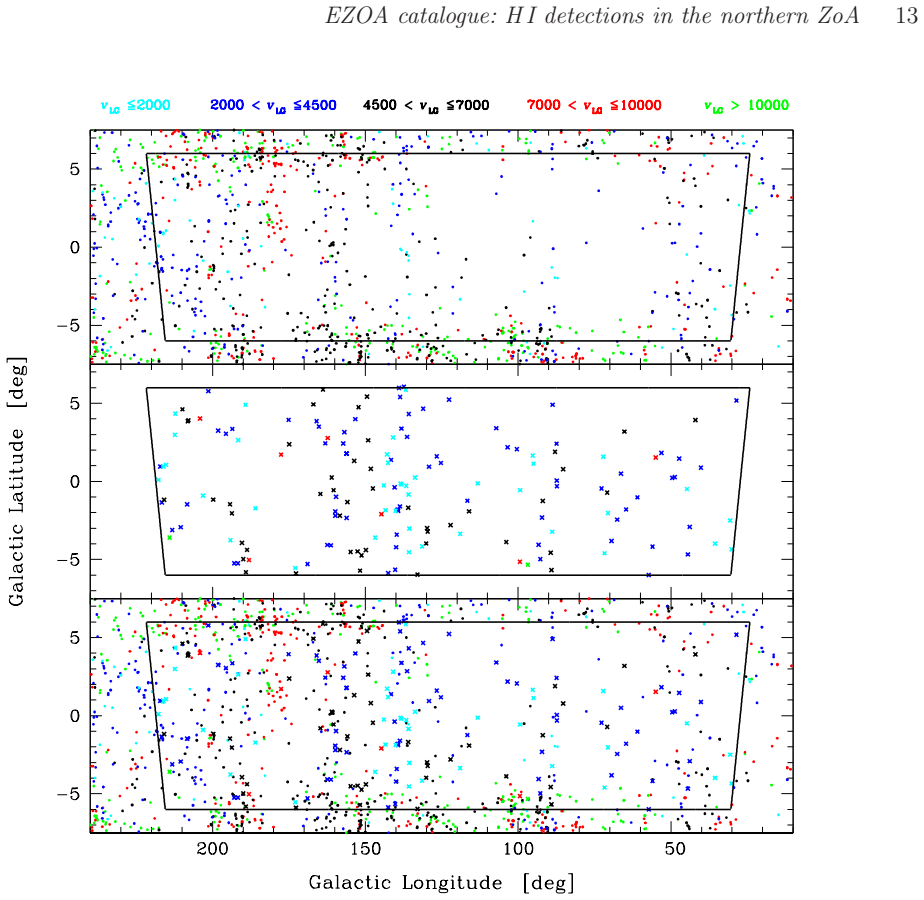
- The previously empty region near Galactic longitude 70 degrees, just below the plane, now contains ten HI detections; four of them at 3380 to 3460 km per second hint at a coherent new filament, though the authors note that deeper data are needed to confirm this.
- The line-width distribution of the blind sample is skewed toward narrow profiles compared with a near-infrared-selected pointed sample, implying that pointed optical and near-infrared surveys systematically miss low-surface-brightness dwarf galaxies behind the Galactic disk.
- The two new dwarf galaxies at 10.1 Mpc, if confirmed, enlarge the census of galaxies at the edge of the Local Volume and suggest that similar shallow blind surveys will find more Local Volume members.
- No hidden massive galaxy that could significantly influence the Local Group's motion was found within 11 Mpc, constraining the northern-sky contribution to the local velocity field.
Reading between the lines
- We infer that the 39 percent new-detection rate measures how incomplete prior targeted HI catalogues are in the northern Zone of Avoidance; extending the same shallow blind-survey approach to the full northern sky should yield a comparable fraction of new sources, not just in the plane but also at higher latitudes where extinction is lower.
- We infer that the narrow-line-width population found by the blind survey implies that the faint-end HI mass function of the Zone of Avoidance is currently underestimated by near-infrared and optical selected samples, so future HI mass function constraints should combine blind surveys with extinction-corrected selection to avoid a dwarf-galaxy bias.
- We infer that the apparent filament near Galactic longitude 70 degrees is testable now: a pointed HI follow-up with a more sensitive instrument over a few square degrees, or a deeper all-sky survey, would either establish the filament or show that the detections are unrelated line-of-sight coincidences.
- We infer that the distance-dependent claims, including the two 10.1 Mpc dwarfs and the absence of a massive hidden Local Group perturber, should be re-examined once standard-candle distances replace the Hubble-flow assumption; peculiar velocities of a few hundred km per second can move an object across the Local Volume boundary.
Signed reviews
Editorial analysis
A structured set of objections, weighed in public.
Referee Report
Summary. The paper presents EZOA, a catalogue of 170 HI detections extracted from the shallow EBHIS survey in the northern Zone of Avoidance (Dec >= -5 deg, |b| < 6 deg). For each detection the authors list HI parameters (velocity, line widths, flux, signal-to-noise), derived Hubble-flow distances and HI masses, and multiwavelength counterparts identified from NED, SIMBAD, and optical/NIR images. The catalogue includes 67 detections not previously recorded in HI, of which 29 have no counterpart at any other wavelength. The paper also discusses completeness and reliability, compares HI parameters with HIPASS, HIZOA, and NRT measurements, and interprets the spatial distribution of detections in terms of large-scale structure, including two new dwarf galaxies (EZOA J0506+31 and EZOA J0301+56) reported at a nominal distance of 10.1 Mpc.
Significance. If the catalogue is validated, it is a useful contribution to extragalactic large-scale structure studies in the northern Zone of Avoidance. The paper's explicit data-reduction recipe, the systematic comparisons of velocities, line widths, and fluxes with HIPASS, HIZOA, and NRT, the public catalogue with HI profiles, and the honest discussion of completeness and automated-finder limitations are all strengths. The claimed 39% new-detection fraction and the associated 'power of blind HI surveys' conclusion are of interest, as is the constraint on the local volume at |b| < 6 deg. The specific claim of two previously unknown dwarf galaxies at the edge of the Local Volume is a notable highlight, but it rests on Hubble-flow distances without peculiar-velocity corrections and should be treated with appropriate caution.
major comments (3)
- [Sec. 3, Table 2, Sec. 7.1.4] The distances for EZOA J0506+31 and EZOA J0301+56 are computed as D = vLG / H0 with H0 = 75 km/s/Mpc and only a solar-motion correction to the Local Group frame, with no peculiar-velocity correction and no quoted distance uncertainty. Because peculiar velocities of several hundred km/s are common near the Local Volume boundary, the abstract's statement that these are dwarf galaxies 'at the edge of the Local Volume, at 10.1 Mpc' is not secured by the presented data. Please add a caveat that these are Hubble-flow distances, quote their uncertainties, and either soften the claim or discuss how peculiar velocities could affect the inferred 10.1 Mpc distance.
- [Sec. 4, Sec. 5.2] The 'new HI detection' count (N = 67) is a headline result, but the manuscript does not explicitly describe how the ALFALFA alpha.40 catalogue (Haynes et al. 2018) was handled. ALFALFA covers a large part of the EZOA footprint (Dec 0 to +36 deg), so some EZOA sources within that declination range may already have HI detections in ALFALFA. Please state explicitly whether and how ALFALFA sources were identified in the NED/SIMBAD searches, and quantify the overlap between EZOA and ALFALFA; otherwise the reported new-detection fraction could be overestimated.
- [Sec. 7.1] The sentence 'No previously unidentified galaxy was found in this volume, proving that there is no hidden massive galaxy in the northern sky that would significantly influence the motion of the Local Group with respect to the microwave background' overstates the constraints provided by this survey. The survey is an HI-selected, shallow (23 mJy) survey of a narrow strip (|b| < 6 deg); it cannot prove the absence of massive HI-poor galaxies or of massive galaxies outside the strip. Please replace 'proving' with a statement of what the data actually show, for example that no new gas-rich massive galaxy was found within the surveyed volume and sensitivity limits.
minor comments (5)
- [Sec. 6] The lowest HI mass source is named EZOA J0630+08 in the first paragraph of Sec. 6 and EZOA J0629+08 in the later paragraph; please unify the nomenclature.
- [Sec. 5.2, Table 4] The text states that there are 39 detections in common with HIPASS (27 from HIPASS-S, 11 from HIPASS-N, and 1 from the bright galaxy catalogue), while Table 4 lists N = 37 for 'matches with HIPASS'; please clarify which subset Table 4 refers to.
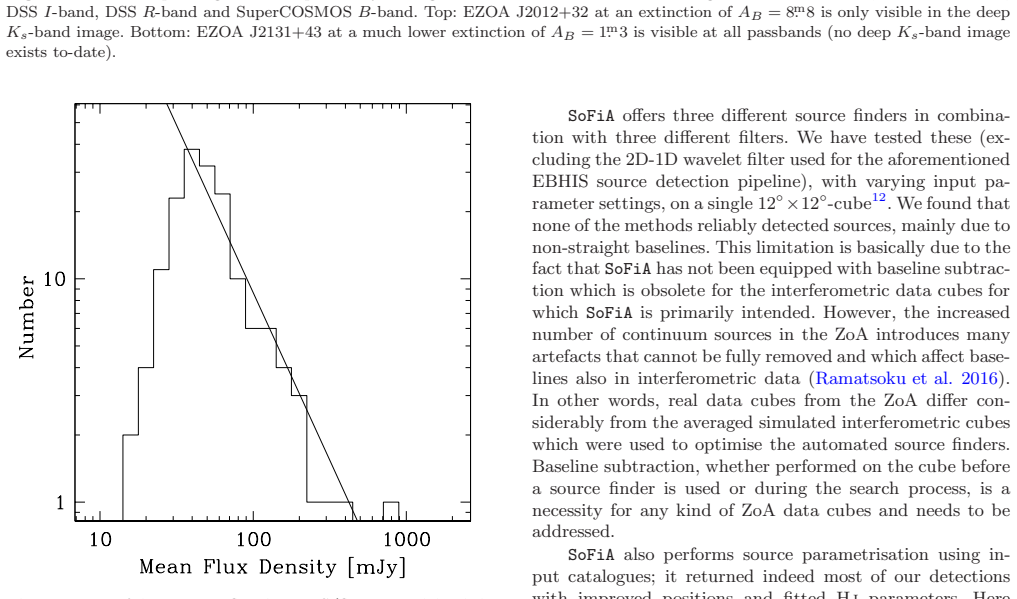
- [Sec. 5.1] The completeness limit of 40-50 mJy is estimated by eye from Fig. 3, as the text acknowledges; since this limit is used to characterise the survey, a more quantitative determination or an explicit uncertainty range would be more convincing.
- [Sec. 1] In the first paragraph, 'the event of multibeam receivers' should read 'the advent of multibeam receivers'.
- [Sec. 7.1.4] The phrase 'at the edge of the local volume' uses a lower-case 'local'; for consistency with the rest of the paper, it should be 'Local Volume'.
Circularity Check
Minor self-referential validation in Appendix A; the catalogue and derived distances are otherwise self-contained and not circular.
-
other
[Sec. 5.1.1 and Appendix A (preliminary EBHIS shallow source catalogue comparison)]
"During the fine-tuning of the pipeline used for the compilation of the EBHIS shallow source catalogue, a comparison with our visual search was used to improve the neural network algorithm that discriminates between good and unreliable candidates. ... This approach added eventually three low-SNR detections (<6) as well as one significant detection, EZOA J0637+03, which, however, lies on a strongly varying baseline and could only be confirmed through a cross-match with the HIZOA survey. No obvious source was missed which proves the thoroughness of visual searches."
The completeness validation in Sec. 5.1.1 uses the preliminary EBHIS shallow source catalogue to assert that 'no obvious source was missed'. Appendix A reveals that the automated catalogue's neural-network discriminator was improved during fine-tuning by comparing it with the very visual search being validated. Therefore the agreement between the automated catalogue and the visual search is partly by construction, not independent confirmation. This affects only the ancillary claim of search thoroughness; the central catalogue numbers (170 detections, 67 new HI detections) rest on the visual search itself and on independent cross-checks with HIPASS, HIZOA, and NRT, so the circularity is minor and not load-bearing.
full rationale
The paper is a catalogue paper, not a derivation paper. Its main output is measured HI line parameters, positions, and literature cross-matches; no prediction is extracted from a fitted model. Distances are explicitly computed as D = vLG / H0 with H0 = 75 km/s/Mpc (Sec. 3, column 11), which is a stated, standard kinematic assumption rather than a fitted input renamed as a prediction. The claim of 67 new HI detections is defined against previously published surveys catalogued in NED, SIMBAD, HIPASS, HIZOA, and similar external sources, so it is a literature comparison, not a self-referential constraint. Source parameters are additionally compared with independent telescopes (HIPASS, HIZOA, NRT), and the reported offsets are small and presented as validation. The 10.1 Mpc distances for the two newly found dwarfs may be affected by peculiar velocities, but that is a physical-assumption concern, not circularity. The only genuinely self-referential element is the use of the preliminary EBHIS automated source catalogue to demonstrate the completeness of the visual search, when that automated pipeline was itself tuned using the visual search (Appendix A). The paper states this limitation openly, and the circularity affects only an ancillary completeness claim, not the catalogue itself or the headline detection counts. Therefore the overall circularity score is 2.
Assumptions & free parameters
free parameters (2)
- Hubble constant H0 =
75 km/s/Mpc
- Median profile edge steepness (w20 - w50) =
24.5 km/s
assumptions (3)
- domain assumption Hubble-flow distances with H0 = 75 km/s/Mpc are valid for all detections, with negligible peculiar velocities.
- domain assumption Visual inspection of the two cube versions reliably separates real extragalactic HI signals from baseline, RFI, and continuum artifacts.
- domain assumption Absence from previous HI surveys and catalogues is sufficient to classify a detection as new.
Cite this review
Pith. "Pith review of EZOA -- A catalogue of EBHIS HI detected galaxies in the northern Zone of Avoidance." pith.science (2026). https://pith.science/paper/V2IYMQJO
@misc{pith2026190805910,
  author       = {Pith},
  title        = {Pith review of: EZOA -- A catalogue of EBHIS HI detected galaxies in the northern Zone of Avoidance},
  year         = {2026},
  howpublished = {\url{https://pith.science/paper/V2IYMQJO}},
  note         = {Machine review of arXiv:1908.05910}
}
read the original abstract
We present a catalogue of galaxies in the northern Zone of Avoidance (ZoA), extracted from the shallow version of the blind HI survey with the Effelsberg 100 m radio telescope, EBHIS, that has a sensitivity of 23 mJy/beam at 10.24 km/s velocity resolution. The catalogue comprises 170 detections in the region Dec >= -5 degrees and |b| < 6 degrees. About a third of the detections (N=67) have not been previously recorded in HI. While 29 detections have no discernible counterpart at any wavelength other than HI, 48 detections (28%) have a counterpart visible on optical or NIR images but are not recorded as such in the literature. New HI detections were found as close as 7.5 Mpc (EZOA J2120+45), and at the edge of the Local Volume, at 10.1 Mpc, we have found two previously unknown dwarf galaxies (EZOA J0506+31 and EZOA J0301+56). Existing large-scale structures crossing the northern ZoA have been established more firmly by the new detections, with the possibility of new filaments. We conclude that the high rate of 39% new HI\detections in the northern ZoA, which has been extensively surveyed with targeted observations in the past, proves the power of blind HI surveys. The full EBHIS survey, which will cover the full northern sky with a sensitivity comparable to the HIPASS survey of the southern sky, is expected to add many new detections and uncover new structures in the northern ZoA.
Figures

Figures from the paper (6 more)




Reference graph
Works this paper leans on
-
[1]
Begum A., Chengalur J. N., Karachentsev I. D., Sharina M. E., 2005, , 359, L53
work page 2005
-
[2]
Chamaraux P., Cayatte V., Balkowski C., Fontanelli P., 1990, A&A, 229, 340
work page 1990
-
[3]
Courtois H. M., Tully R. B., Fisher J. R., Bonhomme N., Zavodny M., Barnes A., 2009, , 138, 1938
work page 2009
-
[4]
Crook A. C., Huchra J. P., Martimbeau N., Masters K. L., Jarrett T., Macri L. M., 2007, , 655, 790
work page 2007
-
[5]
L., Staveley-Smith L., Kraan-Korteweg R
Donley J. L., Staveley-Smith L., Kraan-Korteweg R. C., Islas-Islas J. M., Schr \"o der A., et al. , 2005, AJ, 129, 220
work page 2005
-
[6]
Duffy A. R., Meyer M. J., Staveley-Smith L., Bernyk M., Croton D. J., Koribalski B. S., Gerstmann D., Westerlund S., 2012, , 426, 3385
work page 2012
-
[7]
Fl \"o er L., 2015, Automated source extraction for the next generation of neutral hydrogen surveys, PhD Thesis, . University of Bonn
work page 2015
-
[8]
Fl \"o er L., Winkel B., 2012, , 29, 244
work page 2012
Show all 66 references
-
[9]
Fl \"o er L., Winkel B., Kerp J., 2014, , 569, A101
2014
-
[10]
101, Astronomical Data Analysis Software and Systems V, Jacoby G
Gooch R., 1996, in Astronomical Society of the Pacific Conference Series, Vol. 101, Astronomical Data Analysis Software and Systems V, Jacoby G. H., Barnes J., eds., p. 80
1996
-
[11]
P., Giovanelli R., et al
Haynes M. P., Giovanelli R., et al. , 2018, , 861, 49
2018
-
[12]
W., 1988, in NASA RP-1190, Vol
Helou G., Walker D. W., 1988, in NASA RP-1190, Vol. 7 (1988), Vol. 7
1988
-
[13]
A., Kraan-Korteweg R
Henning P. A., Kraan-Korteweg R. C., Rivers A. J., Loan A. J., Lahav O., Burton W. B., 1998, AJ, 115, 584
1998
-
[14]
Henning P. A. et al. , 2008, in American Institute of Physics Conference Series, Vol. 1035, The Evolution of Galaxies Through the Neutral Hydrogen Window, Minchin R., Momjian E., eds., pp. 246--248
2008
-
[15]
Henning P. A. et al. , 2000, AJ, 119, 2686
2000
-
[16]
J., Heasley J
Hill G. J., Heasley J. N., Becklin E. E., Wynn-Williams C. G., 1988, , 95, 1031
1988
-
[17]
P., Macri L
Huchra J. P., Macri L. M., Masters K. L., Jarrett T. H., Berlind P., Calkins M., 2012, ApJS, 199, 26
2012
-
[18]
K., Karachentsev I
Huchtmeier W. K., Karachentsev I. D., Karachentseva V. E., 2003, , 401, 483
2003
-
[19]
H., Chester T., Cutri R., Schneider S., Skrutskie M., Huchra J
Jarrett T. H., Chester T., Cutri R., Schneider S., Skrutskie M., Huchra J. P., 2000, , 119, 2498
2000
-
[20]
Johnston S. et al. , 2008, Experimental Astronomy, 22, 151
2008
-
[21]
Juraszek S. J. et al. , 2000, AJ, 119, 1627
2000
-
[22]
Jurek R., 2012, , 29, 251
2012
-
[23]
Kalberla P. M. W., Mebold U., Reif K., 1982, , 106, 190
1982
-
[24]
D., 1980, , 44, 137
Karachentsev I. D., 1980, , 44, 137
1980
-
[25]
D., 2005, , 129, 178
Karachentsev I. D., 2005, , 129, 178
2005
-
[26]
Kerp J., Winkel B., Ben Bekhti N., Fl \"o er L., Kalberla P. M. W., 2011, Astronomische Nachrichten, 332, 637
2011
-
[27]
J., Lynden-Bell D., 1986, , 221, 1023
Kerr F. J., Lynden-Bell D., 1986, , 221, 1023
1986
-
[28]
S., 2012, PASA, 29, 359
Koribalski B. S., 2012, PASA, 29, 359
2012
-
[29]
Koribalski B. S. et al. , 2004, AJ, 128, 16
2004
-
[30]
C., van Driel W., Schr \"o der A
Kraan-Korteweg R. C., van Driel W., Schr \"o der A. C., Ramatsoku M., Henning P. A., 2018, , 481, 1262
2018
-
[31]
Kronberger M. et al. , 2006, , 447, 921
2006
-
[32]
Lang R. H. et al. , 2003, VizieR Online Data Catalog, 734, 20738
2003
-
[33]
291, Neutron Stars and Pulsars: Challenges and Opportunities after 80 years, van Leeuwen J., ed., pp
Li D., Nan R., Pan Z., 2013, in IAU Symposium, Vol. 291, Neutron Stars and Pulsars: Challenges and Opportunities after 80 years, van Leeuwen J., ed., pp. 325--330
2013
-
[34]
M., Bottinelli L., Dennefeld M., Fouque P., Gouguenheim L., Paturel G., 1990, A&A, 235, 41
Martin J. M., Bottinelli L., Dennefeld M., Fouque P., Gouguenheim L., Paturel G., 1990, A&A, 235, 41
1990
-
[35]
L., Crook A., Hong T., Jarrett T
Masters K. L., Crook A., Hong T., Jarrett T. H., Koribalski B. S., Macri L., Springob C. M., Staveley-Smith L., 2014, , 443, 1044
2014
-
[36]
P., Henning P
McIntyre T. P., Henning P. A., Minchin R. F., Momjian E., Butcher Z., 2015, , 150, 28
2015
-
[37]
Meyer M. J. et al. , 2004, MNRAS, 350, 1195
2004
-
[38]
Nan R. et al. , 2011, International Journal of Modern Physics D, 20, 989
2011
-
[39]
Oosterloo T., Verheijen M., van Cappellen W., 2010, in ISKAF2010 Science Meeting, p. 43
2010
-
[40]
Paturel G., Theureau G., Bottinelli L., Gouguenheim L., Coudreau-Durand N., Hallet N., Petit C., 2003, A&A, 412, 57
2003
-
[41]
Popping A., Jurek R., Westmeier T., Serra P., Fl \"o er L., Meyer M., Koribalski B., 2012, , 29, 318
2012
-
[42]
Ramatsoku M. et al. , 2016, , 460, 923
2016
-
[43]
Rebull L. M. et al. , 2011, , 196, 4
2011
-
[44]
F., Kraan-Korteweg R
Riad I. F., Kraan-Korteweg R. C., Woudt P. A., 2010, MNRAS, 401, 924
2010
-
[45]
J., Henning P
Rivers A. J., Henning P. A., Kraan-Korteweg R. C., 1999, , 16, 48
1999
-
[46]
L., Schneider S
Rosenberg J. L., Schneider S. E., 2000, ApJS, 130, 177
2000
-
[47]
J., Teuben P
Sault R. J., Teuben P. J., Wright M. C. H., 1995, in Astronomical Society of the Pacific Conference Series, Vol. 77, Astronomical Data Analysis Software and Systems IV, Shaw R. A., Payne H. E., Hayes J. J. E., eds., p. 433
1995
-
[48]
F., Finkbeiner D
Schlafly E. F., Finkbeiner D. P., 2011, , 737, 103
2011
-
[49]
J., Finkbeiner D
Schlegel D. J., Finkbeiner D. P., Davis M., 1998, ApJ, 500, 525
1998
-
[50]
C., van Driel W., Kraan-Korteweg R
Schr \"o der A. C., van Driel W., Kraan-Korteweg R. C., 2019, , 482, 5167
2019
-
[51]
K., Weinberger R., 1994, A&A, 286, 17
Seeberger R., Huchtmeier W. K., Weinberger R., 1994, A&A, 286, 17
1994
-
[52]
Seeberger R., Saurer W., 1998, A&As, 127, 101
1998
-
[53]
Serra P., Jurek R., Fl \"o er L., 2012, , 29, 296
2012
-
[54]
Serra P. et al. , 2015, , 448, 1922
2015
-
[55]
M., Haynes M
Springob C. M., Haynes M. P., Giovanelli R., Kent B. R., 2005, ApJS, 160, 149
2005
-
[56]
D., 1987, , 224, 953
Staveley-Smith L., Davies R. D., 1987, , 224, 953
1987
-
[57]
C., Schr \"o der A
Staveley-Smith L., Kraan-Korteweg R. C., Schr \"o der A. C., Henning P. A., Koribalski B. S., Stewart I. M., Heald G., 2016, , 151, 52
2016
-
[58]
A., Huchra J
Strauss M. A., Huchra J. P., Davis M., Yahil A., Fisher K. B., Tonry J., 1992, ApJS, 83, 29
1992
-
[59]
Takata T., Yamada T., Saito M., Chamaraux P., Kazes I., 1994, A&AS, 104, 529
1994
-
[60]
Theureau G., Bottinelli L., Coudreau-Durand N., Gouguenheim L., Hallet N., Loulergue M., Paturel G., Teerikorpi P., 1998, A&AS, 130, 333
1998
-
[61]
Tully R. B. et al. , 2013, , 146, 86
2013
-
[62]
B., et al
Tully R. B., et al. , 2008, ApJ, 676, 184
2008
-
[63]
T., 2012, , 421, 3242
Whiting M. T., 2012, , 421, 3242
2012
-
[64]
Winkel B., Kalberla P. M. W., Kerp J., Fl \"o er L., 2010, , 188, 488
2010
-
[65]
Winkel B., Kerp J., Fl \"o er L., Kalberla P. M. W., Ben Bekhti N., Keller R., Lenz D., 2016, , 585, A41
2016
-
[66]
Wong O. I. et al. , 2006, MNRAS, 371, 1855
2006
Reviewed August 14, 2026 · model on record in the stance chip above.
Discussion (0). Continue with ORCID to comment.