REVIEW 3 major objections 5 minor 15 references
Electron Impact Excitation of S III: an Assessment
T0 review · 3 major / 5 minor · reviewed 2026-08-14 · deepseek-v4-flash
Pith's one-line read The paper argues that the recently published effective collision strengths for S III are systematically underestimated by up to a factor of two, mainly because the close-coupling calculation included too few partial waves and an…
desk verdict A credible red flag against Tayal et al.'s S III collision strengths, but the case rests on an unvalidated FAC benchmark, so it lands as 'worth a serious look' rather than a settled correction. read the letter →
The pith
A machine-rendered reading of the paper's core claim, the machinery that carries it, and where it could break.
The reading
What carries the argument
The load-bearing comparison is between the distorted-wave calculation and the B-spline R-matrix dataset for strong electric-dipole transitions, where the collision strength behaves as $\Omega_{ij} \sim 4 \omega_i (f / \Delta E_{ij}) \ln E$; because both calculations produce comparable transition energies and oscillator strengths, the factor-of-two gap in the averaged quantity $\Upsilon$ is attributed to the R-matrix calculation's partial-wave cutoff $J \leq 23.5$ and to its top-up procedure, defined as the correction for neglected higher angular momenta. The paper argues that performing the top-up only above threshold leaves the threshold-region values unconverged, so the underestimate appears at all temperatures. A secondary mechanism is the energy mesh: a fine $0.0001$ Ryd mesh below thresholds and a coarse $0.2$ Ryd mesh above them, which the paper uses to explain the humps and overly steep rises in $\Upsilon$ for transitions involving high-lying levels.
What would settle it
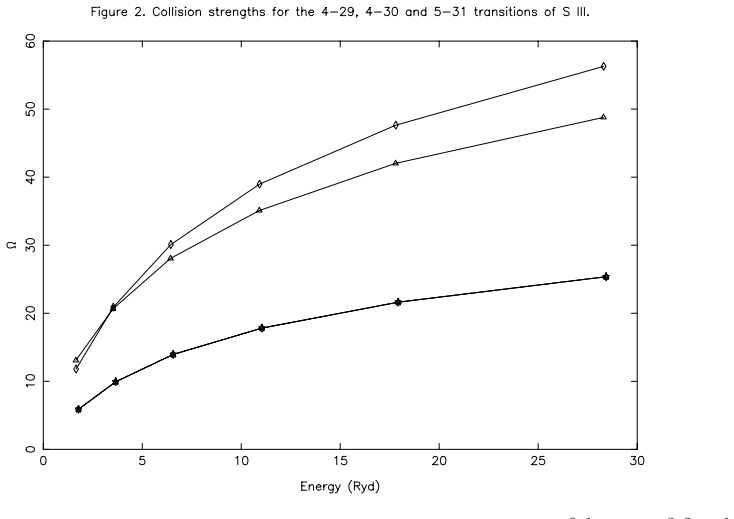
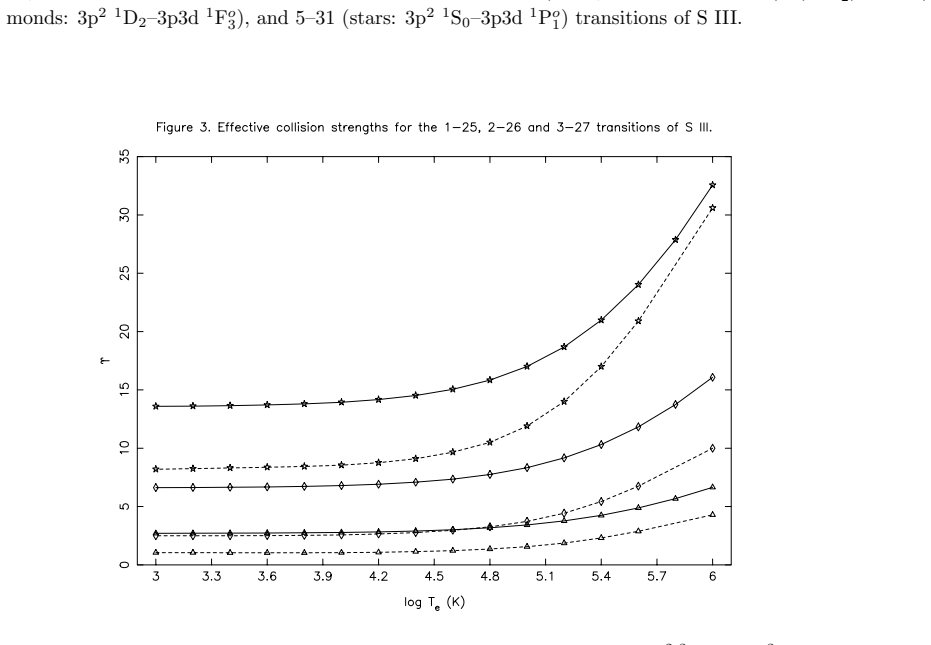
Recompute the same 198-level close-coupling model with the partial-wave expansion extended well beyond $J = 23.5$, a top-up applied consistently inside the threshold region, and a finer energy mesh above thresholds, then compare $\Upsilon$ for the six strongest transitions (1-25, 2-26, 3-27, 4-29, 4-30, and 5-31 in the paper's numbering) with both datasets. If the revised values stay near the published ones instead of rising toward the distorted-wave values, the paper's diagnosis is wrong; a direct experimental measurement of the excitation cross section for one strong line would also settle which calculation is closer.
Extended reading notes
Core claim
The paper's central claim is that the published effective collision strengths for S III are not accurate at the claimed level of about twenty percent: for a representative set of eighteen transitions, the published values fall below an independent calculation by up to a factor of two, at nearly all temperatures, and most clearly for the strong electric-dipole transitions, where resonances are not a complicating factor. Since the two calculations agree on the transition energies and oscillator strengths, the paper locates the discrepancy inside the collision calculation: a partial-wave expansion cut off at $J \leq 23.5$, with a top-up procedure applied only above threshold, leaves the background collision strength underestimated in the threshold region, and this propagates to all temperatures. For transitions involving the highest levels, the paper reports that the published $\Upsilon$ curves show humps and steep rises by factors of fifty or more, and attributes this to the coarse $0.2$ Ryd energy mesh used above thresholds rather than to resonances. The paper recommends fresh or improved calculations, and in the meantime advises users to compare both datasets because the level orderings of the two calculations are incompatible.
Load-bearing premise
The load-bearing premise is that the simpler, resonance-free calculation used for comparison is itself accurate to within about twenty percent for the strong allowed transitions; if that baseline is off by a comparable amount, the factor-of-two gap would not prove the published values are underestimated.
Editorial extensions
If this is right
- If the published effective collision strengths are low by up to a factor of two, modeled intensities of strong S III emission lines in H II regions, planetary atmospheres, and stellar plasmas would be correspondingly underpredicted.
- Temperature and density diagnostics built from S III line ratios involving the affected transitions could be biased, because the underestimate occurs at all temperatures rather than in one regime.
- The identified mechanism implies that future close-coupling calculations for S III must include a substantially larger partial-wave range and a top-up that is valid in the threshold region before their $\Upsilon$ values can be trusted.
- The reported humps and steep rises for high-level transitions imply that a $0.2$ Ryd energy mesh above thresholds is too coarse to produce reliable effective collision strengths for those levels.
- Because the two datasets disagree and cannot be trivially combined due to incompatible level orderings, users currently cannot simply average them; fresh or improved calculations are needed.
Reading between the lines
- This suggests a general cross-check: for any large R-matrix dataset that reports effective collision strengths but not the underlying collision strengths, a background distorted-wave calculation restricted to strong allowed transitions can flag possible partial-wave-convergence problems, because those transitions depend mainly on oscillator strength and transition energy.
- A sharper causal version of the paper's claim is testable by re-running the close-coupling calculation with more partial waves and a finer mesh; if the strong transitions fail to rise toward the independent values, the underestimate would have to come from the wavefunctions or the close-coupling expansion rather than from the partial-wave cutoff.
- For forbidden transitions the two datasets are not symmetric alternatives: the independent calculation omits resonances, so for those transitions the true effective collision strengths could be higher than both published values, and neither set alone would bracket the correct answer.
Signed reviews
Editorial analysis
A structured set of objections, weighed in public.
Referee Report
Summary. The paper assesses the S III atomic data reported by Tayal et al. (2019, ApJS 242, 9), who used MCHF for energy levels and A-values and B-spline R-matrix (BSR) for effective collision strengths. Using the Flexible Atomic Code (FAC), a distorted-wave code, the author performs an independent calculation with the same 18 configurations, compares transition energies and oscillator strengths, and then compares effective collision strengths for 18 representative transitions. The central claim is that Tayal et al.'s Upsilon values are underestimated by up to a factor of two at nearly all temperatures, especially for strong allowed transitions, and that the cause is an insufficient range of partial waves (J <= 23.5) together with an inadequate top-up procedure in the threshold region. The paper also claims that some higher-level transitions show incorrect temperature behavior due to a coarse energy mesh. It concludes by recommending either a fresh calculation or adoption of both datasets by users.
Significance. If the central claim holds, the published S III BSR dataset would be systematically too low for several astrophysically important allowed transitions, and the paper would strengthen the case for atomic-data producers to publish collision strengths, not only effective collision strengths. The paper also provides a useful independent FAC calculation and makes concrete comparisons for specific transitions, which is valuable for benchmarking. However, the assessment is only as strong as the accuracy of the FAC distorted-wave results; the author acknowledges that the FAC wavefunctions are simple and that resonances are omitted, and no independent validation of FAC for this ion is provided. Thus the paper is a credible cautionary assessment rather than a demonstrated correction of Tayal et al.'s data.
major comments (3)
- [Section 2, Figures 3 and 4; Section 3, final paragraph] The central conclusion that Tayal et al.'s Upsilon values are underestimated by up to a factor of two depends on using the FAC distorted-wave results as a benchmark that is accurate to about 20%. No validation of FAC against an independent close-coupling, Coulomb-Born, or experimental benchmark for S III is shown. The author's only numerical support is the assertion in the final paragraph of Section 3 that limitations in the FAC wavefunctions 'should not affect the subsequent values of Omega and Upsilon by more than 20%', but this statement is not demonstrated and is not enough to rule out a systematic factor-of-two offset in FAC itself. Without such validation, the observed gap does not prove that Tayal et al. are wrong.
- [Section 2, section on partial waves; Section 3, first paragraph] The diagnosis that J <= 23.5 is insufficient for convergence is inferred rather than demonstrated. Tayal et al. did not publish Omega values, so the comparison is made only at the level of Upsilon. Differences in Upsilon can arise from the ~10% differences in transition energies and oscillator strengths shown in Table 1, from different resonance treatments and thermal averaging, or from differences in the top-up implementation, in addition to partial-wave truncation. The claim that 'inclusion of insufficient number of partial waves is the reason' is load-bearing but remains a speculation. The author should either obtain Tayal et al.'s Omega data, or demonstrate the partial-wave convergence issue explicitly, e.g., by showing how FAC Omega for these transitions changes as the maximum J is increased.
- [Section 2, Figures 11 and 12; Section 3] The assertions about incorrect behavior of Upsilon for higher-level transitions are supported only by visual inspection and by analogy to previous work on other ions. The 'humps' in Tayal et al.'s Upsilon curves are attributed to a coarse energy mesh, but no sensitivity test of this mesh is performed here, and the alternative explanation of pseudo-resonances is not analyzed for these specific transitions. Similarly, the claim that a rise by more than a factor of 50 between 10^3 and 10^6 K is 'neither noted nor expected' lacks a quantitative justification; some optically allowed transitions with high excitation energies can legitimately show steep temperature dependence. This part of the assessment needs a concrete test or a more cautious formulation.
minor comments (5)
- [Abstract and keywords] The keyword 'electon impact excitation' contains a typo; it should read 'electron impact excitation'.
- [Section 2, after Figure 1] The formula used to compute Upsilon from the FAC Omega values is not given. Including the standard temperature-averaging expression would allow readers to reproduce the calculation and check the energy-grid treatment.
- [Table 1] The table format is hard to read because the notation 'a±b ≡ a×10±b' is not applied consistently across all entries, and some f-values appear without the exponent convention. A cleaner rendering would avoid ambiguity.
- [Section 2, text near Figures 3 and 4] The phrase 'at all temperatures' is used in the abstract and several places, but the author later notes that 'for a few the differences decrease towards the higher end of the temperature range'. The wording should be adjusted to reflect this qualification.
- [Section 3, final paragraph] The statement that 'the two sets of data can also not be (easily) combined because the level orderings are incompatible' is not explained. Since the paper already uses the same transition indices, it would be useful to state explicitly why combining is impractical.
Circularity Check
No significant circularity: the assessment is an independent FAC calculation compared against published BSR data, with no fitted inputs or definitional equivalences.
full rationale
The paper's central claim is that Tayal et al.'s effective collision strengths for S III are underestimated by up to a factor of two, based on new distorted-wave FAC calculations. Nothing in the derivation fits parameters to Tayal et al.'s published Υ values, and the comparison is not forced by construction: Table 1 independently compares MCHF and FAC energies and f-values, and the subsequent Υ comparisons in Figures 3-10 are new results, not transformed copies of the input data. The paper explicitly acknowledges gaps in its own method (simple wavefunctions, omission of resonances), but that is an accuracy concern, not circularity. It also cites prior papers by the same author to support the general reliability of FAC background collision strengths and the importance of partial-wave convergence; these are external comparisons for other ions (e.g., Mg V) and are not arguments whose conclusion is already embedded in the premise about S III. The absence of Ω data from Tayal et al. weakens the diagnosis but does not make the assessment circular. Overall, the derivation chain is self-contained in the sense required here: no quantity is fitted to the target result, no uniqueness theorem is imported, and no known result is merely renamed.
Assumptions & free parameters
assumptions (4)
- domain assumption FAC distorted-wave method gives reliable Omega values for strong allowed transitions, within about 20%.
- ad hoc to paper Tayal et al.'s inclusion of partial waves up to J <= 23.5 plus a top-up procedure is insufficient for convergence of Omega for allowed transitions.
- domain assumption A 0.2 Ryd energy mesh above thresholds causes pseudo-resonances and the humps in Figure 11.
- ad hoc to paper Differences of about 10% in transition energies and f-values between MCHF and FAC are small enough that Upsilon values should be comparable.
Cite this review
Pith. "Pith review of Electron Impact Excitation of S III: an Assessment." pith.science (2026). https://pith.science/paper/URUAMH2B
@misc{pith2026190805931,
  author       = {Pith},
  title        = {Pith review of: Electron Impact Excitation of S III: an Assessment},
  year         = {2026},
  howpublished = {\url{https://pith.science/paper/URUAMH2B}},
  note         = {Machine review of arXiv:1908.05931}
}
abstract
In a recent paper, Tayal et al. [{\em Astrophys. J. Suppl.} {\bf 2019}, {\emph 242}, 9] have reported results for energy levels, radiative rates (A-values) and effective collision strengths ($\Upsilon$) for transitions among the 198 levels of Si-like S~III. For the calculations they have adopted the multi-configuration Hartree-Fock (MCHF) code for the energy levels and A-values, and B-spline $R$-matrix (BSR) code for $\Upsilon$. Their reported results appear to be accurate for energy levels and A-values, but not for $\Upsilon$. Through our independent calculations by adopting the flexible atomic code (FAC), we demonstrate that their reported results for $\Upsilon$ are underestimated, by up to a factor of two, and at all temperatures, particularly for the allowed transitions, but some forbidden ones too. Additionally, for transitions involving the higher levels the behaviour of their $\Upsilon$ results is not correct.
Figures

Figures from the paper (9 more)




Reference graph
Works this paper leans on
-
[1]
S., Zatsarinny, O., & Sossah, A
Tayal, S. S., Zatsarinny, O., & Sossah, A. M. 2019, ApJS, 242, 9
work page 2019
-
[2]
Galav´ ıs, M. E., Mendoza, C., & Zeippen, C. J. 1995, A&AS, 111, 347
work page 1995
- [3]
-
[4]
Hudson, C. E., Ramsbottom, C. A., & Scott, M. P. 2012, ApJ, 750, 65
work page 2012
-
[5]
Grieve, M. F. R., Ramsbottom, C. A., Hudson, C. E., & Keenan, F. P. 2014, ApJ, 780, 110
work page 2014
- [6]
-
[7]
Aggarwal, K. M. 2017, Atoms, 5, 5040037
work page 2017
-
[8]
Gu, M. F. 2008, Can. J. Phys., 86, 675
2008
Show all 15 references
-
[9]
M., & Keenan, F
Aggarwal, K. M., & Keenan, F. P. 2017, Can. J. Phys, 95, 9
2017
-
[10]
M., Keenan, F
Aggarwal, K. M., Keenan, F. P., & Msezane, A. Z. 2001, J. Phys., B 34, L757
2001
-
[11]
M., & Keenan, F
Aggarwal, K. M., & Keenan, F. P. 2003, A&A, 399, 799
2003
-
[12]
M., & Keenan, F
Aggarwal, K. M., & Keenan, F. P. 2008, Eur. Phys. J., 46, 205 13
2008
-
[13]
M., & Keenan, F
Aggarwal, K. M., & Keenan, F. P. 2004, A&A, 418, 371
2004
-
[14]
2017, Phys
Wang, K., Fern´ andez-Menchero, L., Zatsarinny, O., & Bartschat, K. 2017, Phys. Rev., A 95, 042709
2017
-
[15]
Aggarwal, K. M. J. Phys. B, 1991, 16, 2405 14
1991
Reviewed August 14, 2026 · model on record in the stance chip above.
Discussion (0). Continue with ORCID to comment.