REVIEW 3 major objections 5 minor 37 references
Statistical analysis on X-ray flares from the nucleus and HST-1 knot in the M87 jet
T0 review · 3 major / 5 minor · reviewed 2026-08-14 · deepseek-v4-flash
Pith's one-line read Same power laws govern M87's core and jet knot X-ray flares.
desk verdict Useful first comparison of CORE vs HST-1 flare statistics, but censored durations undermine the strong SOC dimension claim. read the letter →
The pith
A machine-rendered reading of the paper's core claim, the machinery that carries it, and where it could break.
The reading
What carries the argument
The load-bearing object is the fractal-diffusive self-organized criticality (SOC) model of flare avalanches. In this picture, magnetic reconnection events release energy over a fractal set of effective spatial dimension $S$, and the model predicts power-law distributions of event size and duration with indices $\alpha_F = 1+(S-1)/D_S$ and $\alpha_T = 1+\beta(S-1)/S$, where $D_S$ is the fractal Hausdorff dimension and $\beta$ a diffusion parameter. The paper fits these power laws to the observed $I_P$ and $T_{\rm fl}$ distributions and compares the fitted indices between CORE and HST-1; matching indices are then inverted into a claim that the two regions dissipate energy in the same dimension. Flare identification uses a doubling-or-halving intensity criterion, and durations are defined as $T_{\rm fl}={\rm EndTime}-{\rm StartTime}$.
What would settle it
Recompute the $T_{\rm fl}$ distribution using only flares whose rising and declining parts are both observed, or apply a survival-analysis estimator that treats the truncated durations as lower limits; if the CORE and HST-1 duration indices then diverge from each other or from the peak-intensity index, the claim of identical dissipation dimensions in the two regions would fail.
Extended reading notes
Core claim
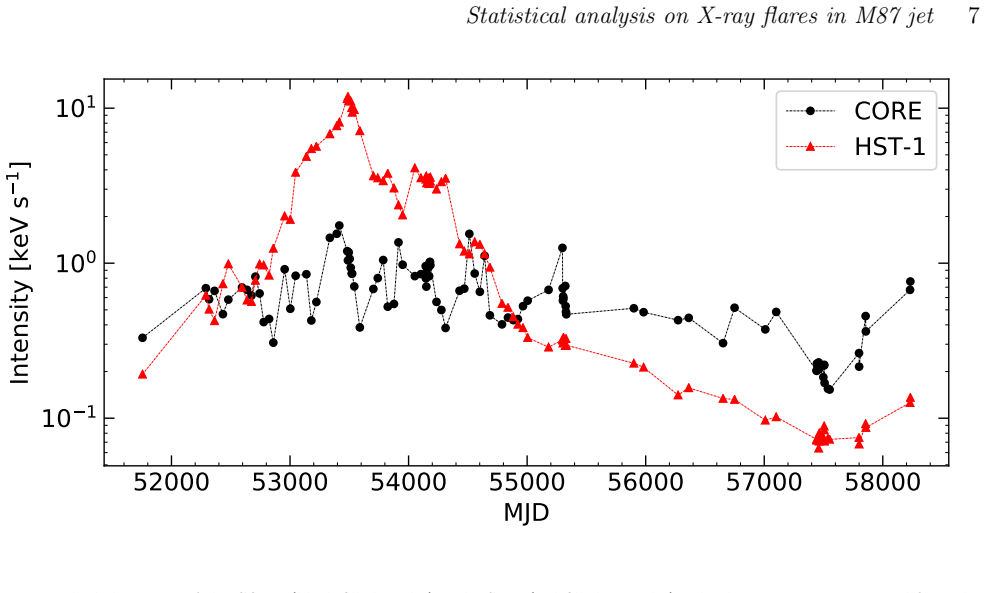
On the paper's own terms, the central discovery is that X-ray flare statistics from two distinct sites in the M87 jet -- the nucleus (CORE) and the HST-1 knot -- obey power-law distributions whose indices are consistent: for CORE, $\alpha_{I_P}=0.69^{+0.59}_{-0.45}$ and $\alpha_{T_{\rm fl}}=0.73^{+0.39}_{-0.37}$; for HST-1, $\alpha_{I_P}=0.92\pm 0.32$ and $\alpha_{T_{\rm fl}}=1.19^{+0.64}_{-0.60}$. The authors take this consistency as evidence that both sites are self-organized critical systems whose flares are triggered by magnetic reconnection, with the same spatial dimension of energy dissipation. They also find a strong correlation between the CORE and HST-1 light curves, which they read as further support for a common physical origin. The power-law interpretation is preferred over a log-normal one by the Akaike information criterion, although the paper notes the CORE $I_P$ fit is not as good and that the indices carry large uncertainties from the small flare sample.
Load-bearing premise
The analysis assumes that measured flare durations, most of which end at the edge of an observing window, still represent the true duration population; if truncated flares are artificially short, the fitted duration indices are biased.
Editorial extensions
If this is right
- If the indices are truly equal, magnetic reconnection dissipates energy in the same effective spatial dimension in the M87 nucleus and in HST-1.
- The power-law form over a log-normal form favors an avalanche-like SOC origin over stochastic multiplicative processes for these flares.
- The strong CORE-HST-1 light-curve correlation implies the two regions are not independent emitters; a common trigger or propagating disturbance is at work.
- The SOC interpretation connects extragalactic jet flare statistics to the same statistical framework used for solar flares, making the two phenomena quantitatively comparable.
Reading between the lines
- Because most of the identified flares are truncated by the observing window, re-fitting the duration distribution with survival-analysis methods that treat truncated durations as lower limits could either confirm or overturn the claimed $T_{\rm fl}$ indices.
- The same analysis applied to other AGN jets with resolvable cores and knots would test whether identical dissipation dimensions are a general property of jets or special to M87.
- A lag analysis of the CORE and HST-1 light curves, rather than a zero-lag correlation, could distinguish a common engine-driven trigger from a disturbance that travels down the jet.
Signed reviews
Editorial analysis
A structured set of objections, weighed in public.
Referee Report
Summary. This paper uses archival Chandra/ACIS observations of M87 to extract light curves of the nucleus (CORE) and the HST-1 knot, identifies 14 and 9 X-ray flares by a peak-to-adjacent-minima amplitude criterion of >1.95, and measures each flare's peak intensity I_P and flaring duration T_fl = EndTime - StartTime (Table 2). Maximum-likelihood fits of power-law and log-normal models are compared with AIC, and parametric bootstrap goodness-of-fit tests are applied (Section 3.1). The authors report power-law indices alpha_T(CORE)=0.73, alpha_I(CORE)=0.69, alpha_T(HST-1)=1.19, and alpha_I(HST-1)=0.92, conclude that the indices do not differ significantly between the two regions, and interpret the power-law statistics and a >3-sigma DCF correlation as evidence for a self-organized criticality system driven by magnetic reconnection with identical energy-dissipation dimension in both regions.
Significance. The question is timely and the paper is methodologically more careful than many similar analyses: it uses a uniform flare-selection rule, handles pile-up with the Harris keV/s method, checks source contamination with MARX PSF simulations, and reports bootstrap goodness-of-fit rather than only plotting fits. If the claimed power-law indices were robust, the result would be a useful addition to the growing evidence that jet X-ray variability can be described by SOC-type statistics, and the CORE/HST-1 consistency would be a nontrivial constraint on energy-dissipation models. However, the strength of the conclusion is currently limited by two internal problems: the T_fl measurements are censored for most events, and the bootstrap rejects the power-law model for the CORE I_P distribution at the 5% level. The physical conclusion is also based on consistency within very large uncertainties rather than on a formal equality test.
major comments (3)
- [§3.1, Table 2] The duration T_fl = EndTime - StartTime is treated as a complete flare duration for all 14 CORE and 9 HST-1 flares, but Table 2 classifies 11 of 14 CORE flares and 9 of 9 HST-1 flares as 'r' or 'd', meaning only one side of the flare passed the >1.95 amplitude criterion. For these events the bracketing minimum may be an upper flank minimum rather than the return to the pre-flare level, so the quoted T_fl is a lower limit on the true duration (or is otherwise censored). The MLE procedure of Section 3.1, the AIC comparison, and the bootstrap in Fig. 5 all treat these truncated durations as complete data. Because the censoring fraction is larger in HST-1 than in CORE, the comparison alpha_T(CORE)=0.73^{+0.39}_{-0.37} versus alpha_T(HST-1)=1.19^{+0.64}_{-0.60} is not robust to the unknown censoring. The authors should model the censoring explicitly (e.g., survival analysis), restrict the T_fl analysis to 'm' flares, or provide a sensitivity analysis demonstrating that the indices and the cross-region consistency are unchanged under plausible censoring assumptions.
- [§3.1, Fig. 5 and Table 3] The bootstrap goodness-of-fit shows that only 2.5% of simulated -2lnL values exceed the observed C for the CORE/I_P power-law fit (97.5% of the bootstrap distribution lies below C_b = 6.90). By the paper's own criterion that a fraction below 95% indicates a good fit, the power-law model is rejected for the CORE/I_P distribution at the 5% level. Yet the Abstract states unconditionally that both I_P and T_fl in the nucleus obey power-law forms, and the consistency argument in Section 4 uses the CORE/I_P index. The later sentence in Section 4 acknowledging that this fit is 'not very well' should be reflected in the Abstract and in the weight given to the CORE/I_P index in the CORE-HST-1 comparison.
- [§4, Table 3] The conclusion that the indices for CORE and HST-1 are consistent is based on overlapping 1-sigma uncertainties for the four fitted power-law indices. With 14 and 9 events, these intervals are so broad that non-overlap would be a very stringent condition, and overlap is not a formal test of equality. A quantitative comparison (e.g., a likelihood-ratio test of a model with a common index versus separate indices, or a bootstrap distribution of the index differences) is needed before the claim that the two regions have 'identical' energy-dissipation dimension can be supported. At minimum, the wording should be softened from 'indicate identical dimensions' to 'are consistent with identical dimensions within the current uncertainties.'
minor comments (5)
- [Section 1, last paragraph] The sentence 'The a discussion and conclusions are provided in Sect. 4' contains a stray article and should be corrected to 'The discussion and conclusions are provided in Sect. 4.'
- [§3.1, Eq. (1)] The normalization A is written in a way that is easy to misread ('A = 1− alpha x^{1−alpha}_max − x^{1−alpha}_min'); it should be typeset as (1−alpha)/(x_max^{1−alpha} − x_min^{1−alpha}), and the special case alpha = 1 should be stated consistently with the chosen parameterization.
- [Abstract] In the final sentence, 'the dimensions of the energy dissipation ... is identical' should agree in number ('the dimensions ... are identical'), and 'consistent indices' is an overstatement given the large uncertainties; see the major comment above.
- [Section 4] There are small typographical issues in the sentence 'Each index is consistent with that in the CORE within the errors,.' (extra comma) and in the phrase 'within the errors,' which should read 'within the errors.'
- [Table 3 caption] The caption calls column (4) 'minimum -2 ln L', but the text says AIC is used for model comparison; showing AIC values or the number of model parameters k would make the model-selection step more transparent.
Circularity Check
No significant circularity: the power-law indices are fitted from the data and then compared directly, and the SOC interpretation is an external a posteriori model rather than an input to the fits.
full rationale
The paper's derivation chain consists of identifying flares from Chandra light curves, measuring peak intensities and durations, fitting power-law and log-normal models by maximum likelihood, comparing AIC values, and then comparing the fitted power-law indices between CORE and HST-1. None of these steps defines the conclusion into the inputs: the power-law index α is estimated from the data, not imposed by the model, and the claim of consistency between CORE and HST-1 is a direct comparison of independently fitted parameters with quoted uncertainties. The SOC interpretation is invoked after the fits as a possible physical explanation, and the relations α_F = 1+(S−1)/D_S and α_T = 1+β(S−1)/S are used only heuristically, not to invert the measured indices into a unique dimension. Self-citations such as Wang et al. (2015) and Yan et al. (2018) are used as related prior work and as motivation for trying the SOC model; they are not load-bearing in the sense of being the only justification for the central claim. The manuscript itself notes the large uncertainties due to the small number of flares and calls for more data, which is a limitation but not an admission of circularity. Potential statistical concerns, such as censored durations for flares identified by only one side, affect the reliability of the fitted indices but do not make the derivation circular. No equation is shown to be equivalent to another by construction, and no fitted parameter is renamed as a prediction. Therefore, no specific circular step can be exhibited, and the appropriate finding is no significant circularity.
Assumptions & free parameters
free parameters (5)
- Power-law index for CORE T_fl =
0.73+0.39-0.37
- Power-law index for CORE I_P =
0.69+0.59-0.45
- Power-law index for HST-1 T_fl =
1.19+0.64-0.60
- Power-law index for HST-1 I_P =
0.92±0.32
- Flare identification intensity-ratio threshold =
1.95
assumptions (3)
- domain assumption The SOC model: flare parameters such as peak flux and duration follow power-law distributions, and the indices relate to the spatial dimension of the energy dissipation (Aschwanden 2012).
- domain assumption The 'keV s^-1' pile-up correction method recovers the true intrinsic intensity of the piled sources (Harris et al. 2006).
- domain assumption There is no significant contamination between the CORE and HST-1 extraction regions.
Cite this review
Pith. "Pith review of Statistical analysis on X-ray flares from the nucleus and HST-1 knot in the M87 jet." pith.science (2026). https://pith.science/paper/CASYJT2I
@misc{pith2026190806048,
  author       = {Pith},
  title        = {Pith review of: Statistical analysis on X-ray flares from the nucleus and HST-1 knot in the M87 jet},
  year         = {2026},
  howpublished = {\url{https://pith.science/paper/CASYJT2I}},
  note         = {Machine review of arXiv:1908.06048}
}
abstract
The statistical properties of X-ray flares from two separate locations (nucleus and HST-1) in the M87 jet are investigated to reveal the physical origin of the flares. We analyse the archival \textit{Chandra} data for M87, and identify 14 flares in the nucleus and 9 flares in HST-1. The peak intensity ($I_{\rm{P}}$) and the flaring duration time ($T_{\rm{fl}}$) for each flare are obtained. It is found that the distributions of both $I_{\rm{P}}$ and $T_{\rm{fl}}$ for the nucleus obey a power-law form with a similar index. A similar result is also obtained for HST-1, and no significant inconsistency between the nucleus and HST-1 is found for the indices. Similar to solar X-ray flares, the power-law distributions of the flare event parameters can be well explained by a self-organized criticality (SOC) system, which are triggered by magnetic reconnection. Our results suggest that the flares from nucleus and HST-1 are possibly triggered by magnetic reconnection process. The consistent indices for the distributions of $I_{\rm{P}}$ and $T_{\rm{fl}}$ in the CORE and HST-1 indicate that the dimensions of the energy dissipation of the magnetic reconnection is identical in the two regions. A strong correlation between the flares in the two regions also suggests a similar physical origin for the flares.
Figures


Figures from the paper (3 more)


Reference graph
Works this paper leans on
-
[1]
Aschwanden M. J., 2011, @doi [ ] 10.1007/s11207-011-9755-0 , http://adsabs.harvard.edu/abs/2011SoPh..274...99A 274, 99
-
[2]
J., 2012, @doi [ ] 10.1051/0004-6361/201118237 , http://adsabs.harvard.edu/abs/2012A
Aschwanden M. J., 2012, @doi [ ] 10.1051/0004-6361/201118237 , http://adsabs.harvard.edu/abs/2012A
-
[3]
C., 1998, @doi [ ] 10.1086/305119 , http://adsabs.harvard.edu/abs/1998ApJ...493..291B 493, 291
Begelman M. C., 1998, @doi [ ] 10.1086/305119 , http://adsabs.harvard.edu/abs/1998ApJ...493..291B 493, 291
doi:10.1086/305119 1998
-
[4]
Bicknell G. V., Begelman M. C., 1996, @doi [ ] 10.1086/177636 , http://adsabs.harvard.edu/abs/1996ApJ...467..597B 467, 597
doi:10.1086/177636 1996
-
[5]
Biretta J. A., Zhou F., Owen F. N., 1995, @doi [ ] 10.1086/175901 , http://adsabs.harvard.edu/abs/1995ApJ...447..582B 447, 582
doi:10.1086/175901 1995
-
[6]
Biretta J. A., Sparks W. B., Macchetto F., 1999, @doi [ ] 10.1086/307499 , http://adsabs.harvard.edu/abs/1999ApJ...520..621B 520, 621
doi:10.1086/307499 1999
-
[7]
E., 2001, @doi [ ] 10.1086/323488 , http://adsabs.harvard.edu/abs/2001ApJ...562..575D 562, 575
Davis J. E., 2001, @doi [ ] 10.1086/323488 , http://adsabs.harvard.edu/abs/2001ApJ...562..575D 562, 575
doi:10.1086/323488 2001
-
[8]
Edelson R. A., Krolik J. H., 1988, @doi [ ] 10.1086/166773 , http://adsabs.harvard.edu/abs/1988ApJ...333..646E 333, 646
doi:10.1086/166773 1988
Show all 37 references
-
[9]
M., Papadakis I
Emmanoulopoulos D., McHardy I. M., Papadakis I. E., 2013, @doi [ ] 10.1093/mnras/stt764 , http://adsabs.harvard.edu/abs/2013MNRAS.433..907E 433, 907
2013 doi
-
[10]
Gebhardt K., Thomas J., 2009, @doi [ ] 10.1088/0004-637X/700/2/1690 , http://adsabs.harvard.edu/abs/2009ApJ...700.1690G 700, 1690
2009 doi
-
[11]
E., Biretta J
Harris D. E., Biretta J. A., Junor W., Perlman E. S., Sparks W. B., Wilson A. S., 2003, @doi [ ] 10.1086/374773 , http://adsabs.harvard.edu/abs/2003ApJ...586L..41H 586, L41
2003 doi
-
[12]
E., Cheung C
Harris D. E., Cheung C. C., Biretta J. A., Sparks W. B., Junor W., Perlman E. S., Wilson A. S., 2006, @doi [ ] 10.1086/500081 , http://adsabs.harvard.edu/abs/2006ApJ...640..211H 640, 211
2006 doi
-
[13]
E., Cheung C
Harris D. E., Cheung C. C., Stawarz ., Biretta J. A., Perlman E. S., 2009, @doi [ ] 10.1088/0004-637X/699/1/305 , http://adsabs.harvard.edu/abs/2009ApJ...699..305H 699, 305
2009 doi
-
[14]
E., et al., 2011, @doi [ ] 10.1088/0004-637X/743/2/177 , http://adsabs.harvard.edu/abs/2011ApJ...743..177H 743, 177
Harris D. E., et al., 2011, @doi [ ] 10.1088/0004-637X/743/2/177 , http://adsabs.harvard.edu/abs/2011ApJ...743..177H 743, 177
2011 doi
-
[15]
C., Becker A
Kelly B. C., Becker A. C., Sobolewska M., Siemiginowska A., Uttley P., 2014, @doi [ ] 10.1088/0004-637X/788/1/33 , http://adsabs.harvard.edu/abs/2014ApJ...788...33K 788, 33
2014 doi
-
[16]
Li Y.-P., et al., 2015, @doi [ ] 10.1088/0004-637X/810/1/19 , http://adsabs.harvard.edu/abs/2015ApJ...810...19L 810, 19
2015 doi
-
[17]
T., Hamilton R
Lu E. T., Hamilton R. J., 1991, @doi [ ] 10.1086/186180 , http://adsabs.harvard.edu/abs/1991ApJ...380L..89L 380, L89
1991 doi
-
[18]
E., 1999, @doi [ ] 10.1046/j.1365-8711.1999.02763.x , http://adsabs.harvard.edu/abs/1999MNRAS.308.1006L 308, 1006
Lyubarskii Y. E., 1999, @doi [ ] 10.1046/j.1365-8711.1999.02763.x , http://adsabs.harvard.edu/abs/1999MNRAS.308.1006L 308, 1006
1999
-
[19]
E., 1992, Soviet Astronomy Letters, http://adsabs.harvard.edu/abs/1992SvAL...18..356L 18, 356
Lyubarskij Y. E., 1992, Soviet Astronomy Letters, http://adsabs.harvard.edu/abs/1992SvAL...18..356L 18, 356
1992
-
[20]
J., Capetti A., Sparks W., Crane P., 1997, @doi [ ] 10.1086/304823 , http://adsabs.harvard.edu/abs/1997ApJ...489..579M 489, 579
Macchetto F., Marconi A., Axon D. J., Capetti A., Sparks W., Crane P., 1997, @doi [ ] 10.1086/304823 , http://adsabs.harvard.edu/abs/1997ApJ...489..579M 489, 579
1997 doi
-
[21]
L., Miller B
Marshall H. L., Miller B. P., Davis D. S., Perlman E. S., Wise M., Canizares C. R., Harris D. E., 2002, @doi [ ] 10.1086/324396 , http://adsabs.harvard.edu/abs/2002ApJ...564..683M 564, 683
2002 doi
-
[22]
S., Harris D
Perlman E. S., Harris D. E., Biretta J. A., Sparks W. B., Macchetto F. D., 2003, @doi [ ] 10.1086/381191 , http://adsabs.harvard.edu/abs/2003ApJ...599L..65P 599, L65
2003 doi
-
[23]
B., Mizuno Y., de Gouveia Dal Pino E
Singh C. B., Mizuno Y., de Gouveia Dal Pino E. M., 2016, @doi [ ] 10.3847/0004-637X/824/1/48 , http://adsabs.harvard.edu/abs/2016ApJ...824...48S 824, 48
2016 doi
-
[24]
Sironi L., Petropoulou M., Giannios D., 2015, @doi [ ] 10.1093/mnras/stv641 , http://adsabs.harvard.edu/abs/2015MNRAS.450..183S 450, 183
2015 doi
-
[25]
M., Liu R.-Y., Aharonian F., 2018, @doi [ ] 10.1051/0004-6361/201731716 , http://adsabs.harvard.edu/abs/2018A
Sun X.-N., Yang R.-Z., Rieger F. M., Liu R.-Y., Aharonian F., 2018, @doi [ ] 10.1051/0004-6361/201731716 , http://adsabs.harvard.edu/abs/2018A
2018 doi
-
[26]
Timmer J., Koenig M., 1995, , http://adsabs.harvard.edu/abs/1995A
1995
-
[27]
Y., Dai Z
Wang F. Y., Dai Z. G., 2013, @doi [Nature Physics] 10.1038/nphys2670 , http://adsabs.harvard.edu/abs/2013NatPh...9..465W 9, 465
2013 doi
-
[28]
Y., Dai Z
Wang F. Y., Dai Z. G., Yi S. X., Xi S. Q., 2015, @doi [ ] 10.1088/0067-0049/216/1/8 , http://adsabs.harvard.edu/abs/2015ApJS..216....8W 216, 8
2015 doi
-
[29]
C., Tananbaum H
Weisskopf M. C., Tananbaum H. D., Van Speybroeck L. P., O'Dell S. L., 2000, in Truemper J. E., Aschenbach B., eds, Vol. 4012, X-Ray Optics, Instruments, and Missions III. pp 2--16 ( @eprint astro-ph/0004127 ), @doi 10.1117/12.391545
2000 arXiv
-
[30]
S., Yang Y., 2002, @doi [ ] 10.1086/338887 , http://adsabs.harvard.edu/abs/2002ApJ...568..133W 568, 133
Wilson A. S., Yang Y., 2002, @doi [ ] 10.1086/338887 , http://adsabs.harvard.edu/abs/2002ApJ...568..133W 568, 133
2002 doi
-
[31]
Yan D., Zhang L., Yuan Q., Fan Z., Zeng H., 2013, @doi [ ] 10.1088/0004-637X/765/2/122 , http://adsabs.harvard.edu/abs/2013ApJ...765..122Y 765, 122
2013 doi
-
[32]
Yan D., Zhang L., Zhang S.-N., 2015, @doi [ ] 10.1093/mnras/stv2091 , http://adsabs.harvard.edu/abs/2015MNRAS.454.1310Y 454, 1310
2015 doi
-
[33]
Yan D., Yang S., Zhang P., Dai B., Wang J., Zhang L., 2018, @doi [ ] 10.3847/1538-4357/aadd01 , http://adsabs.harvard.edu/abs/2018ApJ...864..164Y 864, 164
2018 doi
-
[34]
Y., Mu H.-J., L \"u L.-Z., Liang E.-W., 2016, @doi [ ] 10.3847/0067-0049/224/2/20 , http://adsabs.harvard.edu/abs/2016ApJS..224...20Y 224, 20
Yi S.-X., Xi S.-Q., Yu H., Wang F. Y., Mu H.-J., L \"u L.-Z., Liang E.-W., 2016, @doi [ ] 10.3847/0067-0049/224/2/20 , http://adsabs.harvard.edu/abs/2016ApJS..224...20Y 224, 20
2016 doi
-
[35]
D., Liu S., Wu K., 2018, @doi [ ] 10.1093/mnras/stx2408 , http://adsabs.harvard.edu/abs/2018MNRAS.473..306Y 473, 306
Yuan Q., Wang Q. D., Liu S., Wu K., 2018, @doi [ ] 10.1093/mnras/stx2408 , http://adsabs.harvard.edu/abs/2018MNRAS.473..306Y 473, 306
2018 doi
-
[36]
M., Chen L., Liang E., 2010, @doi [ ] 10.1088/0004-637X/710/2/1017 , http://adsabs.harvard.edu/abs/2010ApJ...710.1017Z 710, 1017
Zhang J., Bai J. M., Chen L., Liang E., 2010, @doi [ ] 10.1088/0004-637X/710/2/1017 , http://adsabs.harvard.edu/abs/2010ApJ...710.1017Z 710, 1017
2010 doi
-
[37]
write newline
" write newline "" before.all 'output.state := FUNCTION fin.entry write newline FUNCTION new.block output.state before.all = 'skip after.block 'output.state := if FUNCTION new.sentence output.state after.block = 'skip output.state before.all = 'skip after.sentence 'output.stat...
Reviewed August 14, 2026 · model on record in the stance chip above.
Discussion (0). Continue with ORCID to comment.