REVIEW 4 major objections 3 minor 48 references
Low frequency X-ray timing with Gaussian processes and reverberation in the radio-loud AGN 3C 120
T0 review · 4 major / 3 minor · reviewed 2026-08-14 · deepseek-v4-flash
Pith's one-line read Gaussian-process timing recovers a 3,800-second X-ray echo from the inner disc of the radio-loud AGN 3C 120.
desk verdict Solid GP-based timing method with a plausible but not fully secured reverberation claim in 3C 120; worth refereeing with a requested hard-lag comparison. read the letter →
The pith
A machine-rendered reading of the paper's core claim, the machinery that carries it, and where it could break.
The reading
What carries the argument
The central mechanism is a Gaussian process model of each energy-band light curve: the data are drawn from a multivariate Gaussian whose covariance is set by a kernel function, and after optimising the kernel hyperparameters, continuous light-curve realisations are drawn from the conditional distribution of unobserved times given the observed points. The paper uses the rational quadratic kernel, a mixture of squared-exponential correlations on many timescales, which reproduces the broken power-law power spectral density of AGN variability better than a single-scale kernel. It then computes the cross-spectrum, coherence, lag-frequency spectrum, and lag-energy spectrum on each pair of sample light curves and averages over thousands of samples, so the gaps are handled probabilistically rather than by interpolation.
What would settle it
Fit a quantitative hard-lag model in which the lag increases monotonically with energy to the measured $0.3$–$10$ keV lag-energy spectrum between $5\times10^{-6}$ and $3\times10^{-5}$ Hz; if such a model matches the data without an iron K peak, the reverberation interpretation is not unique. A longer observation that resolves the sharp drop above 7 keV and the rise below 1.6 keV would also test whether the claimed iron K line profile in the lag is real.
Extended reading notes
Core claim
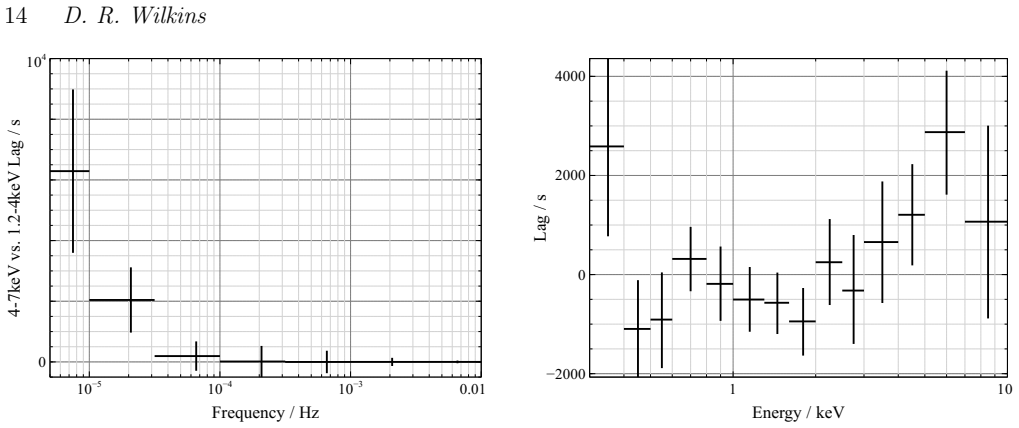
On its own terms, the paper establishes that a Gaussian process fitted independently to each X-ray energy band can preserve the phase relationship between bands across gaps, so that standard Fourier-domain lag measurements can be made at frequencies as low as $5\times10^{-6}$ Hz from concatenated orbit segments. Applied to the 2013 XMM-Newton observations of 3C 120, the method yields a lag-frequency spectrum in which the 4–7 keV band lags the 1.2–4 keV band by $(6300\pm2700)$ s at $7.5\times10^{-6}$ Hz, and a lag-energy spectrum over $5\times10^{-6}$ to $3\times10^{-5}$ Hz with the characteristic iron K profile: the continuum-dominated 1.6–2 keV band responds earliest, the 5–7 keV core of the line responds latest, and the redshifted wing at 3–5 keV responds between them. The author interprets the $(3800\pm1500)$ s lag between the 5–7 keV and 1.6–2 keV bands as X-ray reverberation from the inner disc, detected at 99.5 per cent confidence, and converts it to a coronal scale height of $(13\pm8)\,r_g$ above the disc.
Load-bearing premise
The identification of the lag-energy profile as disc reverberation rather than a continuum hard lag rests on its shape alone; the paper does not fit a quantitative hard-lag model to rule that alternative out.
Editorial extensions
If this is right
- Low-frequency reverberation can be measured from light curves with gaps, so satellites in low-Earth orbit such as NICER, NuSTAR, and the proposed STROBE-X can perform reverberation experiments without continuous visibility.
- Combining successive orbits extends reverberation studies to more massive AGN whose lags appear at lower Fourier frequencies than a single orbit can sample.
- In 3C 120, the coronal height of $(13\pm8)\,r_g$ sits at the upper end of the iron K lag sample for Seyferts, suggesting that a jet-associated corona may be more extended than in radio-quiet AGN.
- Comparing lag-energy profiles between radio-loud and radio-quiet AGN can constrain whether a collimated coronal core can coexist with a jet.
Reading between the lines
- A natural extension the paper does not pursue is applying the same Gaussian-process sampling procedure to covariance spectra and bispectra, which the paper notes are straightforward products of the same sample draws; this would let gap-ridden data probe non-linear variability and the log-normal flux distribution.
- If the 86.3 per cent-confidence hint that the redshifted 3–4 keV wing does not lead the 1–2 keV continuum is confirmed by longer exposures, the lag-energy morphology would favour an extended disc-hugging corona over a slowly propagating jet-base fluctuation source in 3C 120.
- The simulation results imply that at STROBE-X count rates the systematic bias near the orbital frequency (1/5700 s) becomes the limiting error, so a kernel matched more exactly to the power spectral density should be developed before the method is used on very high signal-to-noise data.
Signed reviews
Editorial analysis
A structured set of objections, weighed in public.
Referee Report
Summary. This paper introduces a Gaussian-process framework for Fourier-domain X-ray timing on light curves with orbital gaps. The method fits a kernel (rational quadratic or Matern-1/2) to each energy-band light curve, draws continuous sample light curves, and computes lag-frequency and lag-energy spectra from the samples. Simulations with injected lags validate that phase relationships and lag amplitudes are recovered with known systematic and statistical errors, including for low-Earth-orbit geometries and for long XMM-Newton orbits. The framework is applied to three 2013 XMM-Newton segments of the radio-loud AGN 3C 120. The paper reports a lag-frequency spectrum in which the 4-7 keV band lags the 1.2-4 keV band at low frequencies, and a lag-energy spectrum over 5x10^-6 to 3x10^-5 Hz whose shape is interpreted as reverberation from the inner disc. The 5-7 keV iron-K band is found to lag the 1.6-2 keV continuum by (3800 +/- 1500) s, implying a coronal height of (13 +/- 8) rg. The claimed physical result is a first reverberation measurement in a radio-loud AGN.
Significance. The Gaussian-process timing method is a potentially valuable contribution: it is implemented in a public package (pylag), validated on simulations with known lags, includes a null test for zero lag, and marginalizes over hyperparameter uncertainties with MCMC. If the 3C 120 result is correct, it extends reverberation measurements to higher-mass radio-loud AGN and provides a direct probe of the corona-jet connection. However, the astrophysical claim currently rests on a qualitative exclusion of the hard-lag continuum interpretation, a post-hoc frequency-band choice, and a significance measure that is internal to the GP posterior rather than calibrated against a null hypothesis. These issues are fixable but are load-bearing for the central conclusion.
major comments (4)
- [Section 5.3, Fig. 11] The dismissal of the continuum hard-lag alternative is qualitative rather than quantitative. The sentence 'A hard lag within the continuum emission itself would have produced a lag-energy spectrum smoothly increasing with energy which is not seen here' is not supported by a fit of any hard-lag model to the measured lag-energy points. A model such as tau(E) = a ln(E/E0) + b should be fitted to the points in Fig. 11, with the 7-10 keV bin treated via band contamination, and the goodness of fit compared with the reverberation interpretation. Without this test, the (3800 +/- 1500) s lag is not uniquely attributable to light travel time, and the derived coronal height of (13 +/- 8) rg is not secured.
- [Sections 5.2-5.3, Figs 9 and 11] The frequency band (5x10^-6 to 3x10^-5 Hz) over which the lag-energy spectrum is computed appears to be selected after inspecting the same data: the caption of Fig. 11 describes this range as 'where the iron K band is seen to lag behind the energy band dominated by the X-ray continuum'. This post-hoc selection is not corrected for in the reported significance. The paper should apply the identical selection procedure to null and alternative simulations and report the resulting false-alarm rate, or otherwise account for the trials factor.
- [Section 5.3, significance paragraph] The 99.5 per cent significance is defined as the percentage of GP posterior samples in which the 5-7 keV bin responds later than the 1.6-2 keV bin. Because the GP hyperparameters are fit to the same observed light curves and the samples are conditional on the observed data, this is not a frequentist detection probability. The significance should be calibrated with simulations of lag-free light curves processed through the same GP pipeline, and the false-alarm probability should be quoted.
- [Section 4.1.2, Fig. 7; Section 5.3] The validation simulations show systematic errors of order 10-20 per cent in the lowest-frequency bins for the 3C 120-like observing geometry (Fig. 7), yet the quoted (3800 +/- 1500) s error bar is only the spread of the GP samples. The systematic uncertainty from the GP method should be propagated into the reported lag and coronal-height estimates, or shown to be negligible for the specific 2013 observation geometry, before the quantitative value of the lag can be taken at face value.
minor comments (3)
- [Throughout] There are numerous typographical errors (e.g., 'frequnecy', 'predicitons', 'requried', 'funtions', 'segnents', 'obervations') that should be corrected in a revised manuscript.
- [Fig. 7 caption] The caption says 'a 500 s lag' while the text and the simulation description refer to a 5000 s lag; this should be harmonized.
- [Section 4.1.2] The text states that the GP statistical uncertainty is 'around three times' that of continuous light curves, then later states that the Poisson-resampling test shows the GP uncertainty is 'around 10 times' that of continuous light curves; these statements should be reconciled and clarified.
Circularity Check
No significant circularity: the GP-derived lag is not imposed by the model, the method is validated on simulated light curves, and the coronal-height conversion is direct light-travel-time arithmetic.
full rationale
The paper's central measurement is not circular. The Gaussian process is fit independently to each energy band's light curve with a kernel that models only the single-series autocorrelation; no lag or cross-spectral phase parameter is introduced in the fit, so the (3800 +/- 1500) s lag is not an input. The method is validated externally on simulated light curves with known injected lags (200 s and 5000 s), and a null test confirms that zero lag is recovered when none is present. The conversion from the measured lag to coronal height is direct arithmetic using the black-hole mass and light-travel time, not a fitted parameter renamed as a prediction. Self-citations (e.g., Wilkins & Fabian 2011, 2012, 2013, 2016; Wilkins et al. 2017) are used for interpreting the lag-energy profile shape and for the scale-height framework, but the detection itself is not justified by those citations. The main weaknesses are statistical and model-selection issues: the low-frequency band (5e-6 to 3e-5 Hz) is chosen after seeing the lag-frequency spectrum, the reported 99.5 percent significance is computed from GP posterior samples, and the hard-lag alternative is excluded by shape rather than by fitting a quantitative model. These are correctness risks, not circularity by construction.
Assumptions & free parameters
free parameters (1)
- RQ kernel hyperparameters per energy band =
not reported in text
assumptions (5)
- standard math The conditional distribution of a multivariate Gaussian gives the correct interpolation of the latent light curve.
- domain assumption AGN X-ray variability is stationary in log count rate and its covariance is adequately described by a rational quadratic kernel.
- domain assumption Poisson counting noise is well approximated by additive Gaussian white noise.
- domain assumption The lag-energy spectrum shape can be interpreted as disc reverberation, while a continuum hard lag would rise smoothly with energy.
- domain assumption The published black hole mass and the coronal-height conversion of Wilkins and Fabian 2013 apply to 3C 120.
Cite this review
Pith. "Pith review of Low frequency X-ray timing with Gaussian processes and reverberation in the radio-loud AGN 3C 120." pith.science (2026). https://pith.science/paper/WECM4PCD
@misc{pith2026190806099,
  author       = {Pith},
  title        = {Pith review of: Low frequency X-ray timing with Gaussian processes and reverberation in the radio-loud AGN 3C 120},
  year         = {2026},
  howpublished = {\url{https://pith.science/paper/WECM4PCD}},
  note         = {Machine review of arXiv:1908.06099}
}
read the original abstract
A framework is developed to perform Fourier-domain timing analysis on X-ray light curves with gaps, employing Gaussian processes to model the probability distribution underlying the observed time series from which continuous samples can be drawn. A technique is developed to measure X-ray reverberation from the inner regions of accretion discs around black holes in the low frequency components of the variability, on timescales longer than can be probed employing standard Fourier techniques. This enables X-ray reverberation experiments to be performed using data from satellites in low-Earth orbit such as NICER, NuSTAR and the proposed X-ray timing mission STROBE-X, and enables long timescale reverberation around higher mass AGN to be measured by combining multiple observations. Gaussian processes are applied to observations of the broad line radio galaxy 3C120 spanning two orbits with XMM-Newton to measure the relative time lags of successive X-ray energy bands. The lag-energy spectrum between 5E-6 and 3E-5Hz, estimated using Gaussian processes, reveals X-ray reverberation from the inner accretion disc for the first time in this radio-loud AGN. Time lags in the relativistically broadened iron K line are significantly detected. The core of the line lags behind the continuum by (3800 +/- 1500)s, suggesting a scale height of the corona of (13 +/- 8)rg above the disc. The ability to compare the structure of coronae in radio loud AGN to their radio quiet counterparts will yield important insight into the mechanisms by which black holes are able to launch jets.
Figures


Figures from the paper (7 more)



Reference graph
Works this paper leans on
- [1]
-
[2]
Bond J. R., Jaffe A. H., Knox L., 1998, @doi [ ] 10.1103/PhysRevD.57.2117 , https://ui.adsabs.harvard.edu/abs/1998PhRvD..57.2117B 57, 2117
-
[3]
M., Zoghbi A., Reynolds C., Fabian A
Cackett E. M., Zoghbi A., Reynolds C., Fabian A. C., Kara E., Uttley P., Wilkins D. R., 2014, @doi [ ] 10.1093/mnras/stt2424 , http://adsabs.harvard.edu/abs/2014MNRAS.438.2980C 438, 2980
-
[4]
Cowperthwaite P. S., Reynolds C. S., 2012, @doi [ ] 10.1088/2041-8205/752/2/L21 , https://ui.adsabs.harvard.edu/abs/2012ApJ...752L..21C 752, L21
-
[5]
Czekala I., Mandel K. S., Andrews S. M., Dittmann J. A., Ghosh S. K., Montet B. T., Newton E. R., 2017, @doi [ ] 10.3847/1538-4357/aa6aab , https://ui.adsabs.harvard.edu/abs/2017ApJ...840...49C 840, 49
-
[6]
De Marco B., Ponti G., Cappi M., Dadina M., Uttley P., Cackett E. M., Fabian A. C., Miniutti G., 2013, @doi [ ] 10.1093/mnras/stt339 , http://adsabs.harvard.edu/abs/2013MNRAS.431.2441D 431, 2441
-
[7]
Edelson R. A., Krolik J. H., 1988, @doi [ ] 10.1086/166773 , https://ui.adsabs.harvard.edu/abs/1988ApJ...333..646E 333, 646
doi:10.1086/166773 1988
-
[8]
Edelson R., Turner T. J., Pounds K., Vaughan S., Markowitz A., Marshall H., Dobbie P., Warwick R., 2002, @doi [ ] 10.1086/323779 , http://adsabs.harvard.edu/abs/2002ApJ...568..610E 568, 610
doi:10.1086/323779 2002
Show all 48 references
-
[9]
E., 2016, @doi [ ] 10.1051/0004-6361/201527665 , https://ui.adsabs.harvard.edu/abs/2016A&A...591A.113E 591, A113
Epitropakis A., Papadakis I. E., 2016, @doi [ ] 10.1051/0004-6361/201527665 , https://ui.adsabs.harvard.edu/abs/2016A&A...591A.113E 591, A113
2016 doi
-
[10]
C., Rees M
Fabian A. C., Rees M. J., Stella L., White N. E., 1989, , http://ukads.nottingham.ac.uk/abs/1989MNRAS.238..729F 238, 729
1989
-
[11]
C., et al., 2009, @doi [ ] 10.1038/nature08007 , http://adsabs.harvard.edu/abs/2009Natur.459..540F 459, 540
Fabian A. C., et al., 2009, @doi [ ] 10.1038/nature08007 , http://adsabs.harvard.edu/abs/2009Natur.459..540F 459, 540
2009 doi
-
[12]
C., Arzoumanian Z., Okajima T., 2012, in
Gendreau K. C., Arzoumanian Z., Okajima T., 2012, in . p. 844313, @doi 10.1117/12.926396
2012 doi
-
[13]
M., Fabian A
George I. M., Fabian A. C., 1991, , http://ukads.nottingham.ac.uk/abs/1991MNRAS.249..352G 249, 352
1991
-
[14]
C., Cackett E
Kara E., Fabian A. C., Cackett E. M., Uttley P., Wilkins D. R., Zoghbi A., 2013, @doi [ ] 10.1093/mnras/stt1055 , http://adsabs.harvard.edu/abs/2013MNRAS.434.1129K 434, 1129
2013 doi
-
[15]
Kara E., et al., 2015, @doi [ ] 10.1093/mnras/stu2136 , http://adsabs.harvard.edu/abs/2015MNRAS.446..737K 446, 737
2015 doi
-
[16]
N., Fabian A
Kara E., Alston W. N., Fabian A. C., Cackett E. M., Uttley P., Reynolds C. S., Zoghbi A., 2016, @doi [ ] 10.1093/mnras/stw1695 , https://ui.adsabs.harvard.edu/\#abs/2016MNRAS.462..511K 462, 511
2016 doi
-
[17]
Kara E., et al., 2019, @doi [ ] 10.1038/s41586-018-0803-x , https://ui.adsabs.harvard.edu/abs/2019Natur.565..198K 565, 198
2019 doi
-
[18]
Kataoka J., et al., 2007, @doi [ ] 10.1093/pasj/59.2.279 , https://ui.adsabs.harvard.edu/abs/2007PASJ...59..279K 59, 279
2007 doi
-
[19]
M., et al., 2013, @doi [ ] 10.1088/0004-637X/772/2/83 , https://ui.adsabs.harvard.edu/abs/2013ApJ...772...83L 772, 83
Lohfink A. M., et al., 2013, @doi [ ] 10.1088/0004-637X/772/2/83 , https://ui.adsabs.harvard.edu/abs/2013ApJ...772...83L 772, 83
2013 doi
-
[20]
P., Jorstad S
Marscher A. P., Jorstad S. G., G \'o mez J.-L., Aller M. F., Ter \"a sranta H., Lister M. L., Stirling A. M., 2002, @doi [ ] 10.1038/nature00772 , https://ui.adsabs.harvard.edu/abs/2002Natur.417..625M 417, 625
2002 doi
-
[21]
C., Reynolds C
Matt G., Fabian A. C., Reynolds C. S., 1997, , http://adsabs.harvard.edu/abs/1997MNRAS.289..175M 289, 175
1997
-
[22]
M., Papadakis I
McHardy I. M., Papadakis I. E., Uttley P., Page M. J., Mason K. O., 2004, @doi [ ] 10.1111/j.1365-2966.2004.07376.x , http://adsabs.harvard.edu/abs/2004MNRAS.348..783M 348, 783
2004
-
[23]
M., Koerding E., Knigge C., Uttley P., Fender R
McHardy I. M., Koerding E., Knigge C., Uttley P., Fender R. P., 2006, @doi [ ] 10.1038/nature05389 , http://adsabs.harvard.edu/abs/2006Natur.444..730M 444, 730
2006 doi
-
[24]
J., Reeves J
Miller L., Turner T. J., Reeves J. N., Lobban A., Kraemer S. B., Crenshaw D. M., 2010a, @doi [ ] 10.1111/j.1365-2966.2009.16149.x , https://ui.adsabs.harvard.edu/abs/2010MNRAS.403..196M 403, 196
2009
-
[25]
J., Reeves J
Miller L., Turner T. J., Reeves J. N., Braito V., 2010b, @doi [ ] 10.1111/j.1365-2966.2010.17261.x , http://adsabs.harvard.edu/abs/2010MNRAS.408.1928M 408, 1928
2010
-
[26]
Miyamoto S., Kitamoto S., 1989, @doi [ ] 10.1038/342773a0 , http://adsabs.harvard.edu/abs/1989Natur.342..773M 342, 773
1989 doi
-
[27]
Mizumoto M., Done C., Hagino K., Ebisawa K., Tsujimoto M., Odaka H., 2018, @doi [ ] 10.1093/mnras/sty1114 , https://ui.adsabs.harvard.edu/abs/2018MNRAS.478..971M 478, 971
2018 doi
-
[28]
A., Vaughan B
Nowak M. A., Vaughan B. A., Wilms J., Dove J. B., Begelman M. C., 1999, @doi [ ] 10.1086/306610 , http://adsabs.harvard.edu/abs/1999ApJ...510..874N 510, 874
1999 doi
-
[29]
L., Markoff S., 2010, @doi [ ] 10.1088/0004-637X/723/2/1343 , https://ui.adsabs.harvard.edu/abs/2010ApJ...723.1343P 723, 1343
Polko P., Meier D. L., Markoff S., 2010, @doi [ ] 10.1088/0004-637X/723/2/1343 , https://ui.adsabs.harvard.edu/abs/2010ApJ...723.1343P 723, 1343
2010 doi
-
[30]
Pozo Nu \ n ez F., Ramolla M., Westhues C., Bruckmann C., Haas M., Chini R., Steenbrugge K., Murphy M., 2012, @doi [ ] 10.1051/0004-6361/201219107 , https://ui.adsabs.harvard.edu/abs/2012A&A...545A..84P 545, A84
2012 doi
-
[31]
E., Williams C., 2006, Gaussian Processes for Machine Learning
Rasmussen C. E., Williams C., 2006, Gaussian Processes for Machine Learning . MIT Press
2006
-
[32]
S., et al., 2018, in Society of Photo-Optical Instrumentation Engineers (SPIE) Conference Series
Ray P. S., et al., 2018, in Society of Photo-Optical Instrumentation Engineers (SPIE) Conference Series . p. 1069919, @doi 10.1117/12.2312257
2018 doi
-
[33]
S., 2000, @doi [ ] 10.1086/308697 , https://ui.adsabs.harvard.edu/abs/2000ApJ...533..811R 533, 811
Reynolds C. S., 2000, @doi [ ] 10.1086/308697 , https://ui.adsabs.harvard.edu/abs/2000ApJ...533..811R 533, 811
2000 doi
-
[35]
Str \"u der L., et al., 2001, @doi [ ] 10.1051/0004-6361:20000066 , http://adsabs.harvard.edu/abs/2001A\
2001 doi
-
[36]
Timmer J., Koenig M., 1995, , http://adsabs.harvard.edu/abs/1995A\
1995
-
[38]
M., Vaughan S., 2005, @doi [ ] 10.1111/j.1365-2966.2005.08886.x , https://ui.adsabs.harvard.edu/\#abs/2005MNRAS.359..345U 359, 345
Uttley P., McHardy I. M., Vaughan S., 2005, @doi [ ] 10.1111/j.1365-2966.2005.08886.x , https://ui.adsabs.harvard.edu/\#abs/2005MNRAS.359..345U 359, 345
2005
-
[39]
M., Fabian A
Uttley P., Cackett E. M., Fabian A. C., Kara E., Wilkins D. R., 2014,
2014
-
[40]
J., et al., 2013, @doi [ ] 10.1088/2041-8205/777/2/L23 , http://adsabs.harvard.edu/abs/2013ApJ...777L..23W 777, L23
Walton D. J., et al., 2013, @doi [ ] 10.1088/2041-8205/777/2/L23 , http://adsabs.harvard.edu/abs/2013ApJ...777L..23W 777, L23
2013 doi
-
[41]
R., Fabian A
Wilkins D. R., Fabian A. C., 2011, @doi [ ] 10.1111/j.1365-2966.2011.18458.x , http://adsabs.harvard.edu/abs/2011MNRAS.414.1269W 414, 1269
2011
-
[43]
R., Fabian A
Wilkins D. R., Fabian A. C., 2013, @doi [ ] 10.1093/mnras/sts591 , http://adsabs.harvard.edu/abs/2013MNRAS.430..247W 430, 247
2013 doi
-
[44]
R., Cackett E
Wilkins D. R., Cackett E. M., Fabian A. C., Reynolds C. S., 2016, @doi [ ] 10.1093/mnras/stw276 , http://adsabs.harvard.edu/abs/2016MNRAS.458..200W 458, 200
2016 doi
-
[45]
R., Gallo L
Wilkins D. R., Gallo L. C., Silva C. V., Costantini E., Brandt W. N., Kriss G. A., 2017, @doi [ ] 10.1093/mnras/stx1814 , https://ui.adsabs.harvard.edu/\#abs/2017MNRAS.471.4436W 471, 4436
2017 doi
-
[46]
D., Wilkins D
Yuan Y., Blandford R. D., Wilkins D. R., 2019a, @doi [ ] 10.1093/mnras/stz332 , https://ui.adsabs.harvard.edu/abs/2019MNRAS.484.4920Y 484, 4920
-
[47]
D., Wilkins D
Yuan Y., Spitkovsky A., Blandford R. D., Wilkins D. R., 2019b, @doi [ ] 10.1093/mnras/stz1599 , https://ui.adsabs.harvard.edu/abs/2019MNRAS.487.4114Y 487, 4114
-
[48]
C., Reynolds C
Zoghbi A., Fabian A. C., Reynolds C. S., Cackett E. M., 2012, @doi [ ] 10.1111/j.1365-2966.2012.20587.x , http://adsabs.harvard.edu/abs/2012MNRAS.422..129Z 422, 129
2012
-
[49]
M., Miniutti G., Kara E., Fabian A
Zoghbi A., Reynolds C., Cackett E. M., Miniutti G., Kara E., Fabian A. C., 2013a, @doi [ ] 10.1088/0004-637X/767/2/121 , http://adsabs.harvard.edu/abs/2013ApJ...767..121Z 767, 121
-
[50]
M., 2013b, @doi [ ] 10.1088/0004-637X/777/1/24 , https://ui.adsabs.harvard.edu/abs/2013ApJ...777...24Z 777, 24
Zoghbi A., Reynolds C., Cackett E. M., 2013b, @doi [ ] 10.1088/0004-637X/777/1/24 , https://ui.adsabs.harvard.edu/abs/2013ApJ...777...24Z 777, 24
-
[51]
Zoghbi A., et al., 2014, @doi [ ] 10.1088/0004-637X/789/1/56 , http://adsabs.harvard.edu/abs/2014ApJ...789...56Z 789, 56
2014 doi
Reviewed August 14, 2026 · model on record in the stance chip above.
Discussion (0). Continue with ORCID to comment.