REVIEW 4 major objections 6 minor 9 references
Report on energy-efficiency evaluation of several NWP model configurations
T0 review · 4 major / 6 minor · reviewed 2026-08-14 · deepseek-v4-flash
Pith's one-line read Four weather-prediction workloads show energy consumption that first falls and then rises as core count increases, with a local minimum at an intermediate configuration.
desk verdict Genuinely useful energy measurements for NWP cores, but the headline U-shape rests on one extrapolated curve and an optical comparison built on projected throughput. read the letter →
The pith
A machine-rendered reading of the paper's core claim, the machinery that carries it, and where it could break.
The reading
What carries the argument
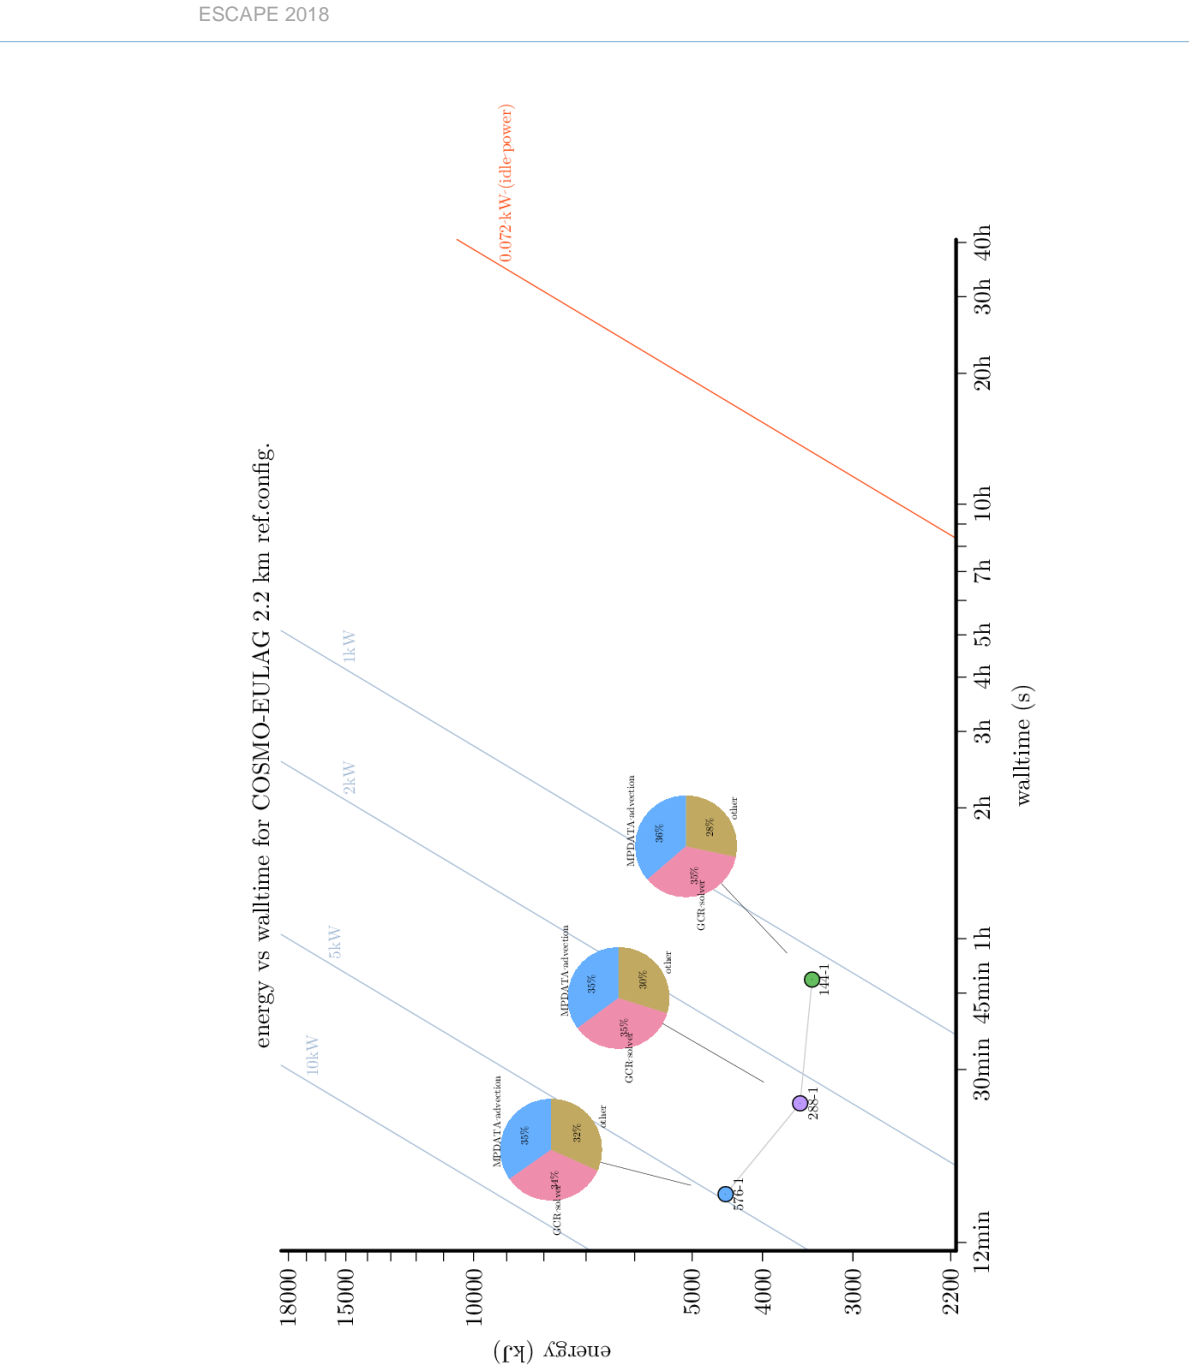
The load-bearing object is the energy-versus-wall-clock curve, measured at compute-node level, and its explanation is the average-power function P(N). For a partially filled node, P is nearly independent of the number of active cores; once a full 36-core node is used, P grows approximately linearly with N. Combined with the observed leveling off of wall-clock time at high core counts, this makes E(N)=P(N)t(N) U-shaped. To judge whether a code is compute-bound or memory-bound in energy terms, the report also introduces the energy roofline, an 'arch line' analogue of the time-based roofline whose balance point separates energy-compute-bound from energy-memory-bound regions; the gap between time-balance and energy-balance points measures how much harder energy optimization may be than time optimization.
What would settle it
Measure total system energy including network switches, network interface cards, and cooling for the ALARO reference configuration at the reported core counts; if communication-plus-cooling energy grows faster than compute-node energy as N increases, the rising arm of the U-curve steepens and the energy-minimizing N is smaller than the one reported.
Extended reading notes
Core claim
The paper's central claim is that for the BiFFT and Acraneb dwarfs and for the ALARO 2.5 km and COSMO-EULAG reference configurations, the energy consumed by a run, plotted against its wall-clock time as the core count is varied, follows a U-shaped curve with a local minimum at some core count N. The mechanism is the average power of a compute node: it rises slowly for partial-node runs, then becomes nearly linear in the number of cores once full nodes are used; because real applications are not perfectly scalable, wall-clock time eventually stops improving, so total energy E = P × t starts increasing linearly with N. The U-shape does not define a universal optimum, since some users need minimum wall-clock time rather than minimum energy. The paper also reports that relative energy contributions of the BiFFT dwarf to ALARO differ from its wall-clock contributions because communication energy is not measured, and that optical processors are much less energy-hungry for BiFFT but slower and numerically inadequate.
Load-bearing premise
The central result assumes that the energy consumed by inter-node communication and by cooling can be neglected, so compute-node energy readings capture the full story; if communication energy grows with core count, the U-shaped curve's rising side is understated and the energy-minimizing core count would be lower.
Editorial extensions
If this is right
- Each measured configuration has a core count that minimizes energy for the fixed workload; beyond it, additional cores buy little runtime and cost extra energy.
- Energy-optimal and runtime-optimal configurations differ, so an operational scheduling decision is required: pay more energy for faster forecasts or accept slower forecasts to save energy.
- Because communication and cooling energy are not accounted for, the reported energy shares of individual dwarfs are closer to computational-workload shares than the wall-clock shares, which include communication overhead.
- The energy roofline, if instrumented at high sampling frequency, could identify whether a loop or subroutine is easier to optimize for time or for energy, via the time-energy balance gap.
- Optical processors can beat the CPU on energy alone for the BiFFT workload, but their wall-clock time and numerical precision keep them non-competitive for NWP at current resolutions.
Reading between the lines
- If communication energy were included in the measurements, the right side of the U-curve would likely rise more steeply, shifting the energy-minimizing core count to a lower value than reported.
- The U-shape analysis suggests a practical diagnostic: for any strongly scaled code, plotting energy against wall-clock time separates the flat-power regime from the linear-power regime; deviations from the expected shape could expose communication or load-balance overheads.
- The energy roofline's balance gap implies that a code with arithmetic intensity between the time-balance and energy-balance points is simultaneously compute-bound in time and memory-bound in energy; raising its arithmetic intensity would help energy efficiency more than time efficiency.
- The optical-processor comparison hints at a crossover resolution where the constant wall-time scaling of optics would beat the n-log-n scaling of CPUs, but the paper's own numerical-precision caveat suggests this crossover is moot until the precision problem is solved.
Signed reviews
Editorial analysis
A structured set of objections, weighed in public.
Referee Report
Summary. This deliverable reports node-level energy measurements with PAPI Cray PM counters on an Intel Broadwell cluster for four NWP-related workloads: the BiFFT dwarf, the Acraneb2 radiation dwarf, the ALARO 2.5 km reference configuration, and the COSMO-EULAG 2.2 km configuration. The central empirical claim is that energy consumption versus wall-clock time is U-shaped as the number of cores varies, because average node power is roughly constant below one full node and then scales approximately linearly with core count. The paper also estimates relative dwarf energy contributions in ALARO, compares BiFFT energy on CPU with projected Optalysys optical-processor performance, and discusses the energy roofline as a candidate metric. The resulting message is that energy-optimal core counts differ from wall-clock-optimal core counts for these workloads.
Significance. If the U-shape is confirmed by direct measurements, the observation is practically relevant for scheduling and procurement in NWP: users can trade a small increase in wall-clock time for substantial energy savings, and the energy-optimal parallelism is not the fastest configuration. The paper's measurement methodology, including dedicated nodes, idle-power baselines, repeated runs with error bars, and explicit caveats about unmeasured infrastructure energy, is a useful template for future energy studies in operational weather prediction. The core observation is not produced by a fitted model, and the average-power explanation is supported by the measured power-versus-core-count behavior. The Acraneb multi-node curve and the Optalysys projections are, however, extrapolations rather than measurements, so the breadth of the empirical claim exceeds the data; the energy roofline discussion is a reasonable forward-looking proposal but is not applied to the measurements.
major comments (4)
- [Section 4.3, Figure 3] The multi-node Acraneb points are not measured but constructed by the assumption that 'the energy consumption of n full nodes equals n times that of 1 full node while the wall-clock time remains the same.' This makes the rising branch of the Acraneb U-shape an artifact of the extrapolation rather than an observed phenomenon. Since the Executive Summary and Section 6 state the U-shape as a result across the measured configurations, the claim should be narrowed to BiFFT and ALARO, or the Acraneb curve should be explicitly labeled as a model-based estimate. The same section's caveat that the pseudo-parallel runs scale worse than the D4.3 profiling data reinforces this concern.
- [Section 4.4, Figure 4] The ALARO dwarf energy pie charts are built by multiplying wall-clock time fractions by average powers measured in separate dwarf runs. This assumes the energy contributions of BiFFT, Acraneb, and the rest of the model add linearly and that dwarf power remains unchanged when embedded in ALARO. Communication energy is explicitly excluded, so the claim in the Executive Summary that the energy pie charts are 'more representative of the relative computational workloads' is not supported unless this additivity assumption is stated and justified.
- [Section 4.5, Figure 6] Only three COSMO-EULAG data points are available, with the 1152-core run lost and runs below 72 cores impossible due to memory limits. Three points, on differing grids and timesteps, cannot establish the U-shape for this configuration. The paper should not imply that a U-shape was measured for COSMO-EULAG; at most the available points are consistent with the pattern observed elsewhere.
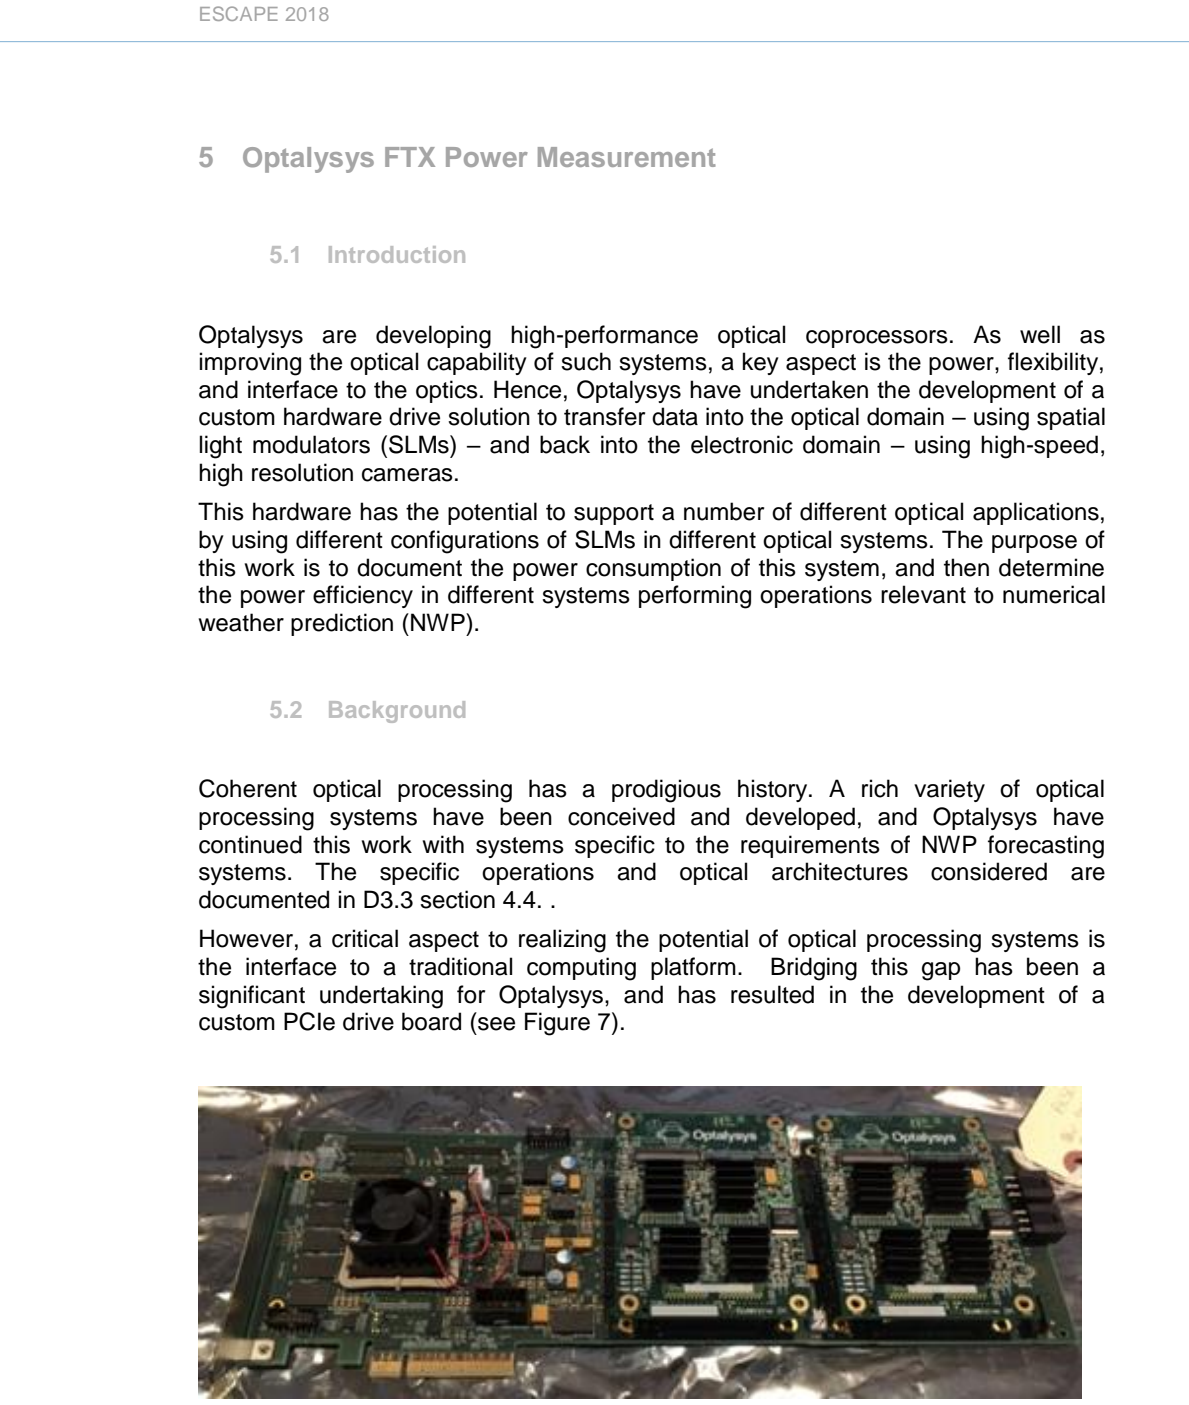
- [Sections 5.3.2.1 and 5.5] The Optalysys energy comparison is based on projected operation times that, as the text states, 'have not been demonstrated,' and on an assumed packing of 8 BiFFT transformations into a 1920x1080 frame. The Executive Summary and Conclusion state that the optical processors are 'much less energy costly' without carrying this conditionality. Please present the comparison as a conditional projection or add the qualification to every summary statement of the finding.
minor comments (6)
- [Section 4.1] The processor is called the Intel Xeon E5-2695v4 here while the title, abstract, and introduction say E5-2697v4; please reconcile the inconsistency.
- [Section 4.2, Figure 2] The text says the optimal configuration appears to be 'in the range between 30-150 cores or so,' but the figure axes show energy versus wall-clock time; please clarify how the reader should map that statement to the displayed data points.
- [Section 4.4, Figure 5] The log-log power-versus-core-count plot is central to the explanation of the U-shape; adding a numerical fit or at least the measured slopes for the sub-node and multi-node regimes would make the 'slope close to 1' statement easier to verify.
- [Section 3.2] The energy roofline is presented as a promising metric but is not applied to any of the measured workloads in this deliverable; please clarify that it is a proposal for future work rather than a result of the current measurements.
- [Section 5.4, Table 2] The 0.1 ms, 6.6 mJ entry for a 2048x1536 complex-to-complex 2D FT is inferred from the convolution scenario rather than measured directly; the footnote helps, but the caption could state this more prominently.
- [References] Several citations refer to ESCAPE deliverables (D4.3, D3.3) and internal profiling data; for a public audience, please indicate how those documents can be accessed or summarize the relevant profiling results needed to reproduce the comparisons.
Circularity Check
No circular derivation: the U-shaped energy curve is empirically measured for three configurations; the Acraneb multi-node points are an explicitly labeled extrapolation, not a hidden fit.
full rationale
The paper's central claim is an empirical U-shaped energy-versus-wall-clock curve, supported by direct PAPI PM-counter measurements for the BiFFT dwarf, the ALARO 2.5 km reference configuration, and the COSMO-EULAG configuration. For Acraneb, the multi-node points are constructed by the explicit assumption that 'the energy consumption of n full nodes equals n times that of 1 full node while the wall-clock time remains the same'; this is a transparent extrapolation, not a fitted parameter renamed as a prediction, and the paper immediately cautions that true parallel runs would stretch the curve to lower wall-clock times. The U-shape explanation in terms of average power becoming roughly constant below one full node and then nearly linear in core count is a physical interpretation of measured power data, not a definitional restatement of the energy-time identity. The energy roofline is imported from Choi et al. (2013) as an external proposal, and D4.3 is cited only for previous scaling behavior, not as a uniqueness theorem or to force the present conclusion. The dwarf pie-chart estimates in section 4.4 also rest on an explicit linear-additivity assumption, which is a limitation because communication energy is excluded, but it is not circular reasoning. No load-bearing step reduces, by the paper's own equations or by self-citation, to its own input.
Assumptions & free parameters
assumptions (4)
- domain assumption PAPI Cray PM counters yield accurate node-level energy readings at about 10 Hz and are stable for the job durations tested.
- ad hoc to paper The energy consumption of n full nodes can be estimated as n times one full node, with unchanged wall-clock time, for the Acraneb dwarf.
- ad hoc to paper The projected Optalysys operation rates (10 ms for a 1920x1080 complex-to-real 2D FT, 20 ms for real-to-complex, 66 W average power) are achievable in operation.
- domain assumption Energy consumed by communication and cooling is negligible or out of scope.
Cite this review
Pith. "Pith review of Report on energy-efficiency evaluation of several NWP model configurations." pith.science (2026). https://pith.science/paper/B777SEAW
@misc{pith2026190806115,
  author       = {Pith},
  title        = {Pith review of: Report on energy-efficiency evaluation of several NWP model configurations},
  year         = {2026},
  howpublished = {\url{https://pith.science/paper/B777SEAW}},
  note         = {Machine review of arXiv:1908.06115}
}
read the original abstract
This document is one of the deliverable reports created for the ESCAPE project. ESCAPE stands for Energy-efficient Scalable Algorithms for Weather Prediction at Exascale. The project develops world-class, extreme-scale computing capabilities for European operational numerical weather prediction and future climate models. This is done by identifying Weather & Climate dwarfs which are key patterns in terms of computation and communication (in the spirit of the Berkeley dwarfs). These dwarfs are then optimised for different hardware architectures (single and multi-node) and alternative algorithms are explored. Performance portability is addressed through the use of domain specific languages. In this deliverable we report on energy consumption measurements of a number of NWP models/dwarfs on the Intel E5-2697v4 processor. The chosen energy metrics and energy measurement methods are documented. Energy measurements are performed on the Bi-Fourier dwarf (BiFFT), the Acraneb dwarf, the ALARO 2.5 km Local Area Model reference configuration (B\'enard et al. 2010, Bubnova et al. 1995) and on the COSMO-EULAG Local Area Model reference configuration (Piotrowski et al. 2018). The results show a U-shaped dependence of the consumed energy on the wall-clock time performance. This shape can be explained from the dependence of the average power of the compute nodes on the total number of cores used. We compare the energy consumption of the BiFFT dwarf on the E5-2697v4 processor to that on the Optalysys optical processors. The latter are found to be much less energy costly, but at the same time it is also the only metric where they outperform the classical CPU. They are non-competitive as far as wall-clock time and especially numerical precision are concerned.
Figures
Reference graph
Works this paper leans on
-
[1]
Definition of energy metrics
-
[2]
Evaluate energy of alternative advective transport options
-
[3]
ESCAPE 2018 D4.5 Report on energy-efficiency evaluation of several NWP model configurations 3
Evaluate energy efficiency of optical processors for the bi -Fourier transform in a local area model (LAM) context. ESCAPE 2018 D4.5 Report on energy-efficiency evaluation of several NWP model configurations 3
work page 2018
-
[4]
Test the energy -efficiency of different time -stepping strategies in a LAM context. The performed work consists of: • A description of the energy metrics used and the chosen methodology to measure energy. • A report of the results of energy measurements of the ALARO 2.5 km reference configuration, the COSMO -EULAG reference configuration, the Bi - Fourie...
work page 2013
-
[5]
The power draw of the electronic hardware
-
[6]
The rate of operations performed. 5.3.1 Measuring the power draw In order to measure the power draw of the electronics, the power delivered to the entire optoelectronic system was measured using a Picotech current clamp around the PCIe power -delivery line . The design of the device is such that power is not drawn over the PCIe connector; the current thro...
-
[7]
A system to perform 2D Fourier transforms (the BiFFT dwarf)
-
[8]
A system to perform spherical harmonic transforms (the spherical Harmonics dwarf)
Show all 9 references
-
[9]
one size fits all
A system to perform optical convolutions, for pattern matching or deep learning applications. 5.3.2.1 BiFFT dwarf This dwarf is in some sense the simplest to implement optically: a simple lens performs a 2D Fourier transform. However, as is ful ly discussed in Deliverable D2 -...
2010
Reviewed August 14, 2026 · model on record in the stance chip above.
Discussion (0). Continue with ORCID to comment.