REVIEW 2 major objections 4 minor 26 references
Detection of sub-100 GeV gamma-ray pulsations from PSR B1706-44 with H.E.S.S
T0 review · 2 major / 4 minor · reviewed 2026-08-14 · deepseek-v4-flash
Pith's one-line read PSR B1706−44 is detected as a pulsed gamma-ray source in 28.3 hours of H.E.S.S. II CT5 monoscopic observations at 4.74σ significance, making it the fourth pulsar seen from the ground.
desk verdict A credible fourth ground-based pulsar detection with a clean spectral match to Fermi-LAT, but the abstract's ~70 GeV 'significant signal' claim is unsupported by the paper's own 2.5 sigma bin. read the letter →
The pith
A machine-rendered reading of the paper's core claim, the machinery that carries it, and where it could break.
The reading
What carries the argument
The analysis chain uses events imaged by CT5, the single 28 m telescope, in monoscopic mode, with a boosted decision tree trained on Monte Carlo gamma-ray signal and real data background to reject hadrons, plus a 0.3° spatial cut and ON/OFF phase windows defined from the Fermi-LAT phasogram (ON: phase 0.25–0.55; OFF: phase 0.6–0.2). Event timestamps are folded into pulsar phase with the Tempo2 timing package using an ephemeris built from LAT timing and radio data, and significance is computed with the Li&Ma test and a maximum-likelihood ratio test using a kernel-density estimate of the Fermi light curve. A forward-folding maximum-likelihood fit with Monte Carlo instrument response functions converts reconstructed energies into the spectral points.
What would settle it
Recompute the Li&Ma significance from the same 28.3 hours while shifting the OFF window to include phases 0.2–0.25 and 0.55–0.6, and repeat with a tightened or loosened boosted-decision-tree cut; a stable excess above 4σ across these choices would confirm the pulsation, while a drop below 3σ for a reasonable OFF definition would indicate the detection depends on the background interval.
Extended reading notes
Core claim
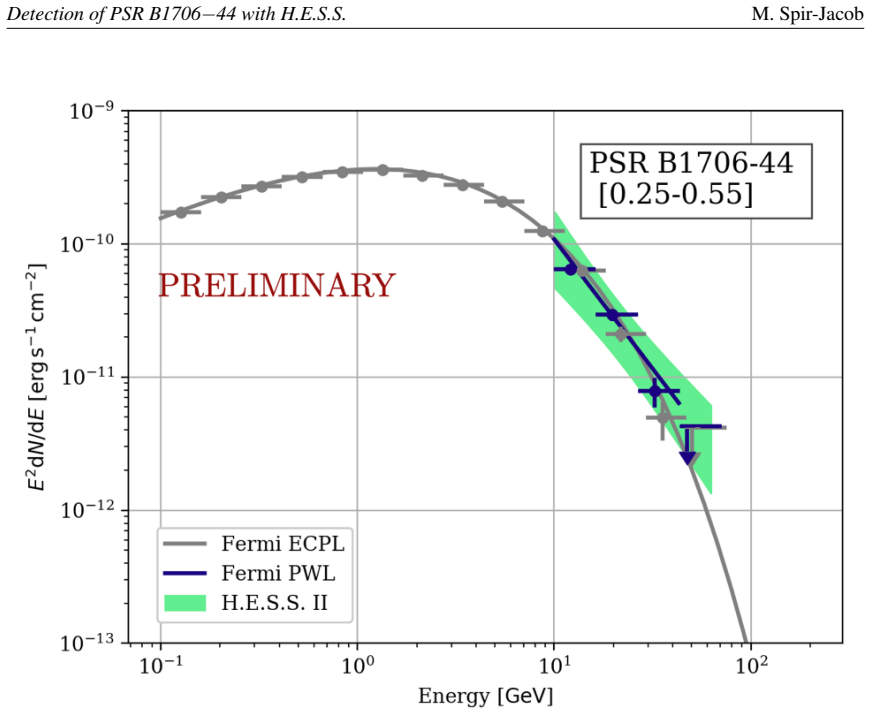
The central claim is that PSR B1706−44 exhibits pulsed gamma-ray emission in the sub-20 GeV to sub-100 GeV range when 28.3 hours of H.E.S.S. II CT5 monoscopic data are folded with a combined radio and LAT ephemeris. The phasogram matches Fermi-LAT above 15 GeV, and a maximum-likelihood ratio test using the Fermi phasogram as template gives 4.6σ significance, while the independent Li&Ma ON/OFF test gives 4.74σ. The spectrum from both instruments above 10 GeV is consistent with a steep power law of index about −3.8, but the statistics do not allow distinguishing a continued power law from a curvature or cutoff. This makes the source the fourth pulsar detected from the ground and extends its measured spectrum toward 100 GeV.
Load-bearing premise
The detection significance assumes that the residual background remaining after the boosted-decision-tree and spatial cuts is identical in the ON-phase interval (0.25–0.55) and the OFF-phase interval (0.6–0.2), so a phase-dependent cosmic-ray or diffuse background would not inflate the 4.74σ excess.
Editorial extensions
If this is right
- PSR B1706−44 joins the short list of pulsars detected from the ground: the Crab, Vela and Geminga.
- The pulsed spectrum above 10 GeV is very steep, with photon index about −3.8 to −3.9 in both H.E.S.S. II-CT5 and Fermi-LAT, extending the measured spectrum into the sub-100 GeV range.
- The H.E.S.S. light curve, in which the second peak dominates, tracks the Fermi-LAT phasogram above 15 GeV, indicating that the pulsed mechanism seen by Fermi persists at ground-accessible energies.
- Current statistics cannot distinguish a continued power law from a curvature or cutoff near 70 GeV; the paper states that further H.E.S.S. or CTA observations are needed to decide whether the tail behaves more like Vela's or Crab's.
Reading between the lines
- If the steep power law continues past 100 GeV, exponential-cutoff models for this pulsar's spectrum would need a separate high-energy tail component; this is an inference beyond what the paper itself claims.
- The same ON/OFF phase-definition strategy from Fermi phasograms could be applied to other imaging atmospheric Cherenkov telescopes to search for pulsed emission from Fermi pulsars not yet detected from the ground.
- Because the significance is 4.74σ, roughly doubling the exposure would be a direct test of whether the excess remains stable and whether the spectrum extends to ~100 GeV.
Signed reviews
Editorial analysis
A structured set of objections, weighed in public.
Referee Report
Summary. This paper reports on a search for pulsed gamma-ray emission from PSR B1706-44 using 28.3 hours of H.E.S.S. II CT5 monoscopic observations. After defining ON and OFF phase intervals from a Fermi-LAT phasogram above 15 GeV, the authors find 1,532,177 ON-phase events versus 3,050,011 OFF-phase events, corresponding to an excess of 7,171.5 ± 1,515 events and a Li&Ma significance of 4.74σ. An independent pipeline yields a compatible significance of 4.6σ. A forward-folding power-law fit to the CT5 data gives Γ_HESS = 3.76 ± 0.36 and a normalization of (4.3 ± 0.9)×10^-8 TeV^-1 cm^-2 s^-1 at 20 GeV, consistent with the Fermi-LAT spectrum above 10 GeV (Γ_LAT = 3.9 ± 0.1). The abstract claims a significant signal of ~1000 events at ~70 GeV, while the text reports a 2.5σ excess of 2,782 events in the 54–225 GeV bin. The paper concludes that this is the fourth ground-based detection of a pulsar, after the Crab, Vela and Geminga.
Significance. If the detection is confirmed, this would be the fourth pulsar detected from the ground and would extend the measured pulsed spectrum of PSR B1706-44 to the tens-of-GeV range, providing a new data point for pulsar emission models. The paper's main strengths are the use of an externally defined phase template from Fermi-LAT, an independent analysis pipeline cross-check, and the consistency of the measured spectral index with Fermi-LAT. The authors also transparently note the inability to constrain spectral curvature. However, the central advertised claim of a significant ~70 GeV signal is not supported by the reported 2.5σ excess in that energy bin.
major comments (2)
- [Abstract and §3.2] The abstract states that 'a significant signal of ~1000 events is detected at energies ~70 GeV', but §3.2 reports that the 54–225 GeV bin has an excess of 2,782 events at a significance of only 2.5σ, and the abstract itself says it is 'not possible to either confirm or rule out a power-law behaviour'. These statements are in conflict. Since the 'sub-100 GeV' claim in the title and abstract rests on this bin, the authors should either provide a trials-corrected significance for the 54–225 GeV bin or remove the word 'significant' and qualify the ~70 GeV detection as marginal. The number of excess events should also be reconciled: the reported 2,782 is not '~1000'.
- [§3.1] The ON and OFF phase intervals are chosen using the Fermi-LAT phasogram from the same pulsar, and the KDE template used in the maximum-likelihood test is also derived from Fermi-LAT data. Although these are external data, the paper should state explicitly whether any trials were performed in selecting the intervals [0.25–0.55] and [0.6–0.2] or the KDE variance (0.025). Without this statement, the quoted 4.74σ and 4.6σ significances do not account for any possible selection effects. The cross-check with the alternative pipeline mitigates this concern, but a sentence quantifying the trials would make the detection claim robust.
minor comments (4)
- [§3.1] The phase interval [0.6-0.2] is shorthand for the union [0.6,1.0] and [0.0,0.2]; please write this explicitly to avoid confusion.
- [§3.2] The exponent in the parabola model is ambiguous: 'dN(E)/dE = Φ0 (E/E0)−ΓLPB−β ln(E/E0)' should be written as Φ0 (E/E0)^{-Γ_LPB - β ln(E/E0)}.
- [Abstract and §3.2] The average energy of the highest bin is given as 62.7 GeV in §3.2, not ~70 GeV; harmonize the numbers between the abstract and the text.
- [§4] The summary contains a typographical spacing issue in 'index ∼ −3.8 to 3 .9'; it should read '−3.8 to −3.9'.
Circularity Check
No significant circularity: the H.E.S.S. detection is a self-contained ON/OFF counting measurement with Fermi-LAT used as an external template, not as an input fitted to produce the result.
full rationale
The paper's central claim, a 4.74σ Li&Ma detection of pulsations, is obtained by counting 1,532,177 events in the ON-phase interval against 3,050,011 events in the OFF-phase interval, giving a 7171.5 ± 1515 excess. This significance does not depend on any parameter fitted from the H.E.S.S. data; the ON/OFF intervals are defined using the Fermi-LAT phasogram, but that is an external measurement of the same pulsar, not an output of the H.E.S.S. analysis. The maximum-likelihood ratio test using the Fermi-LAT KDE template is presented as a compatible cross-check (4.6σ), not as the primary detection. The spectral index ΓHESS = 3.76 ± 0.36 is a forward-folding fit to the H.E.S.S. data alone, and the comparison to the Fermi-LAT index 3.9 ± 0.1 is an external benchmark, not a fitted input called a prediction. The estimation of the 62.7 GeV mean energy of the highest bin uses a simulated spectrum with Fermi-LAT parameters, but this is an energy-bias correction with stated assumptions and does not determine the detection significance or the fitted spectral index. Self-citations to the Vela CT5 pipeline [12] and to the forward-folding method [20] are methodological references to previously validated tools, not load-bearing uniqueness claims. No step in the derivation reduces by definition to its input; the claimed detection and spectrum have independent content.
Assumptions & free parameters
free parameters (4)
- H.E.S.S. pulsed spectrum power-law index =
3.76 ± 0.36 (stat)
- H.E.S.S. spectrum normalization at 20 GeV =
(4.3 ± 0.9) × 10^-8 TeV^-1 cm^-2 s^-1
- Fermi-LAT power-law index above 10 GeV =
3.9 ± 0.1
- KDE variance for Fermi-LAT phase template =
0.025
assumptions (4)
- domain assumption The Fermi-LAT phasogram above 15 GeV correctly represents the pulse profile of PSR B1706-44 at H.E.S.S. energies.
- domain assumption The OFF-phase interval contains only background, with no pulsed emission.
- domain assumption The instrument response functions from Monte Carlo simulations accurately model the CT5 monoscopic response at energies around 20 to 100 GeV.
- domain assumption The Tempo2 ephemeris from LAT timing and Parkes radio data is accurate over the 2013-2015 observation period.
Cite this review
Pith. "Pith review of Detection of sub-100 GeV gamma-ray pulsations from PSR B1706-44 with H.E.S.S." pith.science (2026). https://pith.science/paper/ZVYNFYNC
@misc{pith2026190806464,
  author       = {Pith},
  title        = {Pith review of: Detection of sub-100 GeV gamma-ray pulsations from PSR B1706-44 with H.E.S.S},
  year         = {2026},
  howpublished = {\url{https://pith.science/paper/ZVYNFYNC}},
  note         = {Machine review of arXiv:1908.06464}
}
read the original abstract
We report on the detection of pulsations from PSR B1706-44 based on 28.3 hours of observations with the H.E.S.S. II array with CT5 in monoscopic mode. The lightcurve is similar to that obtained with the Fermi-LAT above 15 GeV and the pulsations exhibit a steep spectrum with index ~ -3.8 in the sub 20 GeV to sub-100 GeV energy range. While a significant signal of ~ 1000 events is detected at energies ~ 70 GeV, it is not possible to either confirm or rule out a power-law behaviour of PSR B1706-44 spectrum in this range.
Figures

Reference graph
Works this paper leans on
-
[1]
A., Ajello, M., Allafort, A., et al
Abdo, A. A., Ajello, M., Allafort, A., et al. 2013, ApJS, 208, 17
2013
-
[2]
A., Ajello, M., Antolini, E., et al
Abdo, A. A., Ajello, M., Antolini, E., et al. 2010, ApJ, 720, 26
work page 2010
-
[3]
Abdollahi, S., Ackermann, M., Ajello, M., et al. 2017, Phys. Rev. D, 95, 082007
work page 2017
-
[4]
2015, ApJS, 218, 23
Acero, F., Ackermann, M., Ajello, M., et al. 2015, ApJS, 218, 23
2015
-
[5]
Aleksi ´c, J., Alvarez, E. A., Antonelli, L. A., et al. 2011, ApJ, 742, 43
work page 2011
-
[6]
Ansoldi, S., Antonelli, L. A., Antoranz, P., et al. 2016, A&A, 585, A133 5 Detection of PSR B1706 −44 with H.E.S.S. M. Spir-Jacob
work page 2016
-
[7]
2017, in American Institute of Physics Conference Series, V ol
Djannati-Ataï, A., Giavitto, G., Holler, M., et al. 2017, in American Institute of Physics Conference Series, V ol. 1792, 6th International Symposium on High Energy Gamma-Ray Astronomy, 040028
work page 2017
-
[8]
P., Srinivasan, R., Saito, Y ., et al
Finley, J. P., Srinivasan, R., Saito, Y ., et al. 1998, ApJ, 493, 884
work page 1998
Show all 26 references
-
[9]
A., Goss, W
Frail, D. A., Goss, W. M., & Whiteoak, J. B. Z. 1994, ApJ, 437, 781
1994
-
[10]
B., Frail, D
Giacani, E. B., Frail, D. A., Goss, W. M., & Vieytes, M. 2001, AJ, 121, 3133
2001
-
[11]
V ., Halpern, J
Gotthelf, E. V ., Halpern, J. P., & Dodson, R. 2002, ApJ, 567, L125
2002
-
[12]
H. E. S. S. Collaboration, Abdalla, H., Aharonian, F., et al. 2018, A&A, 620, A66
2018
-
[13]
H. E. S. S. Collaboration, Abramowski, A., Acero, F., et al. 2011, A&A, 528, A143
2011
-
[14]
B., Edwards, R
Hobbs, G. B., Edwards, R. T., & Manchester, R. N. 2006, MNRAS, 369, 655
2006
-
[15]
G., Manchester, R
Johnston, S., Lyne, A. G., Manchester, R. N., et al. 1992, MNRAS, 255, 401
1992
-
[16]
2015, Astrophys
Kerr, M., Ray, P., Johnston, S., Shannon, R., & Camilo, F. 2015, Astrophys. J., 814, 128
2015
-
[17]
Li, T. P. & Ma, Y . Q. 1983, ApJ, 272, 317
1983
-
[18]
2019, in International Cosmic Ray Conference, V ol
López Moya, M. 2019, in International Cosmic Ray Conference, V ol. 36, 36th International Cosmic Ray Conference (ICRC2019), 728
2019
-
[19]
2015, in Proc
Murach, T., Gadjus, M., & Parsons, R. 2015, in Proc. 34th Intern. Cosmic Ray Conf. No. 1022
2015
-
[20]
2001, A&A, 374, 895
Piron, F., Djannati-Atai, A., Punch, M., et al. 2001, A&A, 374, 895
2001
-
[21]
W., et al
Pittori, C., Verrecchia, F., Chen, A. W., et al. 2009, A&A, 506, 1563
2009
-
[22]
S., Kerr, M., Parent, D., et al
Ray, P. S., Kerr, M., Parent, D., et al. 2011, The Astrophysical Journal Supplement Series, 194, 17
2011
-
[23]
N., Bennett, K., Bignami, G
Swanenburg, B. N., Bennett, K., Bignami, G. F., et al. 1981, ApJ, 243, L69
1981
-
[24]
J., Arzoumanian, Z., Bertsch, D
Thompson, D. J., Arzoumanian, Z., Bertsch, D. L., et al. 1993, Nature, 365, 188
1993
-
[25]
2011, Science, 334, 69
VERITAS Collaboration, Aliu, E., Arlen, T., et al. 2011, Science, 334, 69
2011
-
[26]
N., et al
Weltevrede, P., Johnston, S., Manchester, R. N., et al. 2010, PASA, 27, 64 6
2010
Reviewed August 14, 2026 · model on record in the stance chip above.
Discussion (0). Continue with ORCID to comment.