REVIEW 3 major objections 5 minor 48 references
Tidal-locking-induced stellar rotation dichotomy in the open cluster NGC 2287?
T0 review · 3 major / 5 minor · reviewed 2026-08-14 · deepseek-v4-flash
Pith's one-line read Rotation, not age, splits NGC 2287's main sequence in two.
desk verdict A careful v sin i measurement that supports rotation as the driver of NGC 2287's split main sequence, but the claimed dichotomy relies on excluding three unconfirmed binaries and the abstract overstates the case. read the letter →
The pith
A machine-rendered reading of the paper's core claim, the machinery that carries it, and where it could break.
The reading
What carries the argument
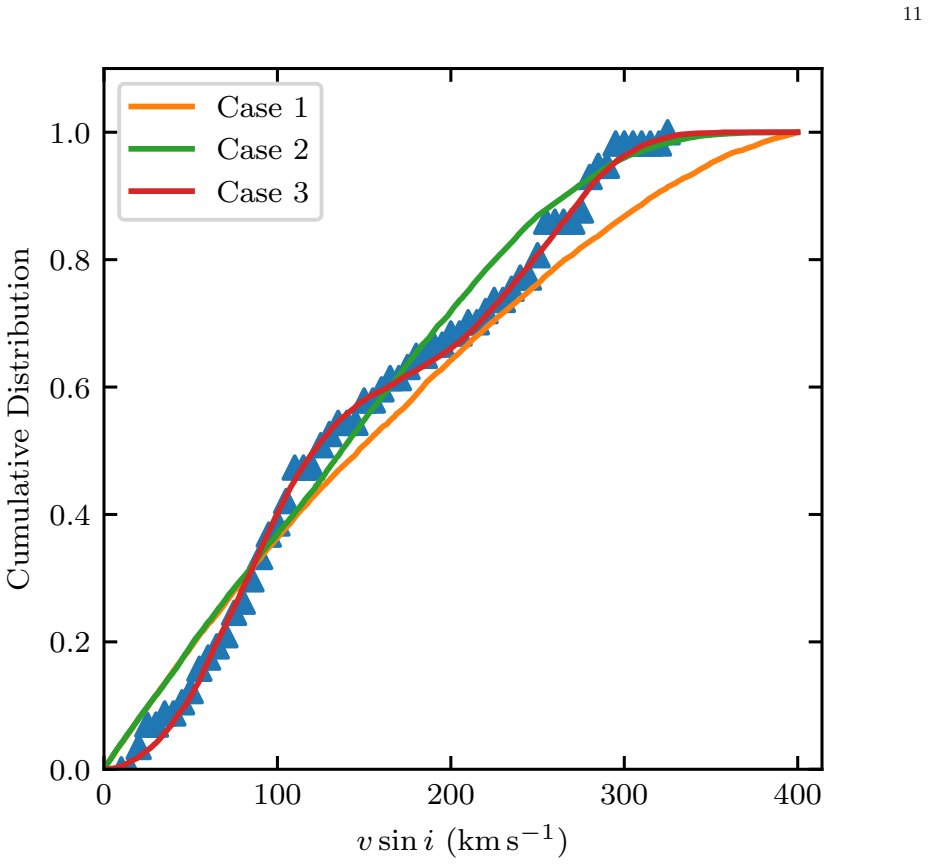
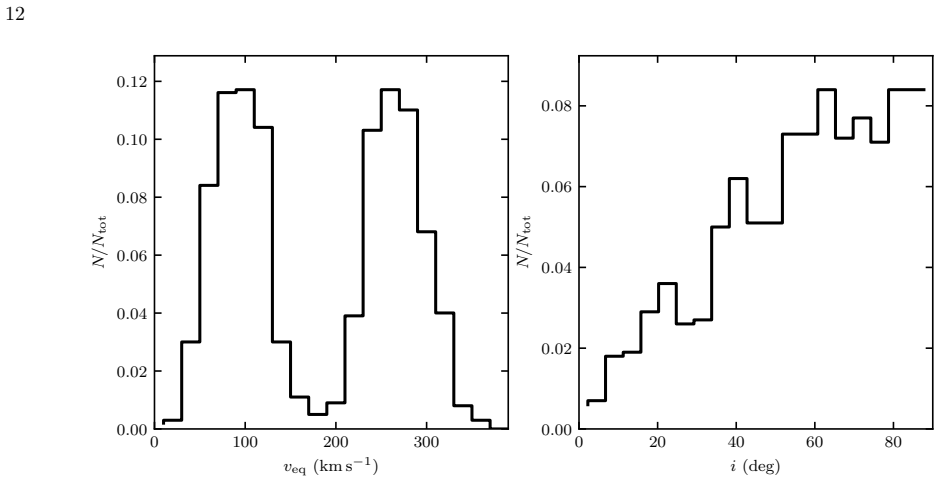
The central machinery pairs measurements of projected rotational velocities $v\sin i$ from synthetic-spectrum fits to the Mg I triplet with a three-case forward model that separates inclination effects from the underlying equatorial velocity distribution. The decisive test is Case 3: a bimodal $v_{\rm eq}$ distribution with uniformly random inclinations, which fits the observed cumulative $v\sin i$ distribution far better than a uniform rotation distribution (Case 1) or a spin-aligned distribution (Case 2). The tidal-locking interpretation leans on the synchronization timescale formula of Hurley et al. (2002) with the Zahn (1975) tidal coefficient $E_2$, which shows that close binaries with $a\lesssim 7\,R_\odot$ synchronize in a few million years, well below the cluster age.
What would settle it
Time-domain photometry of the four slow-rotating red main-sequence stars: if the three without confirmed companions show no eclipses or radial-velocity variations over several nights, they are likely single low-inclination stars, weakening the claimed dichotomy. Independently, a search for short-period, low-mass-ratio binaries in NGC 2287 that finds far fewer than the tidal-locking scenario requires would falsify the braking origin.
Extended reading notes
Core claim
The paper's central claim is that the double main sequence in NGC 2287 is a rotation effect, not an age effect or differential reddening. Using high-resolution spectra of 53 bright members, the authors measure projected rotational velocities from the Mg I triplet and find that blue main-sequence stars have a mean $\langle v\sin i\rangle = 111 \pm 13$ km/s while red main-sequence stars (excluding four probable binaries) average $255 \pm 10$ km/s. A forward model that allows a bimodal distribution of true equatorial velocities $v_{\rm eq}$ with uniformly random inclinations reproduces the data (K-S test $p=0.99$) with peaks at $v_s = 100$ km/s and $v_r = 280$ km/s and a 1:1 number ratio; uniform-velocity or spin-aligned models fail. The interpretation is that the slow rotators were born fast and were tidally locked by short-period, low-mass-ratio companions, since the synchronization timescale for a $2\,M_\odot$ primary with separation $a \lesssim 7\,R_\odot$ is short compared with the cluster age. This is presented as the first evidence for a dichotomous true-rotation-velocity distribution in a star cluster.
Load-bearing premise
The clean separation between fast and slow rotators rests on treating four slow-rotating red main-sequence stars as unresolved binaries; if even one of the three unconfirmed cases is a single star viewed at low inclination, the velocity gap between the two sequences shrinks.
Editorial extensions
If this is right
- Split main sequences seen in young clusters in the Magellanic Clouds and the Milky Way are rotation-driven; apparent age spreads inferred from extended main-sequence turn-offs may be artifacts of rotation.
- Rotational-velocity distributions in clusters can be genuinely bimodal, with a fast population near a few hundred km/s and a slow population near 100 km/s, in roughly equal numbers in NGC 2287.
- Tidal locking in short-period, low-mass-ratio binaries is an efficient braking mechanism that can create a slow-rotating population within about 10% of a cluster's age.
- The scenario implies that NGC 2287 should host a large population of short-period binaries with low-mass companions; time-domain observations of the blue main-sequence stars can test this directly.
Reading between the lines
- If the slow rotators are tidally locked binaries, their spin axes should be aligned with their orbital axes; measuring spin-orbit alignment in NGC 2287 could independently confirm or refute the braking mechanism.
- The 1:1 ratio of fast to slow rotators may be a fingerprint of the cluster's binary fraction and period distribution, so comparing young clusters with different binary fractions could predict which ones display split main sequences.
- The assumption that three low-$v\sin i$ red-sequence stars are unresolved binaries is testable with time-domain photometry; if any of them is single, the clean velocity gap between the two sequences would narrow, though the bimodal fit to the full sample might survive.
- The bimodal peaks at 100 and 280 km/s may evolve with cluster age if tidal braking continues or if rotational mixing changes surface velocities, so older clusters could show a different gap or a merged distribution.
Signed reviews
Editorial analysis
A structured set of objections, weighed in public.
Referee Report
Summary. The paper reports projected rotational velocities (v sin i) for 53 bright member stars in the young open cluster NGC 2287, measured from archival FLAMES/GIRAFFE spectra by fitting synthetic Mg I triplet profiles. The authors find that the blue and red main sequences defined in the Gaia CMD are populated by slow and fast rotators, with mean projected velocities of about 111 and 255 km/s after excluding four slow-rotating rMS stars as presumed binaries. Forward modeling of the v sin i distribution rejects uniform rotation and a spin-aligned configuration and favors, in Case 3, a bimodal equatorial-velocity distribution with peaks near 100 and 280 km/s and a number ratio nr/ns = 1. The paper interprets the slow rotators as initially rapid rotators that were tidally locked by low-mass-ratio binary companions and concludes that stellar rotation drives the split main sequence.
Significance. If correct, this would be one of the first direct spectroscopic demonstrations that a split main sequence in a Galactic open cluster corresponds to a dichotomous rotation distribution, materially strengthening the rotation-based interpretation of split MSs and providing a concrete testbed for tidal-locking models. The v sin i measurements are described carefully, with uncertainties calibrated through mock spectra; the Gaia DR2 membership selection and pseudo-color construction are appropriate; and the tidal-locking timescale calculation yields an explicit, falsifiable prediction. The main caveats are the small sample (33 split-MS stars), the unconfirmed binary nature of three slow rMS stars, and the model-dependence of the bimodal veq inference. The CMD-position versus v sin i correlation itself is independent evidence and not circular, but the derived bimodal veq distribution is partly assumption-driven.
major comments (3)
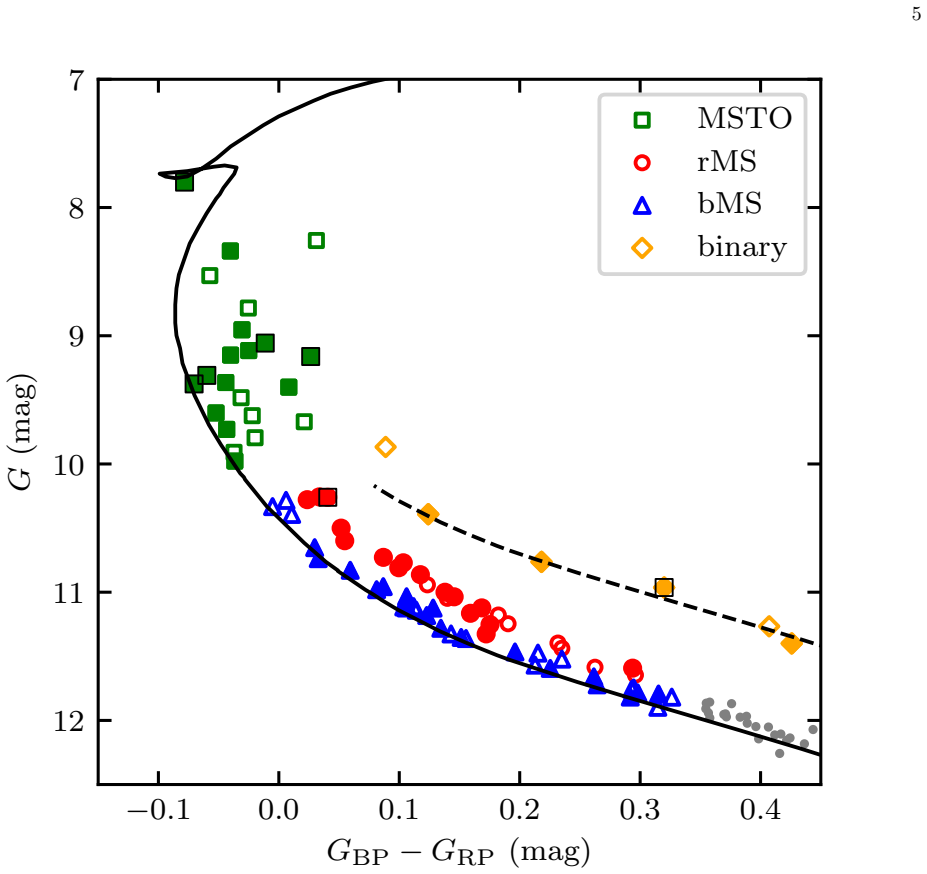
- [§3, Figure 5 and Table 1] The central dichotomy claim rests on excising four slow-rotating rMS stars from the rMS sample. Only Gaia ID 2927008980887462400 is a confirmed double-lined spectroscopic binary; the other three (2926994824683234944, 2926916175231589888, 2927008431139550080) are assumed to be binaries without time-domain photometry, as the text acknowledges. If any of these are single stars viewed at low inclination, the bMS/rMS velocity separation weakens and the Case 3 fit parameters (vs, vr, nr/ns) will shift. Please present the analysis with these three stars included, and either confirm their binarity with time-series photometry or explicitly reframe the headline conclusion as conditional on the binary assumption.
- [§4, Case 3 and Figure 6] The claim of a dichotomous true equatorial-velocity distribution is the output of a maximum-p search over a grid of free parameters (vs, vr, velocity dispersion, nr/ns, maximum veq), and the reported p = 0.99 is the best median p over that grid. This is an in-sample model-selection procedure, so the p-value is not a valid significance level for the bimodal model against the unimodal alternatives. A calibrated comparison (for example, a likelihood-ratio test with a null distribution obtained from simulations, or a posterior-predictive check) is needed before the word 'dichotomous' can be asserted as an empirical result.
- [§3, Spearman coefficient] The Spearman correlation of 0.68 between pseudo-color and v sin i is computed for the bMS and rMS samples after the four slow rMS stars have been excluded. Those are precisely the stars that bridge the two velocity groups, so the correlation may be inflated by the selection. Please report the correlation and p-value for the full split-MS sample, and for the sample with the confirmed binary removed but the three unconfirmed stars retained, so the reader can judge how much of the claimed correlation depends on the binary assumption.
minor comments (5)
- [§3, mean rMS velocity] The mean rMS velocity is labeled '⟨v sin i⟩bMS = 255 ± 10 km/s'; this should be ⟨v sin i⟩rMS.
- [§2.1, parallax selection] The parallax selection interval is written '1.2215 mas yr−1 ≤ ϖ ≤ 1.5060 mas yr−1'; the units should be mas, not mas yr−1, since ϖ is a parallax.
- [§2.3 and Abstract] The isochrone fitting adopts a best age of 150 Myr, while the abstract describes the cluster as roughly 200 Myr old; please clarify which age is used for the rotation models and whether the 150–350 Myr isochrone range is meant to bracket the split MS rather than the cluster age.
- [§4, first evidence claim] The sentence 'This represents the first evidence in support of a dichotomous distribution of real rotational velocities in star clusters' is too strong given the prior field-star bimodality results of Royer et al. (2007) and Zorec & Royer (2012); suggest wording such as 'first direct evidence in a split-MS open-cluster context'.
- [§4, Figure 8] The tidal-locking discussion would benefit from stating explicitly that the synchronization timescale estimate assumes a 2 M⊙, 2 R⊙ primary and a radiative envelope, and from noting how the result changes for the mass range at the faint end of the split MS.
Circularity Check
No significant circularity: the v sin i measurements and the CMD-based classification are independent, and the bimodal veq claim is a model-comparison result rather than an input assumption.
full rationale
The paper's central observational claim is a direct correlation between CMD position (bMS/rMS classification based on Gaia photometry) and projected rotational velocity (v sin i measured from FLAMES/GIRAFFE spectra). These two measurements are independent: classification is based on locus in the color-magnitude diagram, and v sin i is derived from spectral line broadening. The conclusion of a dichotomous equatorial-velocity distribution comes from a forward-model comparison: Case 3 explicitly assumes a bimodal veq distribution, but it is tested against Case 1 (uniform veq and i) and Case 2 (uniform veq with aligned i) using two-sample Kolmogorov-Smirnov tests; the KS test rejects the unimodal cases, so the dichotomy is not forced by definition. The peak velocities (vs = 100 km/s, vr = 280 km/s) and number ratio are free parameters of the fit, not prior inputs. The exclusion of four slow-rotating rMS stars is presented as an assumption about unresolved binarity, with one confirmed double-lined system and three requiring time-domain photometry; this is an acknowledged data-selection limitation, not a circular step, because the bMS/rMS classification was not defined using v sin i. Self-citations (Sun et al. 2019, Li et al. 2013) are used as contextual or modeling references and do not carry the derivation; the tidal-locking scenario is tested with an independent synchronization-timescale calculation (Hurley et al. 2002). No equation or fitted parameter is renamed as a prediction, and no load-bearing step reduces to its own input by construction.
Assumptions & free parameters
free parameters (5)
- vs (slow rotator peak veq) =
100 km/s
- vr (fast rotator peak veq) =
280 km/s
- velocity dispersion =
30 km/s
- number ratio nr/ns =
1
- maximum veq =
414 km/s
assumptions (6)
- domain assumption PARSEC isochrones with Z=0.0152 and AV=0.217 mag describe the cluster's single-star population.
- domain assumption SYCLIST rotating models with omega=0.8 omega_crit reproduce the CMD of the rMS.
- domain assumption The Mg I triplet line formation is adequately modeled by ATLAS12/SYNSPEC in LTE.
- domain assumption The Hurley et al. (2002) synchronization timescale formula applies to these stars.
- domain assumption The E2 tidal coefficient from Zahn (1975) is valid.
- domain assumption The cluster is a single-age population with negligible differential extinction.
Cite this review
Pith. "Pith review of Tidal-locking-induced stellar rotation dichotomy in the open cluster NGC 2287?." pith.science (2026). https://pith.science/paper/FCUHT4FU
@misc{pith2026190806530,
  author       = {Pith},
  title        = {Pith review of: Tidal-locking-induced stellar rotation dichotomy in the open cluster NGC 2287?},
  year         = {2026},
  howpublished = {\url{https://pith.science/paper/FCUHT4FU}},
  note         = {Machine review of arXiv:1908.06530}
}
abstract
Stars spend most of their lifetimes on the `main sequence' (MS) in the Hertzsprung--Russell diagram. The obvious double MSs seen in the equivalent color--magnitude diagrams characteristic of Milky Way open clusters pose a fundamental challenge to our traditional understanding of star clusters as `single stellar populations.' The clear MS bifurcation of early-type stars with masses greater than $\sim1.6 M_\odot$ is thought to result from a range in the stellar rotation rates. However, direct evidence connecting double MSs to stellar rotation properties has yet to emerge. Here, we show through analysis of the projected stellar rotational velocities ($v\sin i$, where $i$ represents the star's inclination angle) that the well-separated double MS in the young, $\sim200Myr$-old Milky Way open cluster NGC 2287 is tightly correlated with a dichotomous distribution of stellar rotation rates. We discuss whether our observations may reflect the effects of tidal locking affecting a fraction of the cluster's member stars in stellar binary systems. We show that the slow rotators could potentially be initially rapidly rotating stars that have been slowed down by tidal locking by a low mass-ratio companion in a cluster containing a large fraction of short-period, low-mass-ratio binaries. This demonstrates that stellar rotation drives the split MSs in young, $\lessapprox 300$Myr-old star clusters. However, special conditions, e.g., as regards the mass-ratio distribution, might be required for this scenario to hold.
Figures


Figures from the paper (5 more)



Reference graph
Works this paper leans on
-
[1]
2018, A&A, 616, A8 Astropy Collaboration, Robitaille,T
Andrae, R., Fouesneau, M., Creevey, O., et al. 2018, A&A, 616, A8 Astropy Collaboration, Robitaille,T. P., Tollerud, E. J., et al. 2013, A&A, 558, A33
work page 2018
-
[2]
2017, MNRAS, 465, 4795
Bastian, N., Cabrera-Ziri, I., Niederhofer, F., et al. 2017, MNRAS, 465, 4795
2017
-
[3]
Bastian, N., Kamann, S., Cabrera-Ziri, I., et al. 2018, MNRAS, 480, 3739
work page 2018
- [4]
-
[5]
2012, MNRAS, 427, 127
Bressan, A., Marigo, P., Girardi, L., et al. 2012, MNRAS, 427, 127
2012
-
[6]
A., Clayton, G
Cardelli, J. A., Clayton, G. C., & Mathis, J. S. 1989, ApJ, 345, 245
1989
-
[7]
2000, A&A, 359, 289
Claret, A. 2000, A&A, 359, 289
2000
-
[8]
P., Marino, A
Cordoni, G., Milone, A. P., Marino, A. F., et al. 2018, ApJ, 869, 139
2018
Show all 48 references
-
[9]
2017, MNRAS, 467, 3628
Correnti, M., Goudfrooij, P., Bellini, A., et al. 2017, MNRAS, 467, 3628
2017
-
[10]
A., et al
Corsaro, E., Lee, Y.-N., Garc´ ıa, R. A., et al. 2017, Nat. Astron., 1, 64 D’Antona, F., Di Criscienzo, M., Decressin, T., et al. 2015, MNRAS, 453, 2637 D’Antona, F., Milone, A. P., Tailo, M., et al. 2017, Nat. Astron., 1, 186 de Mink, S. E., Langer, N., Izzard, R. G., et al. ...
2017
-
[11]
K., Dotter, A., Johnson, C
Dupree, A. K., Dotter, A., Johnson, C. I., et al. 2017, ApJL, 846, L1
2017
-
[12]
2010, A&A, 509, A72 Espinosa Lara, F., & Rieutord, M
Eggenberger, P., Miglio, A., Montalban, J., et al. 2010, A&A, 509, A72 Espinosa Lara, F., & Rieutord, M. 2011, A&A, 533, A43 Gaia Collaboration, Brown, A. G. A., Vallenari, A., et al. 2016, A&A, 595, A2 Gaia Collaboration, Brown, A. G. A., Vallenari, A., et al. 2018, A&A, 616, A1
2010
-
[13]
2013, A&A, 553, A24
Georgy, C., Ekstr¨ om, S., Granada, A., et al. 2013, A&A, 553, A24
2013
-
[14]
2014, A&A, 566, A21
Georgy, C., Granada, A., Ekstr¨ om, S., et al. 2014, A&A, 566, A21
2014
-
[15]
2011, MNRAS, 412, L103
Girardi, L., Eggenberger, P., & Miglio, A. 2011, MNRAS, 412, L103
2011
-
[16]
H., Kozhurina-Platais, V., et al
Goudfrooij, P., Puzia, T. H., Kozhurina-Platais, V., et al. 2011, ApJ, 737, 3
2011
-
[17]
Huang, W., & Gies, D. R. 2006, ApJ, 648, 580
2006
-
[18]
R., & McSwain, M
Huang, W., Gies, D. R., & McSwain, M. V. 2010, ApJ, 722, 605
2010
-
[19]
1992, A&A, 262, 501
Hubeny, I., & Lanz, T. 1992, A&A, 262, 501
1992
-
[20]
Hunter, J. D. 2007, Comput. Sci. Eng., 9, 90
2007
-
[21]
R., Tout, C
Hurley, J. R., Tout, C. A., & Pols, O. R. 2002, MNRAS, 329, 897
2002
-
[22]
J., Deliyannis, C
Jackson, R. J., Deliyannis, C. P., & Jeffries, R. D. 2018, MNRAS, 476, 3245
2018
-
[23]
J., & Jeffries, R
Jackson, R. J., & Jeffries, R. D. 2010, MNRAS, 402, 1380
2010
-
[24]
2018, MNRAS, 479, 391
Kamiaka, S., Benomar, O., & Suto, Y. 2018, MNRAS, 479, 391
2018
-
[25]
V., Piskunov, A
Kharchenko, N. V., Piskunov, A. E., R¨ oser, S., et al. 2005, A&A, 438, 1163
2005
-
[26]
Kurucz, R. L. 2005, Mem. Soc. Astron. It. Suppl., 8, 189
2005
-
[27]
2013, MNRAS, 436, 1497
Li, C., de Grijs, R., & Deng, L. 2013, MNRAS, 436, 1497
2013
-
[28]
2014, Nature, 516, 367
Li, C., de Grijs, R., & Deng, L. 2014, Nature, 516, 367
2014
-
[29]
2017, ApJ, 844, 119
Li, C., de Grijs, R., Deng, L., et al. 2017, ApJ, 844, 119
2017
-
[30]
2019, Nat
Lim, B., Rauw, G., Naz´ e, Y., et al. 2019, Nat. Astron., 3, 76
2019
-
[31]
D., Broby Nielsen, P., Ferguson, A
Mackey, A. D., Broby Nielsen, P., Ferguson, A. M. N., et al. 2008, ApJL, 681, L17
2008
-
[32]
P., Bedin, L
Milone, A. P., Bedin, L. R., Cassisi, S., et al. 2013, A&A, 555, A143
2013
-
[33]
P., Bedin, L
Milone, A. P., Bedin, L. R., Piotto, G., et al. 2009, A&A, 497, 755
2009
-
[34]
P., Bedin, L
Milone, A. P., Bedin, L. R., Piotto, G., et al. 2015, MNRAS, 450, 3750
2015
-
[35]
P., Marino, A
Milone, A. P., Marino, A. F., D’Antona, F., et al. 2016, MNRAS, 458, 4368
2016
-
[36]
P., Marino, A
Milone, A. P., Marino, A. F., D’Antona, F., et al. 2017, MNRAS, 465, 4363
2017
-
[37]
P., Marino, A
Milone, A. P., Marino, A. F., Di Criscienzo, M., et al. 2018, MNRAS, 477, 2640 15
2018
-
[38]
2017, ApJS, 230, 15
Moe, M., & Di Stefano, R. 2017, ApJS, 230, 15
2017
-
[39]
2018, A&A, 618, A109
Mosser, B., Gehan, C., Belkacem, K., et al. 2018, A&A, 618, A109
2018
-
[40]
2015, MNRAS, 453, 2070 O’Donnell, J
Niederhofer, F., Georgy, C., Bastian, N., et al. 2015, MNRAS, 453, 2070 O’Donnell, J. E. 1994, ApJ, 422, 158
2015
-
[41]
2010, A&A, 516, A13
Palacios, A., Gebran, M., Josselin, E., et al. 2010, A&A, 516, A13
2010
-
[42]
2002, Msngr, 110, 1
Pasquini, L., Avila, G., Blecha, A., et al. 2002, Msngr, 110, 1
2002
-
[43]
N., et al
Platais, I., Melo, C., Quinn, S. N., et al. 2012, ApJL, 751, L8
2012
-
[44]
C., & Martayan, C
Rivinius, T., Carciofi, A. C., & Martayan, C. 2013, A&A Rv, 21, 69
2013
-
[45]
Royer, F., Zorec, J., & G´ omez, A. E. 2007, A&A, 463, 671
2007
-
[46]
2019, ApJ, 876, 113 von Zeipel, H
Sun, W., de Grijs, R., Deng, L., et al. 2019, ApJ, 876, 113 von Zeipel, H. 1924, MNRAS, 84, 665
2019
-
[47]
1975, A&A, 41, 329
Zahn, J.-P. 1975, A&A, 41, 329
1975
-
[48]
2012, A&A, 537, A120
Zorec, J., & Royer, F. 2012, A&A, 537, A120
2012
Reviewed August 14, 2026 · model on record in the stance chip above.
Discussion (0). Continue with ORCID to comment.