REVIEW 3 major objections 6 minor 48 references
Bayesian models for survival data of clinical trials: Comparison of implementations using R software
T0 review · 3 major / 6 minor · reviewed 2026-08-14 · deepseek-v4-flash
Pith's one-line read This paper shows that Bayesian survival models in R, despite very different baseline-hazard priors and samplers, give hazard-ratio estimates close to the Cox maximum-likelihood value, plus probabilities the frequentist approach lacks.
desk verdict Useful practical map of Bayesian survival PH packages in R, but the 'close agreement' headline is under-supported by a single mock dataset and two unexplained outlier methods. read the letter →
The pith
A machine-rendered reading of the paper's core claim, the machinery that carries it, and where it could break.
The reading
What carries the argument
The load-bearing object is the Cox proportional-hazards model $H(t \mid Z_i) = \exp(Z_i'\beta)\,H_0(t)$, with the treatment effect $\beta = \log(\mathrm{HR})$ as the parameter of interest and the baseline hazard $H_0$ (equivalently $S_0$ or $h_0$) left to be specified. The comparison is carried by how each implementation parameterizes $H_0$: fully parametric (exponential or Weibull), piecewise exponential with a time partition, or nonparametric through transformed Bernstein polynomial priors, mixtures of Polya trees, or splines on the log-hazard — always paired with a normal prior on $\beta$ whose variance ranges from 1 to $10^{10}$. For the partial Bayesian approach the machinery is instead a conjugate normal update, $\beta \mid y \sim N\big((\mu\sigma^2 + y\sigma_0^2)/(\sigma^2 + \sigma_0^2),\, \sigma^2\sigma_0^2/(\sigma^2 + \sigma_0^2)\big)$, which requires no sampling. Estimation otherwise proceeds by MCMC (JAGS or Stan) or by integrated nested Laplace approximation. The mechanism producing the paper's conclusion is that the likelihood dominates the prior on $\beta$: as long as that prior is flat or weakly informative, the posterior mean lands near the maximum-likelihood value no matter how the baseline hazard is modeled, and the one modeling choice that can genuinely move the estimate is the partition of the time axis in piecewise models.
What would settle it
Re-run the same set of R packages on trials with heavy censoring (around 70–80%), small event counts, or crossing survival curves that clearly violate the proportional-hazards assumption, and compare each posterior mean log hazard ratio with the Cox maximum-likelihood estimate. The paper's claim would be undercut if the inter-package spread widens materially beyond the range it reports (about 0.22 to 0.41, including the partition-shifted dynsurv estimate), or if a single default setting moves an estimate as much as dynsurv's time partition did (a shift of about 0.14 on the log scale).
Extended reading notes
Core claim
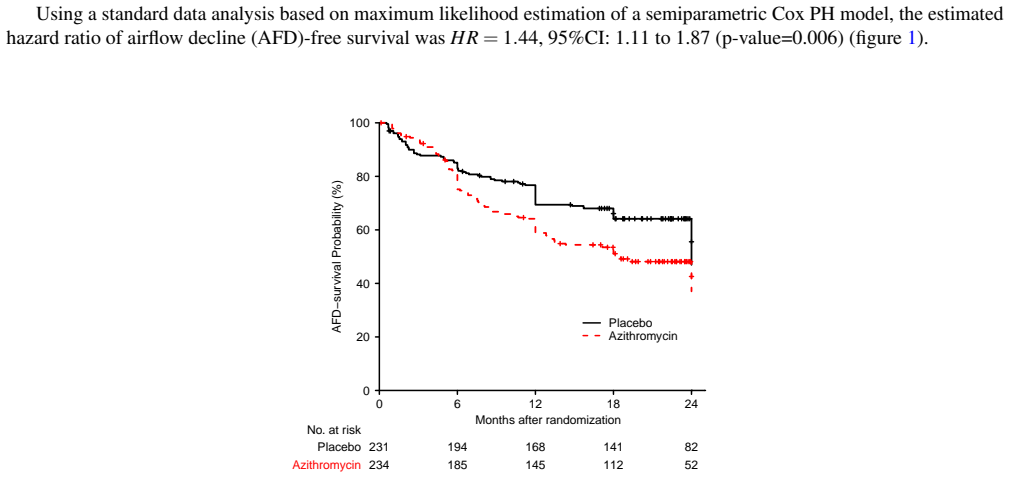
The paper's central claim, on its own terms, is that Bayesian proportional-hazards models for right-censored clinical-trial survival data can be implemented through various R packages, and these implementations — despite heterogeneity in the modeling of the baseline hazard, in the priors on the treatment effect, and in the estimation machinery — produce posterior mean estimates of the log hazard ratio that agree closely with the maximum-likelihood estimate of the semiparametric Cox model. On the ALLOZITHRO-derived example the frequentist estimate is $\log(\mathrm{HR}) = 0.366$, i.e. HR = 1.44 (95% CI 1.11 to 1.87). The parametric and piecewise-exponential implementations give posterior means between 0.345 and 0.362, the nonparametric-baseline implementations (transformed Bernstein polynomial or mixture of Polya trees priors) between 0.337 and 0.358, and the conjugate partial-Bayesian analysis between 0.332 and 0.351, corresponding to hazard ratios from 1.39 to 1.43. Three implementations fall outside that cluster: the dynsurv package's bayesCox function (0.260), rstanarm's M-spline model (0.289), and Murray et al.'s LRTP-spline model (0.223). The paper traces the dynsurv discrepancy to its default time partition built from observed failure times, and shows that re-parameterizing the partition to quantile-based or equally spaced intervals moves that estimate to about 0.40, toward the other methods. The authors conclude that Bayesian approaches can be used more routinely in survival trials, with the added value of probabilistic statements such as $\Pr(\mathrm{HR} > 1.5)$ that cannot be obtained from the frequentist analysis alone.
Load-bearing premise
The load-bearing premise, acknowledged by the authors in their Limitations paragraph ('results may be dependent on the dataset'), is that the single mock dataset resampled from the ALLOZITHRO trial represents typical right-censored trial data; if other censoring rates, event proportions, or departures from proportional hazards change how the packages behave, the close agreement between Bayesian and frequentist estimates may not transfer.
Editorial extensions
If this is right
- A clinical team performing a post hoc Bayesian reanalysis of a randomized trial with a survival endpoint can use almost any of the reviewed R packages and expect a posterior mean hazard ratio within a few percent of the Cox maximum-likelihood estimate on the hazard-ratio scale.
- Bayesian implementations add decision-relevant probabilistic statements — such as the posterior probability that the hazard ratio exceeds a threshold like 1.5 — that the frequentist analysis cannot supply, making their added value interpretive rather than a different point estimate.
- In piecewise-exponential models the time partition is the parameterization that matters: default partitions built from observed failure times can shift the estimate (dynsurv moved from 0.260 to about 0.40), while quantile-based or equally spaced partitions bring it into line with the other methods.
- The conjugate partial-Bayesian approach with skeptical and enthusiastic priors is a reliable and computation-free route to Bayesian estimates under proportional hazards, which supports its use as a simple default for trial reanalysis.
- If the agreement generalizes, Bayesian analysis of survival endpoints can become a standard complement to the primary frequentist analysis of confirmatory trials, converting a hazard-ratio estimate into directly usable probability statements for clinicians and policymakers.
Reading between the lines
- An implication the paper leaves implicit: its own Table 3 shows that the quantities that justify Bayesian analysis, posterior probabilities such as $\Pr(\mathrm{HR} > 1.5)$, vary much more across implementations (from about 0.08 to 0.38) than the hazard-ratio point estimates do, so the choice of package matters more for the probabilistic statements than for the effect estimate.
- Because the posterior mean was insensitive to prior variance from 1 up to $10^{10}$, the agreement plausibly extends to other weakly informative priors; it says nothing about informative priors that conflict with the data, which would be the natural test of where the agreement breaks.
- A testable extension is to run the same comparison on trials with non-proportional hazards or heavy censoring, since the paper's conclusion that implementation choice barely matters would be expected to fail exactly where the Cox model itself is a poor summary of the data.
Signed reviews
Editorial analysis
A structured set of objections, weighed in public.
Referee Report
Summary. The paper compares Bayesian implementations of proportional hazards survival models available in R, applied to a bootstrap-resampled mock dataset derived from the ALLOZITHRO trial (465 patients, 231 events, Cox log-HR estimate 0.366). The authors review partial-Bayesian conjugate analyses and fully Bayesian parametric, piecewise exponential, and nonparametric baseline models implemented in SemiCompRisks, INLA, survHE, rstanarm, dynsurv, spBayesSurv, and the Murray et al. (2016) spline function. They report posterior mean log-HR estimates mostly in the range 0.34 to 0.36, with exceptions for dynsurv's bayesCox (0.260), Murray et al.'s LRTP splines (0.223), and rstanarm M-splines (0.289), and they provide MCMC diagnostics and a sensitivity analysis with homogenized MCMC parameters. The paper concludes that Bayesian PH models in R provide results in close agreement with maximum likelihood estimates and enable probabilistic statements not otherwise available.
Significance. If the central claim holds, the paper provides useful practical guidance for clinical trialists who want to perform post hoc Bayesian analyses of survival endpoints. The implementation is careful in several respects: convergence diagnostics are reported for every MCMC run, a sensitivity analysis with optimized sampling parameters is included, and the package-by-package parameterization is documented in detail. The paper also honestly identifies the dataset dependence as a limitation. However, the evidence base is a single mock dataset, two of the implementations produce estimates that are not in close agreement, and the mechanisms behind those discrepancies are not explained. The useful comparative material is therefore accompanied by a generalizability claim that is currently under-supported.
major comments (3)
- [Section 3, Limitations] The central claim of close agreement between Bayesian implementations and the Cox MLE rests on a single bootstrap-resampled dataset derived from the ALLOZITHRO trial. The authors acknowledge in the Limitations that 'results may be dependent on the dataset,' but the abstract and conclusion state the agreement without that caveat. Since two of the implementations (dynsurv bayesCox and Murray et al. LRTP splines) already deviate substantially on this dataset, a simulation study varying event rates, censoring proportions, and the degree of PH violation, or a second real-data case study, is needed before the headline guidance can be considered generalizable. Without such evidence, the claim that Bayesian PH models 'providing results in close agreement with the maximum likelihood estimates' is too strong for the presented support.
- [Table 2 and Table 3] There is a direct inconsistency between the reported estimand and the package output. Table 2 states that SemiCompRisks' BayesSurv_HReg() 'reports posterior median estimates (not mean),' yet Table 3, Figure 2, and the abstract present all results under the heading 'Mean logHR.' The SemiCompRisks Weibull and PEM entries are therefore likely posterior medians rather than means, which compromises the comparison of posterior means that is the paper's central quantity. The authors should either compute posterior means from the MCMC samples or clearly relabel these entries as medians throughout, and the abstract's 'posterior mean hazard ratio' wording would then need adjustment.
- [Section 3.2 and Discussion] The exceptions to the agreement claim are not explained mechanistically. The dynsurv default partition moves the log-HR estimate from 0.260 to 0.406 when the partition is changed (Discussion), and Table 2 notes that dynsurv's default MCMC output includes burn-in iterations; the authors attribute the deviation only to the larger number of intervals without testing whether the untrimmed MCMC output contributes. Similarly, the Murray et al. LRTP spline estimate of 0.223 with a 95% CrI covering zero is reported without an explanation of whether the discrepancy reflects the spline prior, the partition choice, or the time rescaling mentioned in the Discussion. Because the paper's purpose is to guide implementation choices, unexplained variability driven by implementation details in exactly these methods is a load-bearing gap.
minor comments (6)
- [Section 3.2] The function name 'indepdtCoxph()' is a typo; the correct spBayesSurv function is 'indeptCoxph()', and Figure 2 uses the lower-case label 'indeptcoxph'. Please standardize.
- [Figure 3 caption] The caption of Figure 3 says the middle and right panels refer to an exponential model via survHE/Stan and an MPT prior, respectively, but the plotted middle panel is labeled 'SemiCompRisks PEM' and the right panel 'MPT - Weibull'. The caption does not match the figure content.
- [Section 2.1] The text says 'The pnorm() and pqnorm() functions in R enable...' but the second function should be qnorm(); pnorm and qnorm are the relevant functions for the posterior probability and quantile computations described.
- [Table 1 and Section 3.2] The SemiCompRisks prior is listed in Table 1 as 'β ∝ 1', which is an improper flat prior, while Section 3.2 describes it as 'uniform with mean zero'; this wording conflates an improper prior with a proper uniform distribution and should be corrected.
- [Figure 5 caption] The caption refers to 'survreg2(..., survmodel="PH", ...)', but the function name in the package is survregbayes2(); please correct the caption.
- [Section 2.2.1] The name 'Kalbfleish' is a typo for Kalbfleisch, matching reference 21; please correct the spelling.
Circularity Check
No significant circularity: Bayesian posterior estimates are computed from the data with stated priors, while the Cox MLE serves as an external benchmark rather than as a fitted input.
full rationale
The paper's central comparison is between posterior means from several R package implementations and the Cox MLE. The MLE (log HR = 0.366) is used as a reference value, not as an input to the fully Bayesian models; those models use the raw event times and censoring indicators, with priors stated in Table 1 and Section 2.2. Their agreement with the MLE is an empirical finding and is not forced by construction. The partial Bayesian approach in Section 2.1 does use the MLE y as the sufficient statistic in a conjugate normal update, so its posterior mean is a weighted average of y and the prior mean; the paper reports this transparently (Section 3.1) and does not present this method as an independent package-based validation. The enthusiastic prior is based on the trial protocol's hypothesized benefit, not on the observed data. The ALLOZITHRO trial citation supplies the case-study data rather than any load-bearing analytical conclusion. All model definitions, prior densities, and estimation details are given, and no parameter is fitted to a subset of data and then renamed as a prediction. The acknowledged dependence of results on the chosen dataset is a generalizability limitation, not a circularity. The derivation chain is therefore self-contained and the comparison is meaningful.
Assumptions & free parameters
free parameters (2)
- Enthusiastic prior mean for log HR in conjugate analysis =
-0.45
- Prior implicit sample size n0 for conjugate analysis =
10
assumptions (4)
- domain assumption Cox proportional hazards assumption holds for the trial data
- domain assumption Independent (non-informative) censoring
- domain assumption MCMC samples approximate the posterior distribution
- standard math Bayes theorem and normal-normal conjugacy
Cite this review
Pith. "Pith review of Bayesian models for survival data of clinical trials: Comparison of implementations using R software." pith.science (2026). https://pith.science/paper/CBA7VNM5
@misc{pith2026190806687,
  author       = {Pith},
  title        = {Pith review of: Bayesian models for survival data of clinical trials: Comparison of implementations using R software},
  year         = {2026},
  howpublished = {\url{https://pith.science/paper/CBA7VNM5}},
  note         = {Machine review of arXiv:1908.06687}
}
read the original abstract
Objective: To provide guidance for the use of the main functions available in R for performing post hoc Bayesian analysis of a randomized clinical trial with a survival endpoint using proportional hazard models. Study Design and Setting: Data derived from the ALLOZITHRO trial, conducted with 465 patients after allograft to prevent pulmonary complications and allocated between azithromycin and placebo; airflow decline-free survival at 2 years after randomization was the main endpoint. Results: Despite heterogeneity in modeling assumptions, in particular for the baseline hazard (parametric or nonparametric), and in estimation methods, Bayesian posterior mean hazard ratio (HR) estimates of azithromycin effect were close to those obtained by the maximum likelihood approach. Conclusion: Bayesian models can be implemented using various R packages, providing results in close agreement with the maximum likelihood estimates. These models provide probabilistic statements that could not be obtained otherwise.
Figures


Figures from the paper (5 more)


Reference graph
Works this paper leans on
-
[1]
Wijeysundera, D. N., Austin, P. C., Hux, J. E., Beattie, W. S. & Laupacis, A. Bayesian statistical inference enhances the interpretation of contemporary randomized controlled trials. J. Clin. Epidemiol. 62, 13–21, DOI: 10.1016/j.jclinepi.2008. 07.006 (2009)
- [2]
-
[3]
Ruberg, S. J. et al. Inference and decision making for 21st-century drug development and approval. The Am. Stat. 73, 319–327, DOI: 10.1080/00031305.2019.1566091 (2019)
arXiv 2019
-
[4]
Biswas, S., Liu, D., Lee, J. & Berry, D. Bayesian clinical trials at the University of Texas M. D. Anderson Cancer Center. Clin Trials 6, 205–216, DOI: 10.1177/1740774509104992 (2009)
- [5]
-
[6]
Ibrahim, J., Chen, M. & Sinha, D. Bayesian survival analysis (Springer, 2001)
work page 2001
-
[7]
Brard, C., Le Teuff, G., Le Deley, M. & Hampson, L. Bayesian survival analysis in clinical trials: What methods are used in practice? Clin Trials 14, 78–87, DOI: 10.1177/1740774516673362 (2016)
-
[8]
Rietbergen, C., Debray, T. P., Klugkist, I., Janssen, K. J. & Moons, K. G. Reporting of Bayesian analysis in epidemiologic research should become more transparent. J. Clin. Epidemiol. 86, 51–58.e2, DOI: 10.1016/j.jclinepi.2017.04.008 (2017)
Show all 48 references
-
[9]
Bergeron, A. et al. Effect of Azithromycin on Airflow Decline–Free Survival After Allogeneic Hematopoietic Stem Cell Transplant: The ALLOZITHRO Randomized Clinical Trial. JAMA 318, 557–566, DOI: 10.1001/jama.2017.9938 (2017)
2017
-
[10]
Incorporating Bayesian ideas into health-care evaluation
Spiegelhalter, D. Incorporating Bayesian ideas into health-care evaluation. Stat. Sci. 19, 156–174 (2004)
2004
-
[11]
Tsiatis, A. A. The asymptotic joint distribution of the efficient scores test for the proportional hazards model calculated over time. Biometrika 68, 311–315 (1981)
1981
-
[12]
& Parmar, M
Spiegelhalter, D., Freedman, L. & Parmar, M. Bayesian approaches to randomized trials. J. Royal Stat. Soc. Ser. A 157, 357–416 (1994)
1994
-
[13]
& Best, N
Spiegelhalter, D., Thomas, A. & Best, N. WinBUGS Version 1.2 User Manual(MRC Biostatistics Unit, 1999)
1999
-
[14]
JAGS Version 4.3.0 user manual(2017)
Plummer, M. JAGS Version 4.3.0 user manual(2017). 10/21
2017
-
[15]
Carpenter, B. et al. Stan: A probabilistic programming language. J. Stat. Softw. 76, DOI: 10.18637/jss.v076.i01 (2017)
2017 doi
-
[16]
& Chopin, N
Rue, H., Martino, S. & Chopin, N. Approximate bayesian inference for latent gaussian models by using integrated nested laplace approximations. J. Royal Stat. Soc. Ser. B (Statistical Methodol. 71, 319–392, DOI: 10.1111/j.1467-9868.2008. 00700.x (2009)
2009
-
[17]
& Yan, J
Wang, X., Chen, M. & Yan, J. Bayesian dynamic regression models for interval censored survival data with application to children dental health. Lifetime data analysis 19, 297–316, DOI: 10.1007/s10985-013-9246-8 (2013)
2013 doi
-
[18]
& Zhang, J
Zhou, H., Hanson, T. & Zhang, J. spBayesSurv: Fitting Bayesian spatial survival models using R. arXiv 1705.04584 (2018)
2018 arXiv
-
[19]
survHE: Survival analysis in health economic evaluation
Baio, G. survHE: Survival analysis in health economic evaluation. https://CRAN.R-project.org/package=survHE (2018). R package version 1.0.64
2018
-
[20]
H., Lee, C., Alvares, D
Lee, K. H., Lee, C., Alvares, D. & Haneuse, S.SemiCompRisks: Hierarchical models for parametric and semi-parametric analyses of semi-competing risks data (2019). R package version 3.3
2019
-
[21]
Non-parametric Bayesian analysis of survival time data
Kalbfleisch, J. Non-parametric Bayesian analysis of survival time data. J. Royal Stat. Soc. Ser. B 40, 214–241 (1978)
1978
-
[22]
K., Ture, M
Omurlu, I. K., Ture, M. & Ozdamar, K. Bayesian analysis of parametric survival models: A computer simulation study based informative priors. J. Stat. Manag. Syst. 18, 405–423, DOI: 10.1080/09720510.2014.961763 (2015)
2015
-
[23]
& Errington, D
Abrams, K., Ashby, D. & Errington, D. A Bayesian approach to Weibull survival models? application to a cancer clinical trial. Lifetime Data Analysis 2, 159–174, DOI: 10.1007/bf00128573 (1996)
1996 doi
-
[24]
& Ture, M
Omurlu, I., Ozdamar, K. & Ture, M. Comparison of Bayesian survival analysis and Cox regression analysis in simulated and breast cancer data sets. Expert. systems with applications 36, 11341–11346, DOI: 10.1016/j.eswa.2009.03.058 (2009)
2009 doi
-
[25]
& Mallick, B
Walker, S. & Mallick, B. A bayesian semiparametric accelerated failure time model. Biometrics 55, 477–483 (1999)
1999
-
[26]
& Johnson, W
Hanson, T. & Johnson, W. O. Inference for mixtures of finite Polya tree models. J. Am. Stat. Assoc. 101, 1548–1565, DOI: 10.1198/016214506000000384 (2006)
2006 doi
-
[27]
Zhao, L., Hanson, T. E. & Carlin, B. P. Mixtures of Polya trees for flexible spatial frailty survival modelling. Biometrika 96, 263–276, DOI: 10.1093/biomet/asp014 (2009)
2009 doi
-
[28]
& Hanson, T
Zhao, L. & Hanson, T. E. Spatially dependent Polya tree modeling for survival data. Biometrics 67, 391–403, DOI: 10.1111/j.1541-0420.2010.01468.x (2011)
2011
-
[29]
A., Hobbs, B
Murray, T. A., Hobbs, B. P., Sargent, D. J. & Carlin, B. P. Flexible Bayesian survival modeling with semiparametric time-dependent and shape-restricted covariate effects. Bayesian Analysis 11, 381–402, DOI: 10.1214/15-BA954 (2016)
2016 doi
-
[30]
& Parmar, M
Royston, P. & Parmar, M. K. B. Flexible parametric proportional-hazards and proportional-odds models for censored survival data, with application to prognostic modelling and estimation of treatment effects. Stat. Medicine 21, 2175–2197, DOI: 10.1002/sim.1203 (2002)
2002 doi
-
[31]
Grambsch, P. M. & Therneau, T. M. Proportional hazards tests and diagnostics based on weighted residuals. Biometrika 81, 515–526, DOI: 10.1093/biomet/81.3.515 (1994)
1994 doi
-
[32]
Moatti, M. et al. Modeling of experts’ divergent prior beliefs for a sequential phase III clinical trial. Clin Trials 10, 505–514, DOI: 10.1177/1740774513493528 (2013)
2013 doi
-
[33]
J., Best, N
Spiegelhalter, D. J., Best, N. G., Carlin, B. P. & Van Der Linde, A. Bayesian measures of model complexity and fit. J. Royal Stat. Soc. Ser. B (Statistical Methodol. 64, 583–639, DOI: 10.1111/1467-9868.00353 (2002)
2002
-
[34]
& Gelman, A
Gabry, J., Simpson, D., Vehtari, A., Betancourt, M. & Gelman, A. Visualization in Bayesian workflow. J. Royal Stat. Soc. Ser. A (Statistics Soc. 182, 389–402, DOI: 10.1111/rssa.12378 (2019)
2019 doi
-
[35]
Smith, B. J. boa: An r package for MCMC output convergence assessment and posterior inference. J. Stat. Softw. 21, 1–37, DOI: 10.18637/jss.v021.i11 (2007)
2007 doi
-
[36]
& Vines, K
Plummer, M., Best, N., Cowles, K. & Vines, K. coda: Convergence diagnosis and output analysis for MCMC. R News 6, 7–11 (2006)
2006
-
[37]
& Zhang, Z
Lin, X., Cai, B., Wang, L. & Zhang, Z. A Bayesian proportional hazards model for general interval-censored data. Lifetime Data Analysis 21, 470–490, DOI: 10.1007/s10985-014-9305-9 (2015)
2015 doi
-
[38]
& Lin, X
Pan, C., Cai, B., Wang, L. & Lin, X. ICBayes: Bayesian semiparametric models for interval-censored data (2017). R package version 1.1. 11/21
2017
-
[39]
& Rosner, G
De Iorio, M., Johnson, W., Muller, P. & Rosner, G. Bayesian nonparametric non-proportional hazards survival modelling. Biometrics 65, 762–771, DOI: 10.1111/1467-9868.00173 (2009)
2009
-
[40]
& Andersson, B
Xu, Y ., Thall, P., Hua, W. & Andersson, B. Bayesian non-parametric survival regression for optimizing precision dosing of intravenous busulfan in allogeneic stem cell transplantation. J. Royal Stat. Soc. Appl. Stat. Ser. C 68, 809–828, DOI: 10.1111/rssc.12331 (2019)
2019 doi
-
[41]
& Xu, Y .DDPGPSurv (2018)
Hua, W. & Xu, Y .DDPGPSurv (2018). R package version 1.0
2018
-
[42]
Mangili, F., Benavoli, A., de Campos, C. P. & Zaffalon, M. Reliable survival analysis based on the Dirichlet process. Biom. J. 57, 1002–1019, DOI: 10.1002/bimj.201500062 (2015)
2015 doi
-
[43]
M., Schoenfeld, J
Alexander, B. M., Schoenfeld, J. D. & Trippa, L. Hazards of hazard ratios—deviations from model assumptions in immunotherapy. New Engl. J. Medicine 378, 1158–1159, DOI: 10.1056/NEJMc1716612 (2018)
2018 doi
-
[44]
S., Salomaa, V
Peltola, T., Havulinna, A. S., Salomaa, V . & Vehtari, A. Hierarchical Bayesian survival analysis and projective covariate selection in cardiovascular event risk prediction. In Proceedings of the Eleventh UAI Conference on Bayesian Modeling Applications Workshop - Volume 1218,...
2014
-
[45]
& Wolfe, R
Brilleman, S., Crowther, M., Moreno-Betancur, M., Buros Novik, J. & Wolfe, R. Joint longitudinal and time-to-event models via Stan. (2018). StanCon 2018. 10-12 Jan 2018. Pacific Grove, CA, USA
2018
-
[46]
& Brilleman, S
Goodrich, B., Gabry, J., Ali, I. & Brilleman, S. rstanarm: Bayesian applied regression modeling via Stan. (2018). R package version 2.17.4
2018
-
[47]
Bayesian analysis using the PHREG procedure
SAS. Bayesian analysis using the PHREG procedure. https://support.sas.com/rnd/app/Bayesian/PHREG.html (2019). Accessed: 2019-05-27
2019
-
[48]
Weibull"), BayesSurv_HReg(..., model=’PEM’), survHE package’s functions fit.models(..., method=
STATA 15. Bayesian parametric survival models. https://www.stata.com/new-in-stata/ bayesian-parametric-survival-models/ (2019). Accessed: 2019-05-27. 12/21 5 Supplementary data 5.1 Default MCMC parameterizations We initially applied the available R packages and functions using...
2019
Reviewed August 14, 2026 · model on record in the stance chip above.
Discussion (0). Continue with ORCID to comment.