REVIEW 3 major objections 6 minor 28 references
A Phase Shift and Sum Method for UWB Radar Imaging in Dispersive Media
T0 review · 3 major / 6 minor · reviewed 2026-08-14 · deepseek-v4-flash
Pith's one-line read By compensating phase and amplitude for each frequency component separately before summing, the PSAS algorithm images objects in dispersive media with less shape distortion and better weak-scatter detection than time-shift methods.
desk verdict Solid frequency-domain imaging algorithm for dispersive media with honest experiments, but the unvalidated low-frequency ray assumption should be tested before overclaiming. read the letter →
The pith
A machine-rendered reading of the paper's core claim, the machinery that carries it, and where it could break.
The reading
What carries the argument
The central object is the phase-compensated vector sum at each frequency, written as $|\vec{R}| e^{j \tilde{k} \vec{R}} V_n(f,\phi) / \sqrt{G_t G_r}$, where $\tilde{k}$ is the complex wavenumber carrying both phase and loss. The complex exponential $e^{j\tilde{k}\vec{R}}$ is the mechanism: it rotates each measured harmonic’s phase to the focal point and amplifies it by the inverse attenuation, so that responses from real scatterers add coherently while noise and clutter add incoherently. For focal points where refraction on the curved boundary creates several stationary-time paths, the scalar compensator is replaced by $1/H_{\mathrm{eff}}$, the inverse of the summed transfer functions of the individual ray channels. The implementation also uses premeasured frequency-dependent antenna phase centers, and integrates power density over the band rather than summing time-domain pulses.
What would settle it
A full-wave simulation of the same 10-cm cylinder filled with glycerin, using the measured dielectric data, would let a reader compare the true field paths with the ray-predicted paths at 2 GHz and 3 GHz. If the low-frequency phase fronts deviate substantially from the ray paths, then a PSAS reconstruction built only from frequencies below about 3 GHz should show defocusing, shape distortion, or shifted target position compared with the full-band image; if the low-frequency-only image stays sharp, the ray assumption holds where it matters.
Extended reading notes
Core claim
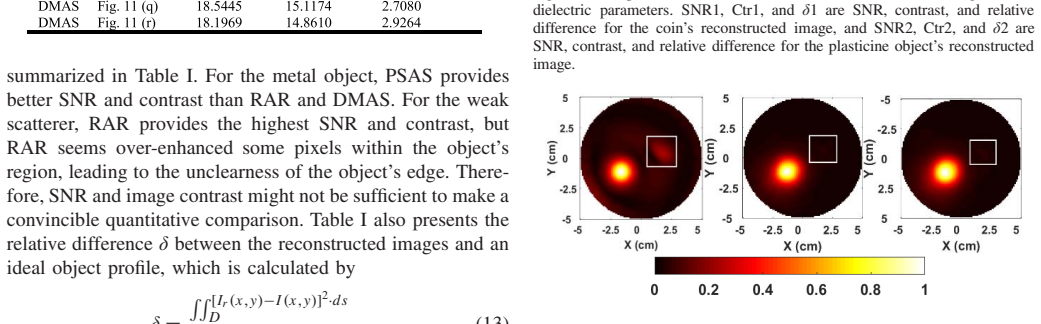
The central claim is that dispersive propagation of a UWB signal can be handled by evaluating a phase shift in the frequency domain rather than a time shift in the time domain. For each frequency f, the algorithm computes the complex wavenumber in each medium, the ray path through the curved air–glycerin interface, the antenna phase centers, and the amplitude attenuation, applies the compensation $e^{j\tilde{k}\vec{R}}$ to each measured scattered field, and sums the $M\times N$ vector signals; the magnitude squared of that sum is the power density at f, and integrating over the 2–7 GHz band gives the pixel value. The paper reports that with only 11 frequency points, PSAS localizes both a strong metal scatterer and a weak plasticine scatterer, preserves object shape better (smallest relative difference $\delta$ to an ideal profile in all cases), and detects the weak scatterer when it sits beside a strong one, where RAR misses it entirely. The underlying reason is that per-frequency compensation restores the UWB bandwidth that dispersion removes and avoids the ambiguous single velocity used by time-shift methods.
Load-bearing premise
The reconstruction assumes that geometric ray theory accurately predicts the propagation path through the curved air–glycerin interface for all frequencies in the 2–7 GHz band; the authors state, “For convenience, we assumed that the ray method was still valid for low-frequency components,” and at the lowest frequencies the wavelength in glycerin is comparable to the 10-cm cylinder diameter.
Editorial extensions
If this is right
- If PSAS is correct, UWB imaging systems embedded in dispersive coupling media can recover image resolution by compensating each frequency component instead of assuming a constant propagation speed.
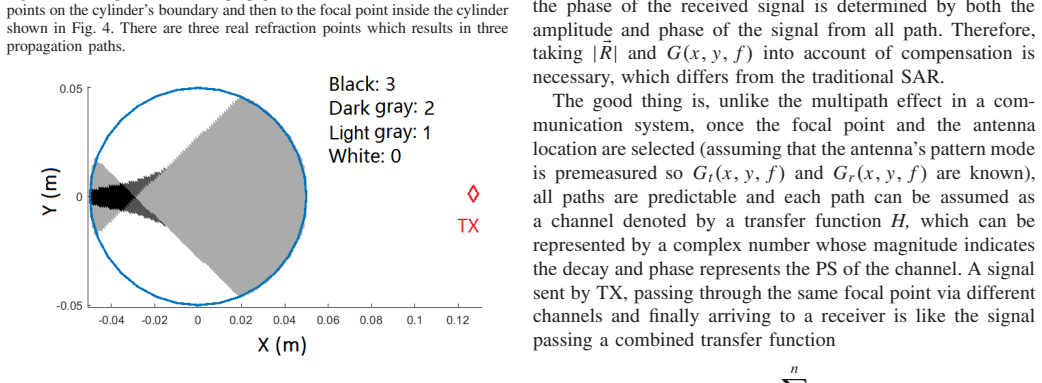
- The monochromatic multipath treatment predicts that certain regions inside a curved dielectric boundary receive several refracted paths; imaging in those regions requires summing channel transfer functions rather than applying a single time delay.
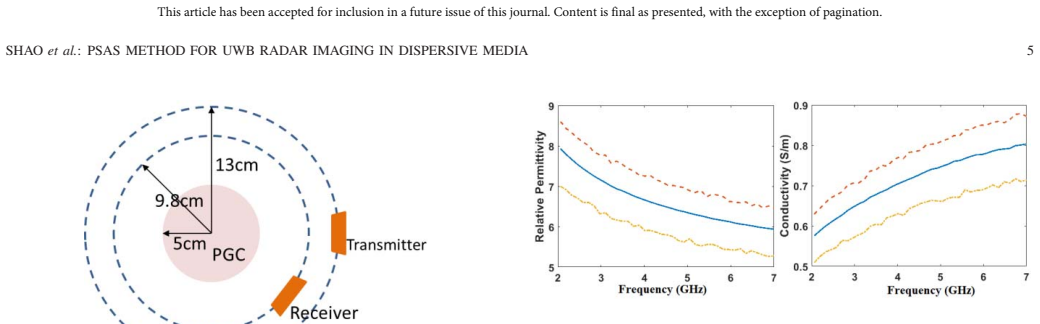
- Robustness to 8–12% errors in the assumed dielectric parameters means the method does not require exact medium characterization to improve on time-shift baselines.
- Because only 11 frequency samples were needed for the full band, the frequency-wise integration is computationally cheap enough for practical near-field imaging; adding more samples improves quality at predictable cost.
- In a scene with a strong and a weak scatterer together, PSAS is claimed to find the weak scatterer while RAR misses it, which would matter for detecting small tumors or buried objects next to strong reflectors.
Reading between the lines
- The same per-frequency phase-center compensation could be applied in other dispersive biomedical coupling media, such as breast-mimicking liquids or brain phantoms, where the published experiments used glycerin only.
- The ray-path count map in Fig. 6 could be used as a system-design tool: antenna positions and focal regions with a single stationary-time path would make image formation simpler, while multi-path regions could be flagged for $H_{\mathrm{eff}}$-based processing.
- The dielectric-parameter robustness test suggests a practical extension: run PSAS over a small grid of candidate permittivity and conductivity curves and pick the image with the sharpest focus, yielding joint medium estimation and imaging from the same data.
- If per-frequency processing is the key, then the 11 frequency points could be replaced by an adaptive sparse set selected by the medium’s dispersion curve, cutting computation time while preserving bandwidth recovery.
Signed reviews
Editorial analysis
A structured set of objections, weighed in public.
Referee Report
Summary. The paper presents a phase shift and sum (PSAS) algorithm for ultrawideband radar imaging of objects embedded in dispersive media. For each frequency component in the 2–7 GHz band, the algorithm estimates the propagation distance from transmitter to focal point to receiver using ray paths that include refraction at the curved air–glycerin interface, compensates the corresponding phase shift and amplitude decay using the complex wavenumber of the dispersive medium, and then coherently sums the compensated responses over the band to form the image. The multipath that arises from refraction on the curved cylinder boundary is modeled as a sum of ray-based channel transfer functions H_eff. The method is validated experimentally with a custom microwave imaging system using glycerin as the dispersive background, for two objects: a stack of metal coins and a plasticine weak scatterer. Comparisons with two time-shift algorithms, RAR and DMAS, are reported in terms of SNR, image contrast, a relative-difference metric, weak-scatter detectability, and shape distortion, with PSAS shown to produce lower shape distortion and better weak-scatter visibility.
Significance. If the reconstruction claims hold, the paper makes a useful contribution to microwave imaging in dispersive media: replacing a single time-shift estimate with per-frequency phase and amplitude compensation is a conceptually sound way to address frequency-dependent velocity, loss, and path variation. The experimental validation is a genuine strength: the dielectric parameters of glycerin were measured independently with a probe, the comparison methods use the same dielectric data at the center frequency, and the robustness test with ±8–12% dielectric uncertainty is appropriate. I see no circularity: no output parameter of the algorithm is fitted to the target images. The quantitative comparisons in Tables I and II and the time-/frequency-domain illustrations in Figs. 14 and 15 support the central claim that PSAS reduces dispersion-induced pulse distortion and improves weak-scatter detection. The main risk is the unvalidated ray-optics assumption at the low end of the band, which is load-bearing for the phase compensation.
major comments (3)
- [Section II, after Fig. 6 and Eqs. (1)–(5)] The PSAS phase compensation in Eqs. (1)–(3) uses ray-based distances d1T, d2T, d3R, and d4R for every frequency component in the 2–7 GHz band. The manuscript explicitly states: “For convenience, we assumed that the ray method was still valid to predict the propagation path for low-frequency components in the UWB spectrum,” but no full-wave or experimental validation of this assumption is provided. At 2 GHz, the wavelength in glycerin is comparable to the 10-cm cylinder diameter, so Snell-law/stationary-time paths obtained from Eq. (5) are not obviously valid. A path-length error of a few centimeters at 2 GHz corresponds to a large fraction of a wavelength and directly degrades the coherent sum in Eq. (2). Because this assumption enters every low-frequency sample used in the reconstruction, it is load-bearing for the claim that PSAS resolves the dispersive and multipath effects. Please add a full-wave validation (for example, FDTD simulation of the exact cylinder geometry with the measured glycerin parameters) that compares the ray-predicted phase/amplitude compensation with full-wave fields, or restrict and justify the usable lower band edge, and quantify the resulting image degradation.
- [Section II, Eq. (6) and Fig. 6] The monochromatic-multipath compensation based on H_eff in Eq. (6) is presented for a single frequency (4.5 GHz in Fig. 6), while the caption of Fig. 6 admits that the distribution of path-count regions is “slightly different for other frequencies within the range 2–7 GHz.” The manuscript does not state whether the ray-path enumeration and the H_eff values are recomputed at each of the 11 frequency samples or computed once at 4.5 GHz and reused for all frequencies. Since the central advantage of PSAS is its per-frequency processing, this distinction is important: if the multipath channel model is not recomputed per frequency, then a significant part of the claimed frequency-selective multipath handling is not actually implemented. Please specify the procedure and, if the paths are reused across frequencies, estimate the phase error introduced at the band edges.
- [Section II and Section IV.B] The phrase “our electromagnetic simulation shows that the larger the dielectric constant of medium 2, and/or the higher the frequency, the more approximate ... the field pattern in the cylinder is achieved” is used to support the ray-model discussion, but no simulation setup, parameters, or results are shown. This is a missing piece of evidence for the ray-optics assumption, especially because the claim is frequency-dependent and the reconstruction includes frequencies down to 2 GHz. Please either provide the simulation details and a quantitative comparison of ray-predicted paths with full-wave fields, or remove this statement and replace it with a concrete validation or a stated limitation.
minor comments (6)
- [Abstract and Section I] The abstract contains the typo “highquality” which should read “high-quality.”
- [Section I] The introduction states that comparisons with TS-based algorithms are presented in “Section VI,” but the paper has no Section VI; the comparisons are in Section IV and the conclusion is Section V.
- [Section II, Eq. (2)] The notation V_n(f,∅) in Eq. (2) uses the empty-set symbol ∅ without definition; this appears to be a typographical artifact. Please define the variable or use a standard placeholder such as V_n(f).
- [Section IV.B, Eq. (12)] The contrast formula in Eq. (12) lacks parentheses and is ambiguous: as written it could be read as 20 log10[(1/N) ∑_Ω(Ir) / Ave(Ir)] or 20 log10[1/(N ∑_Ω(Ir)) / Ave(Ir)]. Please clarify with explicit parentheses.
- [Section IV.A] The grouping of signals into “19 groups, each group contains 24 data sets” is stated without explaining how the 19 and 24 arise from the 15° rotation scheme. Please add a sentence describing the group construction and how Eq. (9) is applied within each group.
- [Section IV, third test and Fig. 9] In the third test the text says the objects are placed “in GPC,” which should be “PGC” (plastic graduated cylinder). Also, in Fig. 9 the dashed/dotted lines representing the ±8–12% perturbed data are not explicitly identified in the caption; please state which line style corresponds to which perturbation.
Circularity Check
No circularity: PSAS uses independently measured dielectric parameters and validates reconstruction against measured scattered fields, without fitting outputs to the target images.
full rationale
The derivation chain is self-contained. The PSAS image is defined by Eq. (2) as a frequency-by-frequency phase and amplitude compensation of the measured scattered field, using the independently measured dielectric parameters of glycerin (Fig. 9, Agilent probe measurement) and premeasured antenna phase centers. No output parameter of the reconstruction is fitted to the known object locations, shapes, or ideal profiles; the ideal profiles are used only after reconstruction to compute the relative difference metric delta in Eq. (13). The comparison with RAR and DMAS uses the same measured dielectric data at the center frequency, so no advantage is imported by construction. The paper's stated assumption that the ray method remains valid for low-frequency components (Section IV: 'For convenience, we assumed that the ray method was still valid to predict the propagation path for low-frequency components') is an acknowledged physical approximation, not a circular reduction: the assumed ray paths enter the phase-compensation model, but the model's output is then tested against measured data, and the sensitivity to 8-12% random dielectric perturbations is treated as a robustness test rather than a fit. Citations to the authors' prior work ([16], [19]-[21]) support the phase-confocal concept, the antenna, and the measurement hardware, but the central claim of this paper is validated by the present experiments rather than by those citations. No equation in the paper reduces to its own input by definition, and no 'prediction' is obtained from the same data it claims to predict. The finding is therefore no significant circularity.
Assumptions & free parameters
assumptions (7)
- domain assumption Geometric ray theory accurately models propagation through the 10-cm glycerin cylinder at all frequencies from 2 to 7 GHz.
- domain assumption Measured dielectric parameters of glycerin (complex permittivity) are accurate and representative of the medium during imaging.
- domain assumption The plastic cylinder wall (1 mm thickness) has negligible effect on propagation and can be ignored.
- domain assumption The antenna phase center is a well-defined point and was premeasured at the 11 used frequencies.
- domain assumption The average-subtraction artifact removal yields the true object scattering signal under the symmetry assumption of the multistatic setup.
- standard math Fermat's principle is interpreted as stationary path length, not least time.
- domain assumption The received scattered field at each frequency is a coherent sum over a finite number of discrete paths (ray channels).
Cite this review
Pith. "Pith review of A Phase Shift and Sum Method for UWB Radar Imaging in Dispersive Media." pith.science (2026). https://pith.science/paper/XPAWKDSK
@misc{pith2026190806855,
  author       = {Pith},
  title        = {Pith review of: A Phase Shift and Sum Method for UWB Radar Imaging in Dispersive Media},
  year         = {2026},
  howpublished = {\url{https://pith.science/paper/XPAWKDSK}},
  note         = {Machine review of arXiv:1908.06855}
}
read the original abstract
A phase shift and sum (PSAS) algorithm to image objects in dispersive media is presented. The algorithm compensates the phase shift of the scattered field from the receiver to the source for each frequency component in an ultrawideband (UWB) and then integrates all the frequency responses. This method resolves the multispeed and multipath issue when UWB signals propagate in dispersive media. In addition, a multipath effect due to refraction on a curved boundary is also explored. By collecting data using a customized microwave measurement system of two different objects placed in a plastic graduated cylinder filled with glycerin, along the measured dielectric parameters of glycerin (a dispersive medium), highquality reconstructed images are formed using PSAS. Quantitative and qualitative comparisons with two other traditional time-shift radar-based microwave imaging algorithms for the same objects under test demonstrate the advantages of PSAS.
Figures


Figures from the paper (9 more)




Reference graph
Works this paper leans on
-
[1]
PSs between the antenna and focal points can be accu- rately evaluated because each frequency component in the UWB spectrum is individually treated
-
[2]
The frequency-dependent phase centers of the UWB antenna can be implemented to ease the PS estimation
-
[3]
Amplitude-decay in the lossy media is compensated for each frequency component, which relieves the UWB waveform distortion. Therefore, the PSAS algorithm promises to resolve the dis- persion effect and provide better quality images for objects immersed in dispersive media. The details of the PSAS algorithm are described in Section II. Meanwhile, a nonfreq...
-
[4]
Y . Wang, L. Li, X. Y . Zhou, and T. J. Cui, “Supervised automatic detection of UWB ground-penetrating r adar targets using the regression SSIM measure,” IEEE Geosci. Remote Sens. Lett. , vol. 13, no. 5, pp. 621–625, May 2016
work page 2016
-
[5]
A sparse aperture MIMO-SAR-based UWB imaging system for concealed weapon detection,
X. Zhuge and A. G. Yar ovoy, “A sparse aperture MIMO-SAR-based UWB imaging system for concealed weapon detection,” IEEE Trans. Geosci. Remote Sens. , vol. 49, no. 1, pp. 509–518, Jan. 2011
work page 2011
-
[6]
Through-wall detection of human being’s movement by UWB radar,
J. Li, Z. Zeng, J. Sun, and F. Liu, “Through-wall detection of human being’s movement by UWB radar,” IEEE Geosci. Remote Sens. Lett. , vol. 9, no. 6, pp. 1079–1083, Nov. 2012
work page 2012
-
[7]
X. Li, E. J. Bond, B. D. V . Veen, and S. C. Hagness, “An overview of ultra-wideband microwave imaging via space-time beamforming for early-stage breast-cancer detection,” IEEE Antennas Propag. Mag. , vol. 47, no. 1, pp. 19–34, Feb. 2005
work page 2005
-
[8]
Microwave contrast imaging of breast tissue from local velocity estimation,
J.-F. Deprez, M. Sarafianou, M. Klemm, I. J. Craddock, and P. J. Probert-Smith, “Microwave contrast imaging of breast tissue from local velocity estimation,” Prog. Electromagn. Res. B , vol. 42, pp. 381–403, Jul. 2012
work page 2012
Show all 28 references
-
[9]
Novel preprocessing techniques for accurate microwave imaging of human brain,
S. Mustafa, B. Mohammed, and A. Abbosh, “Novel preprocessing techniques for accurate microwave imaging of human brain,” IEEE Antennas Wireless Propag. Lett. , vol. 12, pp. 460–463, 2013
2013
-
[10]
Beamforming algorithms for UWB radar-based stroke detection: Trade-off performance-complexity,
E. Ricci, E. Cianca, and T. Rossi, “Beamforming algorithms for UWB radar-based stroke detection: Trade-off performance-complexity,” J. Commun., Navigat., Sens. Services , vol. 2016, no. 1, pp. 11–18, Jan. 2016
2016
-
[11]
A confocal microwave imaging algorithm for breast cancer detection,
X. Li and S. C. Hagness, “A confocal microwave imaging algorithm for breast cancer detection,” IEEE Microw. Wireless Compon. Lett., vol. 11, no. 3, pp. 130–132, Mar. 2001
2001
-
[12]
Confocal microwave imaging for breast cancer detection: Localization of tumors in three dimensions,
E. C. Fear, X. Li, S. C. Hagness, and M. A. Stuchly, “Confocal microwave imaging for breast cancer detection: Localization of tumors in three dimensions,” IEEE Trans. Biomed. Eng. , vol. 49, no. 8, pp. 812–822, Aug. 2002. This article has been accepted for inclusion in a futur...
2002
-
[13]
Confo- cal microwave imaging for breast cancer detection: Delay-multiply- and-sum image reconstruction algorithm,
H. B. Lim, N. T. T. Nhung, E.-P. Li, and N. D. Thang, “Confo- cal microwave imaging for breast cancer detection: Delay-multiply- and-sum image reconstruction algorithm,” IEEE Trans. Biomed. Eng. , vol. 55, no. 6, pp. 1697–1704, Jun. 2008
2008
-
[14]
Detection of malignant breast tissues using microwave imaging,
F. Yang and A. S. Mohan, “Detection of malignant breast tissues using microwave imaging,” in Proc. Asia Pacific Microw. Conf. , Dec. 2009, pp. 397–400
2009
-
[15]
Multi-polarized microwave power imaging algorithm for early breast cancer detection,
W. Shao and R. S. Adams, “Multi-polarized microwave power imaging algorithm for early breast cancer detection,” Prog. Eectromagn. Res. M, vol. 23, pp. 93–107, Jan. 2012
2012
-
[16]
Prefiltered beamforming for early-stage breast cancer detection,
A. Shahzad, M. O’Halloran, E. J ones, and M. Glavin, “Prefiltered beamforming for early-stage breast cancer detection,” IEEE Antennas Wireless Propag. Lett., vol. 12, pp. 500–503, Apr. 2013
2013
-
[17]
A preprocessing filter for multistatic microwave breast imaging for enhanced Tumour detection,
A. Shahzad, M. O’Halloran, E. Jones, and M. Glavin, “A preprocessing filter for multistatic microwave breast imaging for enhanced Tumour detection,” Prog. Electromagn. Res. B, vol. 57, pp. 115–126, Dec. 2014
2014
-
[18]
A robust and artifact resistant algorithm of ultrawideband imaging system for breast cancer detection,
T. Yin, F. H. Ali, and C. C. Reyes-Aldasoro, “A robust and artifact resistant algorithm of ultrawideband imaging system for breast cancer detection,” IEEE Trans. Biomed. Eng. , vol. 62, no. 6, pp. 1514–1525, Jun. 2015
2015
-
[19]
A phase confocal method for near-field microwave imaging,
W. Shao, A. Edalati, T. R. McCollough, and W. J. McCollough, “A phase confocal method for near-field microwave imaging,” IEEE Trans. Microw. Theory Techn., vol. 65, no. 7, pp. 2508–2515, Jul. 2017
2017
-
[20]
Synthetic focusing method,
R. A. Simpkin, “Synthetic focusing method,” U.S. Patent 10 581 400, Sep. 12, 2005. [Online]. Available: http://pdfaiw.uspto.gov/.aiw? PageNum=0&docid=20070293752
2005
-
[21]
Three-dimensional microwave breast imaging using least electrical path method,
Y . Wang and A. Abbosh, “Three-dimensional microwave breast imaging using least electrical path method,” in Proc. Asia–Pacific Microw. Conf. Proc. (APMC), Nov. 2013, pp. 1021–1023
2013
-
[22]
A novel cavity backed monopole antenna with UWB unidirectional radiation,
A. Edalati, W. Shao, T. McCollough, and W. McCollough, “A novel cavity backed monopole antenna with UWB unidirectional radiation,” Prog. Electromagn. Res. C , vol. 72, pp. 1–13, Feb. 2017
2017
-
[23]
Microwave imaging device,
W. J. McCollough, T. R. McCollough, W. Shao, A. Edalati, and J. Ryan, “Microwave imaging device,” U.S. Patent 9 869 641, Jan. 16, 2018
2018
-
[24]
A time-domain measurement system for UWB microwave imaging,
W. Shao, A. Edalati, T. R. McCollough, and W. J. McCollough, “A time-domain measurement system for UWB microwave imaging,” IEEE Trans. Microw. Theory Techn., vol. 66, no. 5, pp. 2265–2275, May 2018
2018
-
[25]
Electrical characterization of glycerin: Water mixtures: Implications for use as a coupling medium in microwave tomography,
P. M. Meaney, C. J. Fox, S. D. Geim er, and K. D. Paulsen, “Electrical characterization of glycerin: Water mixtures: Implications for use as a coupling medium in microwave tomography,” IEEE Trans. Microw. Theory Techn., vol. 65, no. 5, pp. 1471–1478, May 2017
2017
-
[26]
A directional antenna in a matching liquid for microwave radar imaging,
S. I. Latif, D. F. Tapia, D. R. Herrera, M. S. Nepote, S. Pistorius, and L. Shafai, “A directional antenna in a matching liquid for microwave radar imaging,” Int. J. Antennas Propag. , vol. 2015, Nov. 2015, Art. no. 751739
2015
-
[27]
Average dielectric property analysis of complex breast tissue with microwave transmission measurements,
J. D. Garrett and E. C. Fear, “Average dielectric property analysis of complex breast tissue with microwave transmission measurements,” Sensors, vol. 15, no. 1, pp. 1199–1216, Jan. 2015
2015
-
[28]
Fast photoacoustic imaging system based on 320-element linear transducer array,
D. Xing, “Fast photoacoustic imaging system based on 320-element linear transducer array,” in Photoacoustic Imaging and Spectroscopy , vol. 24, L. V . Wang, Ed., 1st ed. Boca Raton, FL, USA: CRC Press, 2009, pp. 299–308. Authors’ photographs and biographies not available at th...
2009
Reviewed August 14, 2026 · model on record in the stance chip above.
Discussion (0). Continue with ORCID to comment.