REVIEW 3 major objections 4 minor 40 references
Deep Learning for Segmentation using an Open Large-Scale Dataset in 2D Echocardiography
T0 review · 3 major / 4 minor · reviewed 2026-08-14 · deepseek-v4-flash
Pith's one-line read Encoder-decoder networks, especially U-Net, segment 2D echocardiography at expert-level accuracy, reproduced by the new CAMUS dataset.
desk verdict A genuine dataset-and-benchmark contribution that deserves peer review; the clinical numbers are anchored to one expert and a no-ECG frame choice, and the paper's own wording about inter-observer comparisons needs a cleanup, but the central comparison holds up. read the letter →
The pith
A machine-rendered reading of the paper's core claim, the machinery that carries it, and where it could break.
The reading
What carries the argument
The load-bearing object is the CAMUS dataset itself: 500 patients, two standard views each, manual contours for the left ventricle endocardium, epicardium, and left atrium, plus a dedicated 50-patient fold annotated by three cardiologists and by one cardiologist twice, which defines inter- and intra-observer variability. The algorithm side rests on encoder-decoder networks (EDNs), the U-Net being a convolutional encoder that compresses the image into high-level features followed by a decoder that upsamples back to a segmentation map, with skip connections that recover fine detail. Volumes and ejection fraction are derived from the segmented endocardium using the Simpson biplane method of discs, and all methods are compared through ten-fold cross-validation against the reference expert's annotations.
What would settle it
Re-annotate a subset of the 500 patients using ECG-gated frame selection and a consensus of several cardiologists, then recompute U-Net's volume and ejection fraction errors against that independent reference. If the correlation drops well below 0.95, or if U-Net no longer beats the non-deep methods, the claim that encoder-decoder networks faithfully reproduce expert echocardiographic analysis would be refuted.
Extended reading notes
Core claim
The central claim is that encoder-decoder deep networks can be trained, on a few hundred patients, to segment 2D echocardiography at a level that is clinically usable: U-Net's contours and volume estimates land between the agreement of different cardiologists and the repeatability of a single cardiologist. Concretely, U-Net 2 reaches Dice scores around 0.94 to 0.95 for left ventricular structures with mean absolute distances near 1.6 mm, and its end-diastolic and end-systolic volumes correlate at 0.95 with the reference expert at a mean absolute error of 9.5 ml. The paper also establishes that the architectural sophistication of ACNN, stacked hourglasses, or U-Net++ does not beat a well-tuned U-Net, and that training on roughly 250 patients is enough to reach near-peak performance on this dataset.
Load-bearing premise
The headline numbers are all measured against the manual contours and frame choices of a single cardiologist (O1a), with end-diastole and end-systole picked as the frames where the left ventricle looks largest and smallest rather than by ECG; if that reference is systematically off, the reported correlations and errors overstate how accurate the networks truly are.
Editorial extensions
If this is right
- Fully automatic U-Net contours can supply left-ventricular volume measurements in routine echo reading without a human tracing the endocardium each time.
- The ejection fraction estimate, though not yet at intra-observer repeatability, is closer to experts than to classical non-deep methods; adding temporal coherence across the cardiac cycle is the stated next step to improve it.
- A compact U-Net (about 2 million parameters) gives essentially the same accuracy as much larger or structurally more complex networks, so clinical deployment does not need expensive architectures.
- Training on 250 patients is a practical target for building new echo segmentation systems; adding more patients still helps the most difficult structures but with diminishing returns.
- CAMUS provides a public benchmark where future methods can be measured against the same inter- and intra-observer variability.
Reading between the lines
- Editorial inference: a natural next test is multi-center, multi-vendor data; this study uses one scanner and one hospital, so the claimed error levels have not been shown to transfer to other equipment.
- Editorial inference: because end-diastole and end-systole were picked by largest and smallest left-ventricular dimension rather than by ECG, part of the ejection fraction error may reflect frame-timing in the reference itself; an ECG-gated re-reading of the same patients would separate segmentation error from timing error.
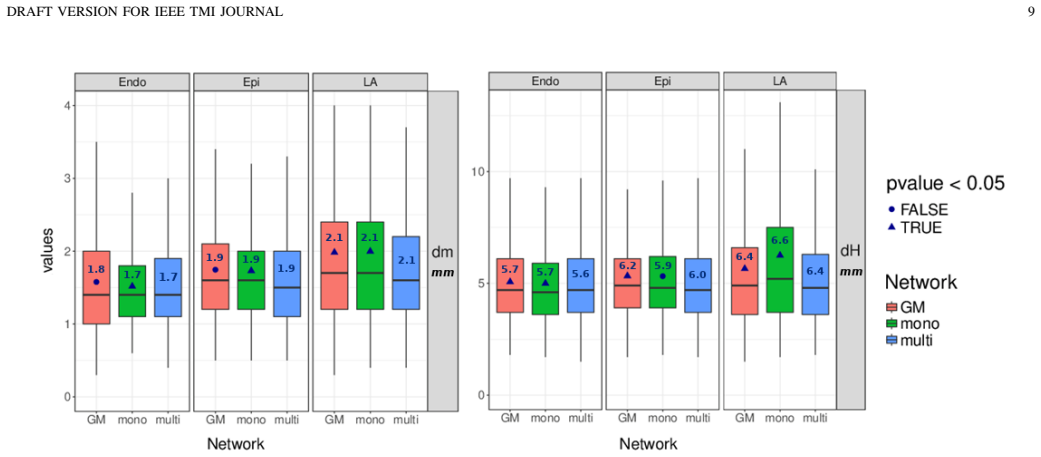
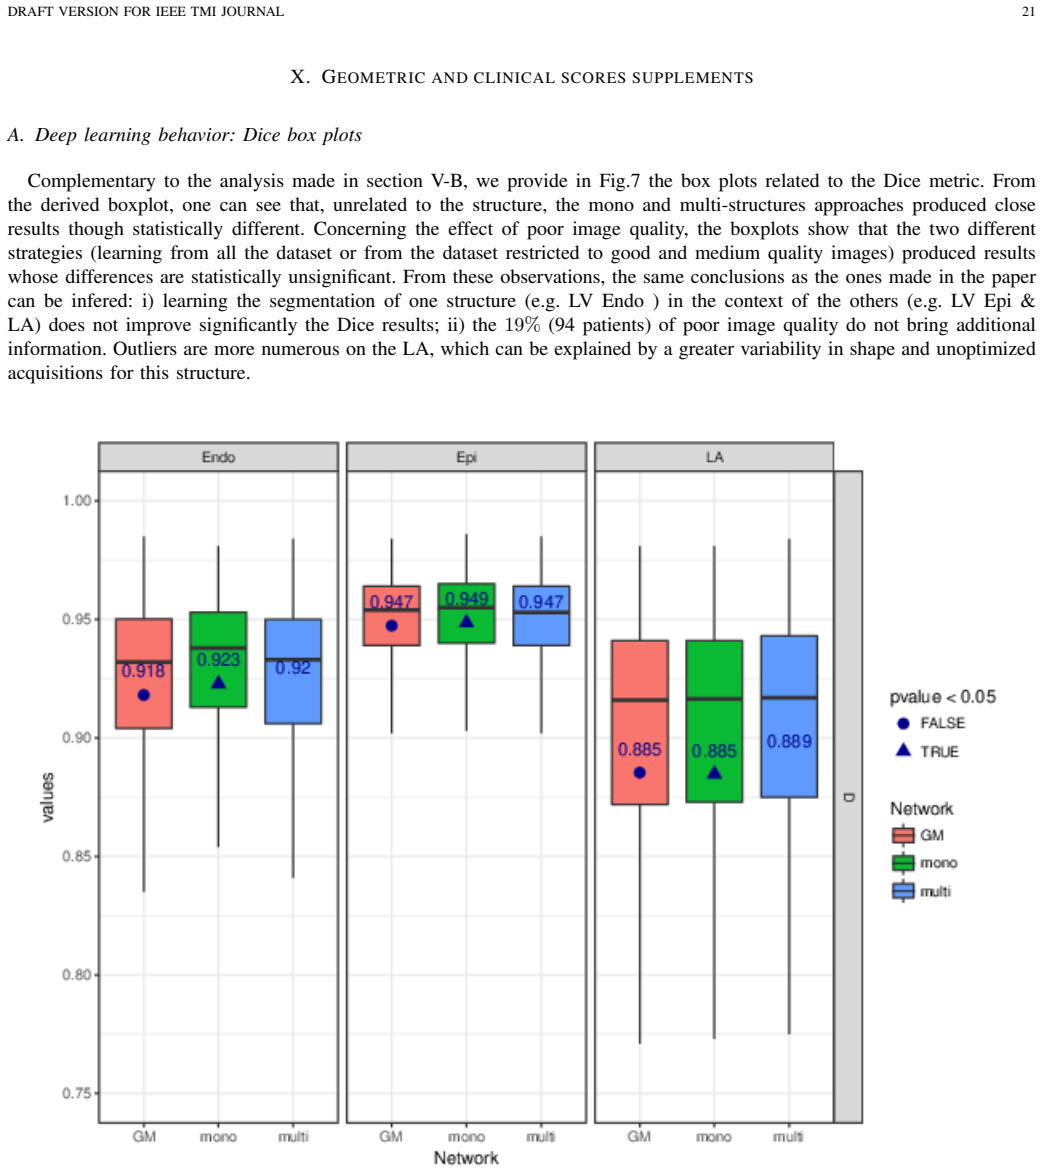
- Editorial inference: the finding that multi-structure training does not help left-ventricle segmentation suggests context is not being exploited; a network that explicitly models the relationship between endocardium, epicardium, and atrium could potentially surpass the U-Net plateau.
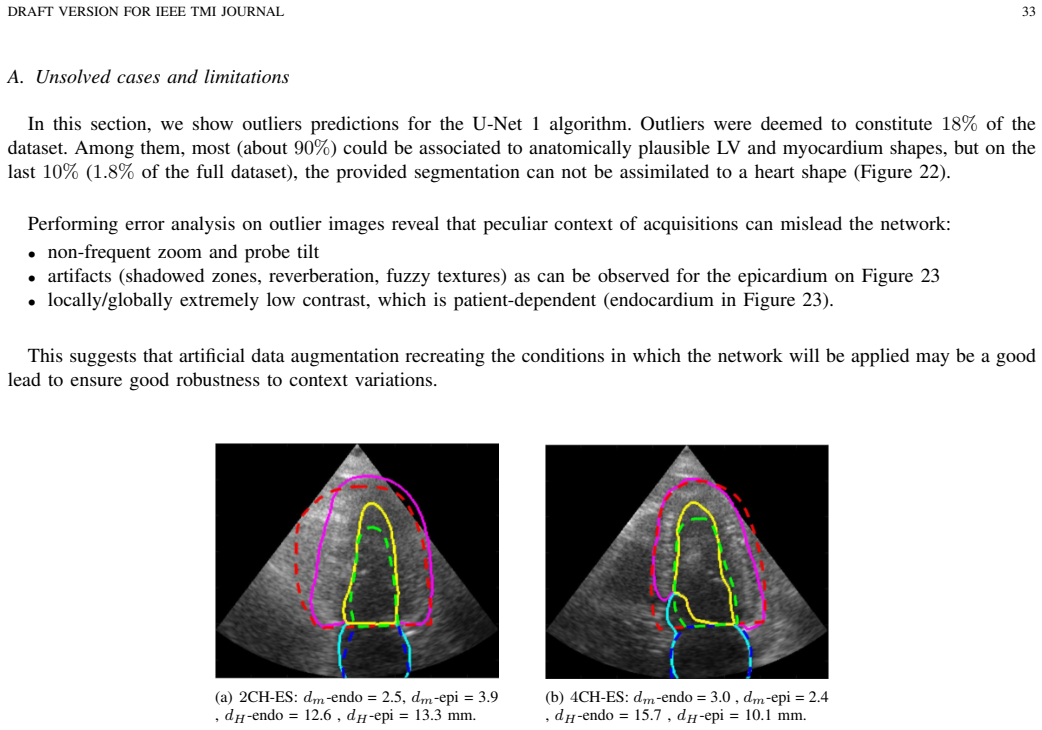
- Editorial inference: the observed outlier rate of about 18%, close to the expert's own re-annotation rate of 13%, points to a concrete goal: data augmentation that reproduces unusual probe tilts, zoom, and shadowing, which the paper's error analysis identifies as the main causes of failures.
Signed reviews
Editorial analysis
A structured set of objections, weighed in public.
Referee Report
Summary. The paper introduces CAMUS, a publicly available dataset of 500 patients with 2D four- and two-chamber echocardiographic sequences, manual annotations of the left ventricular endocardium, epicardium, and left atrium by one cardiologist on the full dataset and by three cardiologists on a 50-patient fold, plus repeated annotations for intra-observer analysis. The authors benchmark five encoder-decoder networks (two U-Net variants, ACNN, SHG, U-Net++) against two non-deep-learning baselines (SRF and BEASM, in fully- and semi-automatic versions) using 10-fold cross-validation. They report that the deep networks outperform the non-deep baselines on geometric metrics, that U-Net offers the best accuracy/parameter trade-off, that training on more than about 250 patients yields diminishing returns, and that the deep models estimate end-diastolic and end-systolic volumes with high correlation (0.95) and low absolute error (9.5 ml) relative to the reference expert, while ejection fraction estimates show lower correlation (0.80) and MAE 5.6%. The paper also analyzes the effect of image quality, multi-structure training, and expert-specific annotation behavior.
Significance. The CAMUS dataset is a substantial community resource: it is the largest publicly available fully annotated 2D echocardiography dataset, with a rigorous annotation protocol, inter- and intra-observer variability measurements, and a public benchmark platform. The evaluation is unusually thorough for the field: 10-fold cross-validation, strict Wilcoxon tests, additional experiments on training set size, image quality, and expert-specific models, plus extensive supplementary material including Bland-Altman plots and outlier analyses. If the results are taken as stated, the conclusion that simple U-Net architectures match or exceed more complex encoder-decoder designs on this task is a useful, reproducible finding. The study also provides concrete evidence on the number of training patients needed (roughly 200-250) and on the limits of current deep models for ejection fraction estimation, which is a clinically important and honest negative result.
major comments (3)
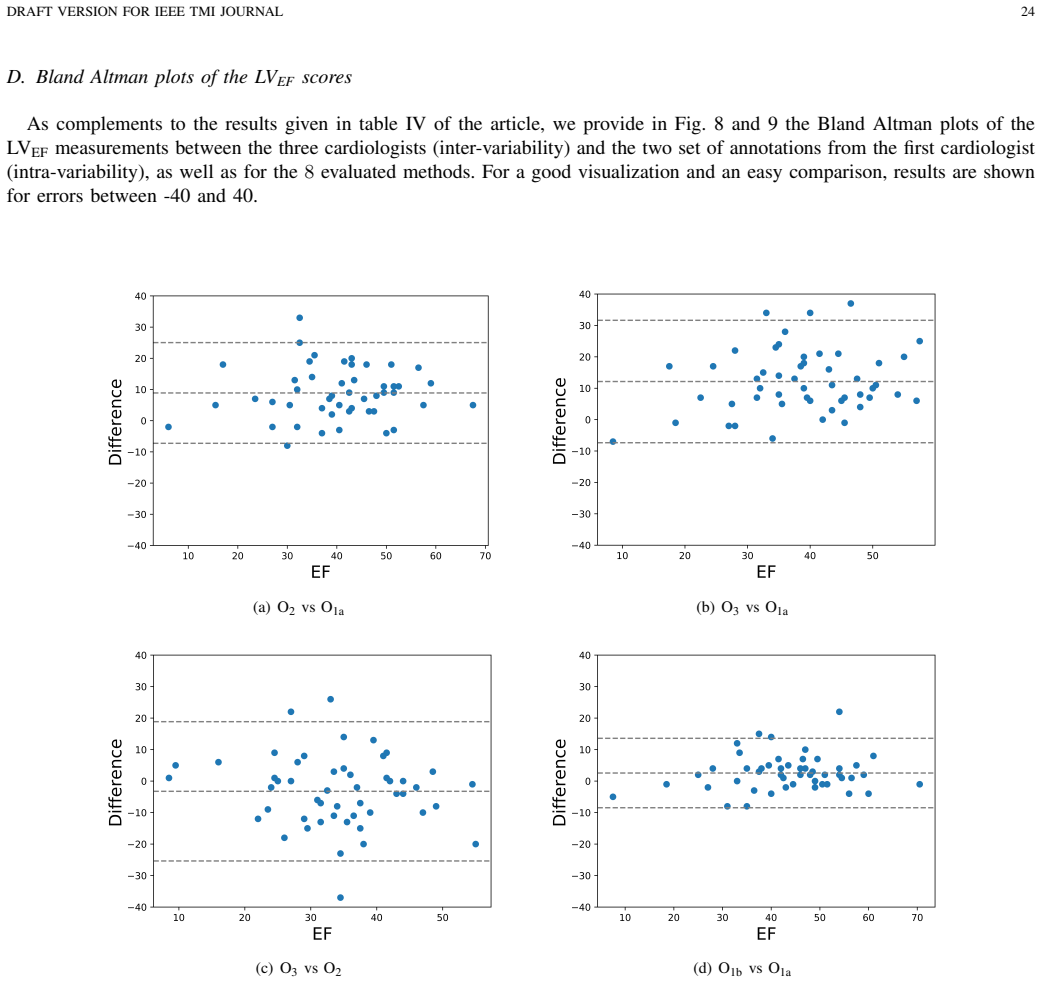
- [III-B-2 and Table IV] The headline clinical numbers (correlation 0.95, MAE 9.5 ml for volumes; correlation 0.80, MAE 5.6% for EF) are all computed against a single reference expert, O1a, with ED/ES frames chosen as the frames of largest/smallest LV dimension without ECG gating. As the authors themselves state in Section III-B-2, this frame-selection strategy is 'not the most accurate way, especially in the presence of abnormalities,' and Table IV shows very large inter-observer differences (e.g., O2-vs-O3 LVEF correlation of 0.569). The abstract's statement that EDNs 'faithfully reproduce the expert analysis' is therefore accurate only as a statement of fidelity to O1a's contouring and frame-choice behavior, not as clinical accuracy against a guideline-defined standard. I request that the abstract and conclusions be reworded to make this distinction explicit, and that the authors add, at least for the 50-patient multi-expert fold, a sensitivity analysis reporting clinical metrics against O2 and O3 as alternative references.
- [Section V (before Table III) and abstract] All primary segmentation and clinical metrics in the main tables exclude the 19% poor-quality images (94 patients), as stated in Section V. The abstract, however, reports the volume correlation and MAE without this caveat, which could mislead readers into thinking the numbers apply to the full 500-patient dataset. The supplementary Table IX does provide poor-quality results, but I recommend stating the exclusion explicitly in the abstract and reporting the combined or poor-quality results in the main text, since generalization to real clinical data depends on performance across all image qualities.
- [V-D-5] The claim that 'EDN results are better than the inter-observer scores, on all structures and metrics' compares EDN metrics computed on 406 patients with inter-observer metrics computed on only 40 patients from fold 5. This is not an apples-to-apples comparison: the sample sizes, case mix, and annotation conditions differ. Supplementary Table VII does provide EDN metrics on the same 40-patient fold, and the discussion should base its inter-/intra-observer comparison on those numbers rather than on the full-dataset scores, to avoid a potentially misleading comparison.
minor comments (4)
- [Abstract and Section I] The phrase 'Although these results are below the inter-observer scores' in the abstract is ambiguous, since 'below' could mean worse; the intended meaning is that the errors are smaller than inter-observer errors. Please rephrase (e.g., 'are better than the inter-observer scores').
- [Table IV footnote] The intra-observer row (O1a vs O1b) reports an LVEF MAE of 0.9%, which seems implausibly low compared to the other intra-observer values and to the reported correlation of 0.896. Please verify this entry, since it appears in both Table IV and Table VIII in the supplementary material.
- [Section IV-A-4] The description of U-Net++ states that 'the original version had 9M parameters but we adapted it,' but the total parameter count in the text (1.1M) is not reconciled with the architectural changes described. A brief sentence explaining the reduction (e.g., reduced feature maps) would improve reproducibility.
- [Supplementary Table VI] The caption says 'Segmentation accuracy for ACNN architecture' but the table reports U-Net++ variants; this is a typo and should be corrected.
Circularity Check
No circular reduction: clinical metrics are computed from held-out segmentations via Simpson's rule against independent expert annotations; the mild self-referential baseline choices are not load-bearing.
full rationale
The paper is an empirical benchmark rather than a derivation. The headline clinical figures are computed on held-out cross-validation folds against manually annotated expert contours, and the target indices are not fitted: 'Those indices were computed with the Simpson's rule [21] from the segmentation results of each algorithm' (Sec. V-B-2), with all metrics computed against the O1a annotation set for the test folds. The ED/ES selection caveat ('In this work, ED and ES were selected as the frames where the LV dimension was at its largest or smallest, which is not the most accurate way, especially in the presence of abnormalities', Sec. III-B-2) is a reference-standard accuracy limitation, not a circular reduction, because the predicted volumes are not constructed to equal O1a's volumes. The self-citations on baselines ([3], [5], [26]) identify published, externally benchmarked non-deep-learning methods; although several authors overlap with the present paper, the comparison is empirical on held-out CAMUS data and the cited CETUS results are public. No equation defines a predicted quantity in terms of the target, and no fitted parameter is relabeled as a prediction. The reported inter-/intra-observer variability provides additional external context. Thus, no circular step is present; the mild self-referential elements in baseline selection and dataset construction do not make the central claim equivalent to its inputs.
Assumptions & free parameters
free parameters (4)
- ACNN shape regularization weight =
10^4
- ACNN autoencoder code size =
32
- U-Net++ architecture modifications =
dropout removed, no output averaging, U-Net 1 layer design, batch size 20
- U-Net 1/2 hyperparameters =
see Table II
assumptions (5)
- domain assumption Manual annotations by cardiologist O1a are treated as ground truth for all 500 patients.
- domain assumption ED and ES frames are identified as the frames where LV dimension is largest/smallest, without ECG.
- standard math Simpson's biplane method of discs estimates LV volumes from two apical views.
- domain assumption The 10-fold cross-validation folds preserve the distribution of image quality and LVEF.
- domain assumption Image quality labels (good/medium/poor) from one expert O1a are stable and meaningful.
Cite this review
Pith. "Pith review of Deep Learning for Segmentation using an Open Large-Scale Dataset in 2D Echocardiography." pith.science (2026). https://pith.science/paper/PWBVRLUW
@misc{pith2026190806948,
  author       = {Pith},
  title        = {Pith review of: Deep Learning for Segmentation using an Open Large-Scale Dataset in 2D Echocardiography},
  year         = {2026},
  howpublished = {\url{https://pith.science/paper/PWBVRLUW}},
  note         = {Machine review of arXiv:1908.06948}
}
read the original abstract
Delineation of the cardiac structures from 2D echocardiographic images is a common clinical task to establish a diagnosis. Over the past decades, the automation of this task has been the subject of intense research. In this paper, we evaluate how far the state-of-the-art encoder-decoder deep convolutional neural network methods can go at assessing 2D echocardiographic images, i.e segmenting cardiac structures as well as estimating clinical indices, on a dataset especially designed to answer this objective. We therefore introduce the Cardiac Acquisitions for Multi-structure Ultrasound Segmentation (CAMUS) dataset, the largest publicly-available and fully-annotated dataset for the purpose of echocardiographic assessment. The dataset contains two and four-chamber acquisitions from 500 patients with reference measurements from one cardiologist on the full dataset and from three cardiologists on a fold of 50 patients. Results show that encoder-decoder based architectures outperform state-of-the-art non-deep learning methods and faithfully reproduce the expert analysis for the end-diastolic and end-systolic left ventricular volumes, with a mean correlation of 0.95 and an absolute mean error of 9.5 ml. Concerning the ejection fraction of the left ventricle, results are more contrasted with a mean correlation coefficient of 0.80 and an absolute mean error of 5.6 %. Although these results are below the inter-observer scores, they remain slightly worse than the intra-observer's ones. Based on this observation, areas for improvement are defined, which open the door for accurate and fully-automatic analysis of 2D echocardiographic images.
Figures


Figures from the paper (20 more)








Reference graph
Works this paper leans on
-
[1]
C. Armstrong, E. P. Ricketts, C. Cox, P. Adler, A. Arynchyn et al. , “Quality Control and Reproducibility in M-Mode, Two-Dimensional, and Speckle Tracking Echocardiography Acquisition and Analysis: The CARDIA Study, Year 25 Examination Experience,” Echocardiography, vol. 32, no. 8, pp. 1233–1240, 2015
work page 2015
-
[2]
O. Bernard, A. Lalande, C. Zotti, F. Cervenansky, et al., “Deep Learning Techniques for Automatic MRI Cardiac Multi-structures Segmentation and Diagnosis: Is the Problem Solved?” IEEE Transactions on Medical Imaging, in press, 2018. https://girder.readthedocs.io
work page 2018
-
[3]
O. Bernard, J. G. Bosch, B. Heyde, M. Alessandrini, D. Barbosa, S. Camarasu-Pop, F. Cervenansky, S. Valette, O. Mireaet al., “Standard- ized Evaluation System for Left Ventricular Segmentation Algorithms in 3D Echocardiography,”IEEE Transactions on Medical Imaging, vol. 35, no. 4, pp. 967–977, 2016
work page 2016
-
[4]
D. Barbosa, D. Friboulet, J. D’hooge, and O. Bernard, “Fast tracking of the left ventricle using global anatomical affine optical flow and local recursive block matching,” in Proc. MICCAI Challenge on Echocardio- graphic Three-Dimensional Ultrasound Segmentation (CETUS), Boston, MIDAS Journal, 2014, pp. 17–24
work page 2014
-
[5]
J. Pedrosa, S. Queir ´os, O. Bernard, J. Engvall, T. Edvardsen, E. Nagel, and J. D’hooge, “Fast and Fully Automatic Left Ventricular Segmenta- tion and Tracking in Echocardiography Using Shape-Based B-Spline Explicit Active Surfaces,” IEEE Transactions on Medical Imaging , vol. 36, no. 11, pp. 2287–2296, 2017
work page 2017
-
[6]
Ultrasound image segmentation: a survey,
J. A. Noble and D. Boukerroui, “Ultrasound image segmentation: a survey,” IEEE Transactions on Medical Imaging , vol. 25, no. 8, pp. 987–1010, 2006
work page 2006
-
[7]
G. Carneiro, J. C. Nascimento, and A. Freitas, “The Segmentation of the Left Ventricle of the Heart From Ultrasound Data Using Deep Learning Architectures and Derivative-Based Search Methods,” IEEE Transactions on Image Processing , vol. 21, no. 3, pp. 968–982, 2012
work page 2012
-
[8]
Automated border detection in three-dimensional echocardiography: principles and promises,
K. Y . E. Leung and J. G. Bosch, “Automated border detection in three-dimensional echocardiography: principles and promises,” Euro- pean Journal of Echocardiography , vol. 11, no. 2, pp. 97–108, 2010
work page 2010
Show all 40 references
-
[9]
Model-based left ventricle segmentation in 3d ultrasound using phase image,
C. Wang and O. Smedby, “Model-based left ventricle segmentation in 3d ultrasound using phase image,” in Proc. MICCAI Challenge on Echocardiographic Three-Dimensional Ultrasound Segmentation (CE- TUS), Boston, MIDAS Journal , 2014, pp. 81–88
2014
-
[10]
Real-time tracking of the left ventricle in 3d ultrasound using kalman filter and mean value coordinates,
E. Smistad and F. Lindseth, “Real-time tracking of the left ventricle in 3d ultrasound using kalman filter and mean value coordinates,” in Proc. MICCAI Challenge on Echocardiographic Three-Dimensional Ultrasound Segmentation (CETUS), Boston, MIDAS Journal , 2014, pp. 65–72
2014
-
[11]
Automatized evaluation of the left ventricular ejection fraction from echocardiographic images using graph cut,
M. Bernier, P. Jodoin, and A. Lalande, “Automatized evaluation of the left ventricular ejection fraction from echocardiographic images using graph cut,” in Proc. MICCAI Challenge on Echocardiographic Three-Dimensional Ultrasound Segmentation (CETUS), Boston, MIDAS Journal, 201...
2014
-
[12]
Left ventricle seg- mentation in cardiac ultrasound using hough-forests with implicit shape and appearance priors,
F. Milletari, M. Yigitsoy, N. Navab, and S. Ahmadi, “Left ventricle seg- mentation in cardiac ultrasound using hough-forests with implicit shape and appearance priors,” in Proc. MICCAI Challenge on Echocardio- graphic Three-Dimensional Ultrasound Segmentation (CETUS), Boston, ...
2014
-
[13]
Seg- mentation of multi-center 3d left ventricular echocardiograms by active appearance models,
M. van Stralen, A. Haak, K. Leung, G. van Burken, and J. Bosch, “Seg- mentation of multi-center 3d left ventricular echocardiograms by active appearance models,” in Proc. MICCAI Challenge on Echocardiographic Three-Dimensional Ultrasound Segmentation (CETUS), Boston, MIDAS Jou...
2014
-
[14]
Learn- ing shape representations for multi-atlas endocardium segmentation in 3D echo images,
O. Oktay, W. Shi, K. Keraudren, J. Caballero, and D. Rueckert, “Learn- ing shape representations for multi-atlas endocardium segmentation in 3D echo images,” in Proc. MICCAI Challenge on Echocardiographic Three-Dimensional Ultrasound Segmentation (CETUS), Boston, MIDAS Journal...
2014
-
[15]
Endo- cardial 3d ultrasound segmentation using autocontext random forests,
K. Keraudren, O. Oktay, W. Shi, J. Hajnal, and D. Rueckert, “Endo- cardial 3d ultrasound segmentation using autocontext random forests,” in Proc. MICCAI Challenge on Echocardiographic Three-Dimensional Ultrasound Segmentation (CETUS), Boston, MIDAS Journal , 2014, pp. 41–48
2014
-
[16]
Endocardial segmentation using structured random forests in 3D echocardiography,
J. Domingos, R. Stebbing, and J. Noble, “Endocardial segmentation using structured random forests in 3D echocardiography,” in Proc. MIC- CAI Challenge on Echocardiographic Three-Dimensional Ultrasound Segmentation (CETUS), Boston, MIDAS Journal , 2014, pp. 33–40
2014
-
[17]
2D left ventricle segmentation using deep learning,
E. Smistad, A. Østvik, B. O. Haugen, and L. Lovstakken, “2D left ventricle segmentation using deep learning,” in 2017 IEEE International Ultrasonics Symposium (IUS) , 2017, pp. 1–4
2017
-
[18]
U-Net: Convolutional Net- works for Biomedical Image Segmentation,
O. Ronneberger, P. Fischer, and T. Brox, “U-Net: Convolutional Net- works for Biomedical Image Segmentation,” in Proc. MICCAI , 2015, pp. 234–241
2015
-
[19]
Anatomically Constrained Neural Net- works (ACNNs): Application to Cardiac Image Enhancement and Seg- mentation,
O. Oktay, E. Ferrante, K. Kamnitsas, M. Heinrich, W. Bai, J. Caballero, S. A. Cook, A. de Marvao, T. Dawes, D. P. O‘Regan, B. Kainz, B. Glocker, and D. Rueckert, “Anatomically Constrained Neural Net- works (ACNNs): Application to Cardiac Image Enhancement and Seg- mentation,” ...
2018
-
[20]
3D U-Net: Learning Dense V olumetric Segmentation from Sparse DRAFT VERSION FOR IEEE TMI JOURNAL 13 Annotation,
¨O. C ¸ ic ¸ek, A. Abdulkadir, S. S. Lienkamp, T. Brox, and O. Ronneberger, “3D U-Net: Learning Dense V olumetric Segmentation from Sparse DRAFT VERSION FOR IEEE TMI JOURNAL 13 Annotation,” in Medical Image Computing and Computer-Assisted In- tervention – MICCAI 2016 . Cham: S...
2016
-
[21]
Assessment of left ventricular ejection fraction and volumes by real-time, two-dimensional echocardiography. A comparison of cineangiographic and radionuclide techniques,
E. D. Folland, A. F. Parisi, P. F. Moynihan, D. R. Jones, C. L. Feldman, and D. E. Tow, “Assessment of left ventricular ejection fraction and volumes by real-time, two-dimensional echocardiography. A comparison of cineangiographic and radionuclide techniques,” Circulation, vol...
1979
-
[22]
R. M. Lang, L. P. Badano, V . Mor-Avi, J. Afilalo et al. , “Recommen- dations for Cardiac Chamber Quantification by Echocardiography in Adults: An Update from the American Society of Echocardiography and the European Association of Cardiovascular Imaging,” Circulation, vol. 28, ...
2015
-
[23]
A survey on deep learning in medical image analysis,
G. Litjens, T. Kooi, B. E. Bejnordi, A. A. A. Setio, F. Ciompi, M. Ghafoorian, J. A. van der Laak, B. van Ginneken, and C. I. S ´anchez, “A survey on deep learning in medical image analysis,” Med. Image Anal., vol. 42, pp. 60 – 88, 2017
2017
-
[24]
Stacked hourglass networks for human pose estimation,
A. Newell, K. Yang, and J. Deng, “Stacked hourglass networks for human pose estimation,” in Computer Vision – ECCV 2016 , B. Leibe, J. Matas, N. Sebe, and M. Welling, Eds. Cham: Springer International Publishing, 2016, pp. 483–499
2016
-
[25]
Unet++: A nested u-net architecture for medical image segmentation,
Z. Zhou, M. Siddiquee, N. Tajbakhsh, and J. Liang, “Unet++: A nested u-net architecture for medical image segmentation,” in in proc. of Deep Learning in Medical Image Analysis and Multimodal Learning for Clinical Decision Support , 2018, pp. 3–11
2018
-
[26]
A fully auto- matic and multi-structural segmentation of the left ventricle and the myocardium on highly heterogeneous 2D echocardiographic data,
S. Leclerc, T. Grenier, F. Espinosa, and O. Bernard, “A fully auto- matic and multi-structural segmentation of the left ventricle and the myocardium on highly heterogeneous 2D echocardiographic data,” in IEEE International Ultrasonics Symposium (IUS) , 2017
2017
-
[27]
Fast Edge Detection Using Structured Forests,
P. Doll ´ar and C. L. Zitnick, “Fast Edge Detection Using Structured Forests,” IEEE Transactions on Pattern Analysis and Machine Intel- ligence, vol. 37, no. 8, pp. 1558–1570, 2015
2015
-
[28]
B-Spline Explicit Active Surfaces: An Efficient Framework for Real-Time 3-D Region-Based Segmentation,
D. Barbosa, T. Dietenbeck, J. Schaerer, J. D’hooge, D. Friboulet, and O. Bernard, “B-Spline Explicit Active Surfaces: An Efficient Framework for Real-Time 3-D Region-Based Segmentation,” IEEE Transactions on Image Processing, vol. 21, no. 1, pp. 241–251, 2012
2012
-
[29]
Left Ventricular Myocardial Segmentation in 3-D Ultrasound Recordings: Effect of Different Endocardial and Epicardial Coupling Strategies,
J. Pedrosa, D. Barbosa, B. Heyde, F. Schnell, A. R ¨osner, P. Claus, and J. D’hooge, “Left Ventricular Myocardial Segmentation in 3-D Ultrasound Recordings: Effect of Different Endocardial and Epicardial Coupling Strategies,” IEEE Transactions on Ultrasonics, Ferroelectrics, a...
2017
-
[30]
Fast and Fully Automatic 3-D Echocardio- graphic Segmentation Using B-Spline Explicit Active Surfaces: Feasibil- ity Study and Validation in a Clinical Setting,
D. Barbosa, T. Dietenbeck, B. Heyde, H. Houle, D. Friboulet, J. D’hooge, and O. Bernard, “Fast and Fully Automatic 3-D Echocardio- graphic Segmentation Using B-Spline Explicit Active Surfaces: Feasibil- ity Study and Validation in a Clinical Setting,” Ultrasound in Medicine & ...
2013
-
[31]
Details on the U-Net architectures and their implementation (Table I, II)
-
[32]
Impact of the main hyperparameters (Table III)
-
[33]
Overlapping densities of U-Net 1 and U-Net 2 for the geometrical results
-
[34]
Behavior of ACNNs on 2D echocardiography
-
[35]
Dice performance of the mono/multi/GM experiment (Figure 1)
-
[36]
Geometrical results on fold 5 restricted to good & medium image quality (Table VII)
-
[37]
Clinical metrics computed on fold 5 restricted to good & medium image quality (Table VIII)
-
[38]
Evolution of the number of outliers when increasing the training dataset size
-
[39]
Segmentation visual examples (Figure 4 to 11)
-
[40]
With my best regards, Sarah Leclerc, on behalf of the co-authors
Limitations examples (Figure 12 and 13). With my best regards, Sarah Leclerc, on behalf of the co-authors. DRAFT VERSION FOR IEEE TMI JOURNAL 15 VII. F URTHER DETAILS ON U-N ET 1 AND U-N ET 2 A. Detailed architectures The two U-Net implementations are summarized in tables I an...
Reviewed August 14, 2026 · model on record in the stance chip above.
Discussion (0). Continue with ORCID to comment.