REVIEW 3 major objections 3 minor 66 references
Infrared interferometric three-dimensional diagnosis of the atmospheric dynamics of the AGB star R Dor with VLTI/AMBER
T0 review · 3 major / 3 minor · reviewed 2026-08-14 · deepseek-v4-flash
Pith's one-line read This paper maps gas velocities at three atmospheric heights of the AGB star R Dor, finding deep layers nearly still while the outer CO layer streams outward at 7–15 km/s, the first resolved view of where an AGB wind accelerates.
desk verdict First multi-height velocity maps for an AGB star; the measurement is likely right, but the acceleration claim outruns the line-formation assumptions. read the letter →
The pith
A machine-rendered reading of the paper's core claim, the machinery that carries it, and where it could break.
The reading
What carries the argument
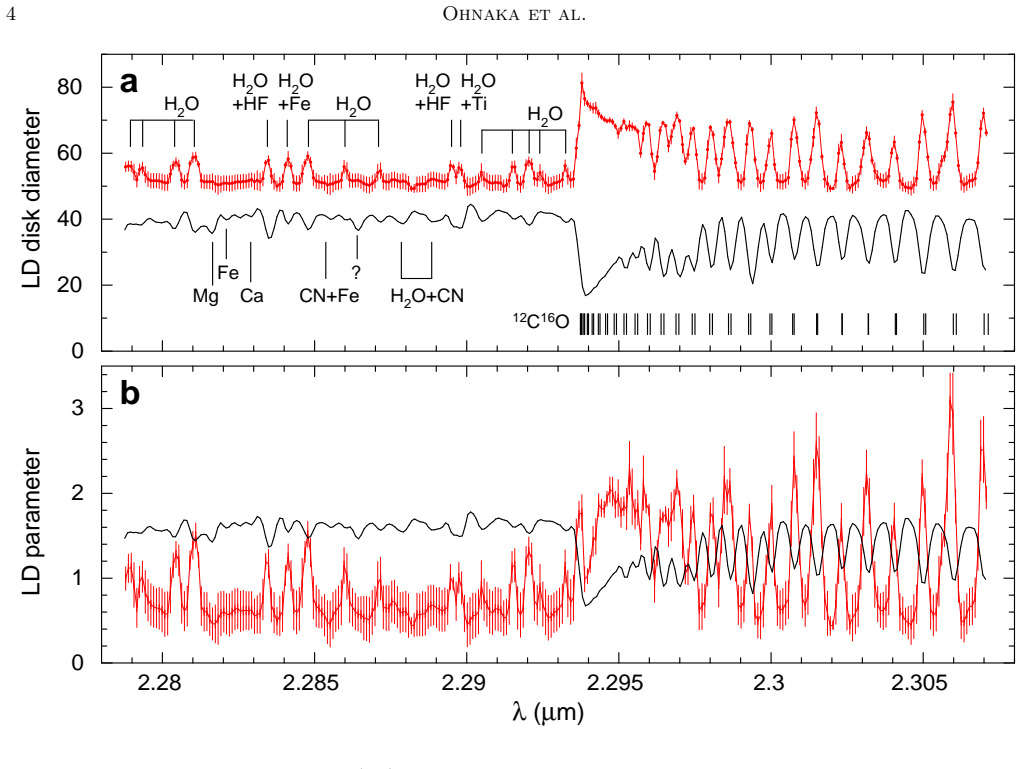
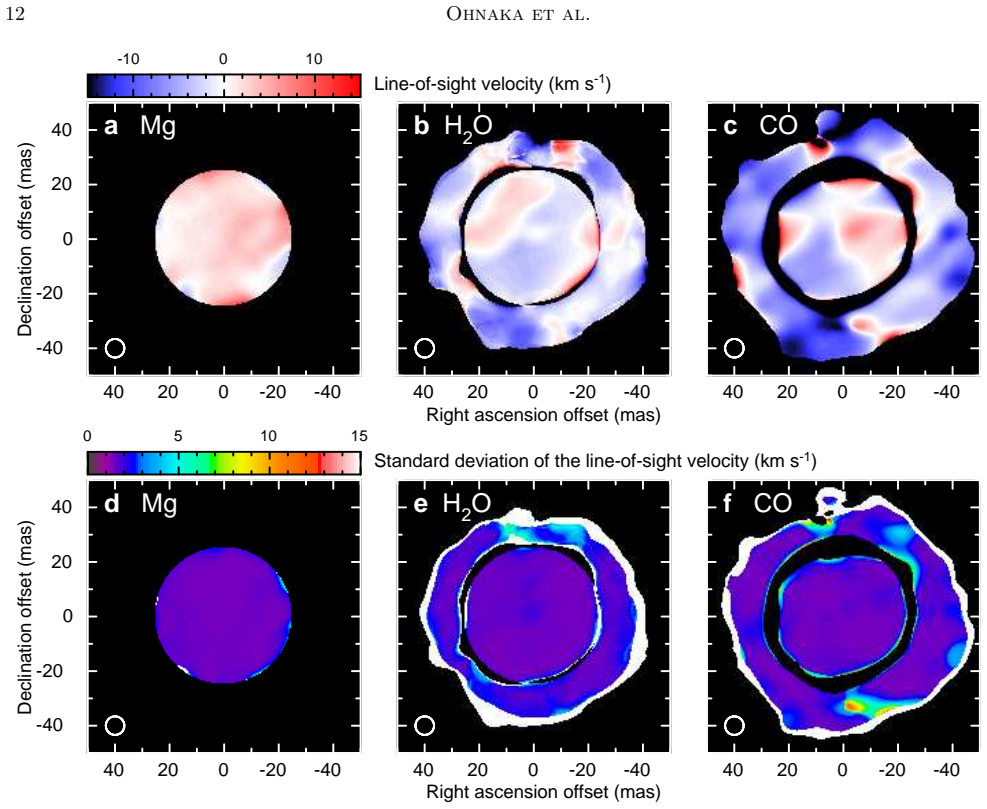
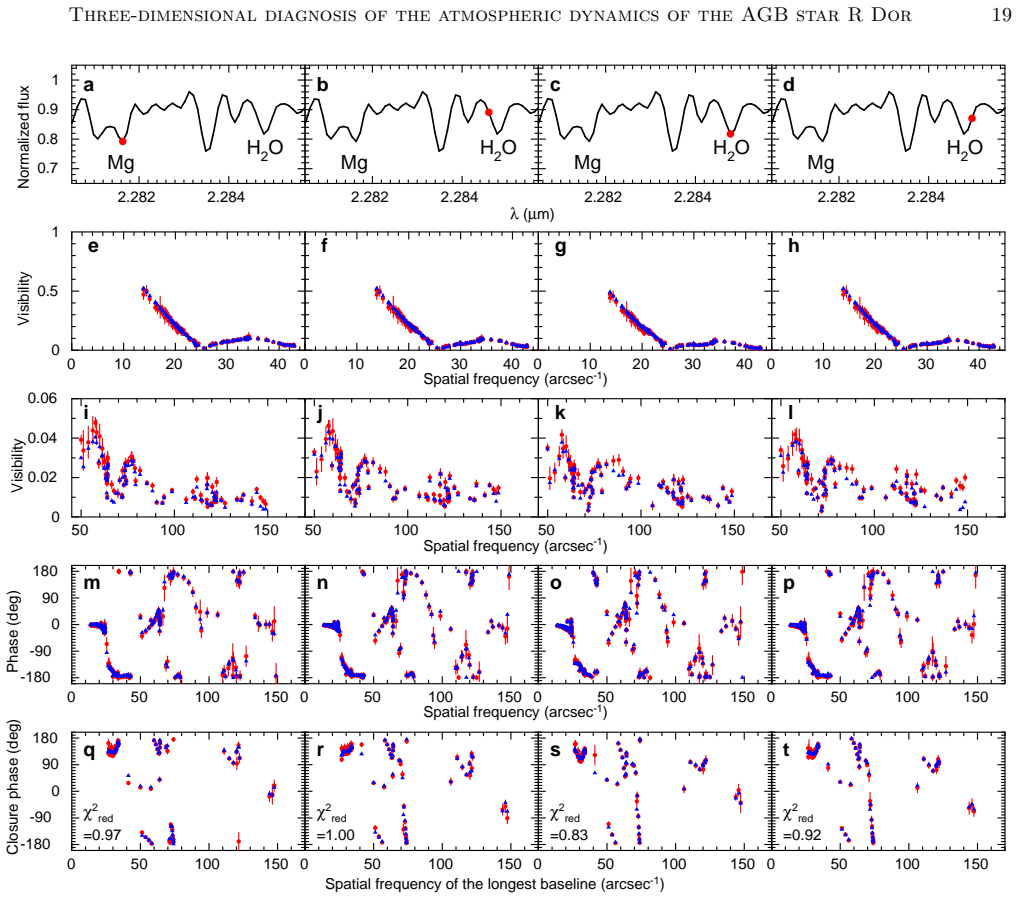
The load-bearing device is a height ladder of spectral lines observed simultaneously with VLTI/AMBER between 2.278 and 2.308 μm at spectral resolution 12,000 (binned to 8,000): the Mg line forms below ~1.13 R*, the H2O lines near ~1.5 R*, and the CO first-overtone lines out to ~1.8 R*, so each line tags a different geometrical height in the same snapshot. At each of the 309 wavelength channels, images are reconstructed with the MiRA algorithm using Fourier phases restored from differential-phase measurements and are convolved to the 6.8 mas beam; spatially resolved spectra are then cross-correlated against a hydrostatic MARCS synthetic spectrum to assign a line-of-sight velocity to every position. Comparing the three velocity-field maps turns the line-formation height into a radius-velocity measurement, converting unresolved Doppler information into a resolved acceleration profile.
What would settle it
A velocity-resolved radiative-transfer model of R Dor's 2.3 μm spectrum in which the CO lines form over a broad range of heights reaching into the near-static photosphere would break the height stratification: if such a model reproduces the observed 7–15 km/s blueshifts with no accelerating shell at 1.8 R*, the acceleration claim collapses. Observationally, an epoch of the same interferometric velocity-mapping at a different pulsation phase that shows the outward motion absent while dust at 1.5 R* remains present would demonstrate the motion is intermittent ballistic motion rather than steady wind acceleration.
Extended reading notes
Core claim
The paper's central claim is that R Dor's atmosphere has a sharp kinematic transition with height: layers probed by the Mg line at 2.28164 μm (below ~1.13 R*) and by three H2O lines near 2.28 μm (~1.5 R*) are quiet to within the 1.7 km/s measurement uncertainty, whereas the CO first-overtone lines reveal blueshifted, outward motion at 7–15 km/s over a substantial fraction of the surface and out to ~1.8 R*. Because dust is detected at ~1.5 R*, the authors interpret the velocity jump as strong acceleration in the shell between 1.5 and 1.8 stellar radii, most plausibly caused by radiation pressure on dust grains — though they stress that ballistic motion driven by convection or pulsation, and hence intermittency, cannot yet be excluded. The paper also presents the first resolved images of the extended atmosphere of a non-Mira AGB star and finds a bright surface region with about 25% intensity contrast, qualitatively consistent with three-dimensional convection simulations.
Load-bearing premise
The argument assumes the Mg, H2O, and CO lines form in thin, nested shells at the claimed heights (below about 1.13, about 1.5, and about 1.8 stellar radii) and that the three velocity maps trace the same outward-accelerating gas; those heights come from the spatial extent of the reconstructed images and earlier literature, not from a radiative-transfer model of R Dor's own atmosphere.
Editorial extensions
If this is right
- If the acceleration is real, the wind-launch zone of R Dor sits between about 1.5 and 1.8 stellar radii, coinciding with the dust-formation radius, which supports dust-driven wind models in which radiation pressure — possibly scattering on composite grains — accelerates the outflow.
- The measured outward velocities of 7–15 km/s exceed the wind's terminal velocity of about 5.5 km/s reached beyond 20 R*, so the same accelerating flow can explain the high-velocity components seen in submillimeter molecular lines.
- Spatially unresolved spectroscopy cannot see this outflow at all, because blueshifted CO absorption over the disk is filled in by blueshifted CO emission outside the limb; spatially resolved spectro-interferometry is therefore necessary to diagnose wind acceleration in such stars.
- The dynamics of R Dor's extended atmosphere (systematic outflow) differ from those of the red supergiant Antares (turbulent clump motion, no systematic outflow), a first observational hint that wind-launching may differ between AGB stars and red supergiants.
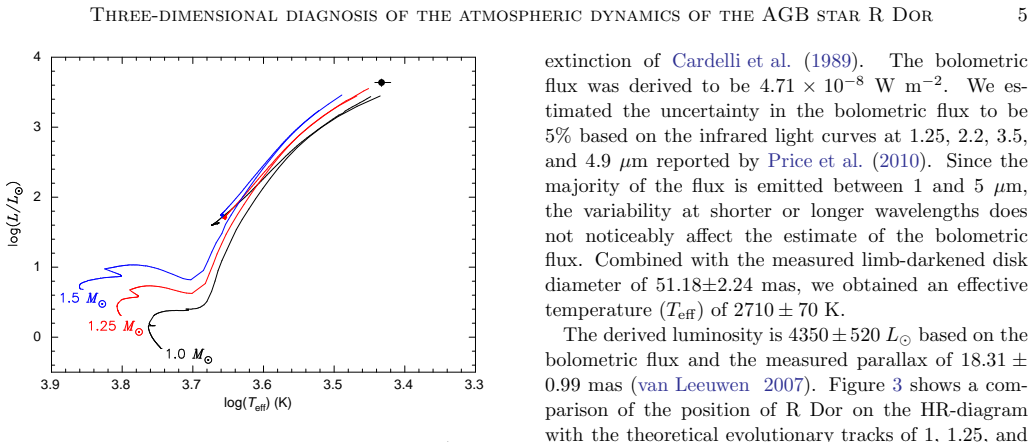
- Since the hydrostatic photosphere extends only to about 1.24 R*, the CO and H2O atmospheres out to 1.5–1.8 R* require a non-hydrostatic mechanism, and finding one in a low-amplitude semiregular variable widens the class of stars that can sustain extended dynamic atmospheres.
Reading between the lines
- If dust radiation pressure drives the acceleration, the fastest outward motion should be spatially matched to the clumpy dust clouds seen in polarimetric imaging; overlaying the CO velocity map on the dust-scattering maps would test this, with the southern 15 km/s region as the natural first target.
- Filling in the ladder with lines forming near 1.6 R* or including fundamental CO bands could distinguish a sharp acceleration kick between 1.5 and 1.8 R* from a gradual outward rise in velocity — a testable extension of the same method.
- Because the unresolved spectrum hides the outflow, some AGB stars previously classified as having static outer atmospheres on spectroscopic evidence may harbour undetected accelerating layers; a small survey of nearby AGB stars with the same technique would measure how common such hidden outflows are.
- Applying the same three-height velocity-mapping to stars spanning different pulsation amplitudes and mass-loss rates would reveal whether dust-driven acceleration is universal or one of several wind-launching modes in evolved cool stars.
Signed reviews
Editorial analysis
A structured set of objections, weighed in public.
Referee Report
Summary. The paper presents VLTI/AMBER spectro-interferometric observations of the AGB star R Dor, reconstructs images at 309 wavelength channels, and derives line-of-sight velocity maps from Mg, H2O, and CO lines. The authors report that the Mg and H2O lines, formed below ~1.5 R*, show little systematic motion, while the CO first-overtone lines show outward motion of 7-15 km/s at ~1.8 R*. They interpret this as strong acceleration of material between ~1.5 and ~1.8 R*, possibly driven by radiation pressure on dust, while acknowledging that the motion could be intermittent or ballistic. This would be the first spatially resolved, multi-height velocity diagnosis of an AGB star.
Significance. If the acceleration claim holds, the paper provides a qualitatively new constraint on the wind-acceleration region of an AGB star, directly complementing dust-formation radii inferred from polarimetry and the lack of outflow seen in ALMA at a later epoch. The observational work is careful: the uv coverage is good, image reconstruction is tested against simulated data with 18 different reconstruction setups, uncertainty maps are derived from the reconstruction scatter plus calibration terms, and the interferometric data are made public in OIFITS format. The main weakness is that the layer-to-layer velocity comparison rests on assumed line-formation heights and on the assumption that the Mg, H2O, and CO lines trace the same accelerating flow; these assumptions are not validated with a radiative-transfer or moving-atmosphere model.
major comments (3)
- [Sections 4.1 and 4.3] The assignment of line-formation heights (Mg ≤1.13 R*, H2O ~1.5 R*, CO ~1.8 R*) is based on the spatial extension of the reconstructed images and on the extent of a hydrostatic MARCS model, not on a radiative-transfer model of R Dor. Because the paper itself states in Section 4.3 that the CO lines are optically thick to the extreme limb, the spatially resolved CO spectrum at a given sky position is an opacity-weighted average over a range of radii along the line of sight, not a sample of gas at a single geometric height. Consequently, the layer-to-layer comparison of velocities does not by itself establish acceleration of a single flow between ~1.5 and ~1.8 R*; the Mg, H2O, and CO lines could trace distinct gas components or a broad height range. This is load-bearing for the central claim and requires either a radiative-transfer model of R Dor or a conservative rephrasing of the conclusion.
- [Appendix B] The simulated-data tests validate the image reconstruction for a static, known source, but they do not validate the velocity-extraction procedure. The line-of-sight velocities in Section 4.3 are derived by cross-correlating spatially resolved spectra, including off-limb emission spectra, with a hydrostatic MARCS absorption spectrum. No test demonstrates that this cross-correlation recovers a known input velocity field for emission lines or for optically thick CO lines. I request such a test, for example using synthetic spectra from a moving model atmosphere with a known velocity law, to confirm that the measured 7-15 km/s blueshifts are not biased by the choice of the reference spectrum or by the absorption-to-emission transition across the limb.
- [Section 5 and Abstract] The ALMA observations of Vlemmings et al. (2018), cited by the authors, show no outward motion within 4 R* at a different epoch, and the paper itself notes that the outward motion may be intermittent or ballistic. The abstract nevertheless presents a 'strong acceleration of material between ~1.5 and 1.8 R*' as a main result. Given the height-assignment issue raised above and the epoch discrepancy, the abstract and conclusion should more prominently qualify the acceleration claim as one possible interpretation rather than an established measurement.
minor comments (3)
- [Section 3.1 and Table 1] There are two typos: 'Adoped' in Table 1 should be 'Adopted', and the phrase 'limb-darkened disk diameter xsand distance' in Section 3.1 should read 'limb-darkened disk diameter and distance'.
- [Figures 7d-7f] The uncertainty maps in Figure 7d-7f show the total 1σ including the reconstruction scatter and calibration terms, but the color bars are labeled only with the standard deviation; it would help to state explicitly in the caption that these panels include the systematic terms quoted in the text.
- [Section 4.2, Figure 5 caption] In the caption of Figure 5, the reference to 'Figure 4f' in the sentence about blueshifts at position 4 appears to be a typo; the relevant panel is Figure 5f, not Figure 4f.
Circularity Check
No circularity: the velocity maps are measured against an external hydrostatic MARCS template and a literature systemic velocity, and the acceleration inference is an explicitly qualified interpretation rather than a self-referential fit.
full rationale
Section 4.3 derives line-of-sight velocities by cross-correlating spatially resolved spectra with a synthetic MARCS spectrum whose line wavelengths come from laboratory line lists and whose wavelength shift uses a systemic velocity (7.5 km/s LSR) adopted from independent radio/far-IR observations. No parameter is fitted to the observed blueshift; the measured 7–15 km/s outward motion is not constrained by construction. The formation heights (<1.13 R*, ~1.5 R*, ~1.8 R*) are inferred from the spatial extent of the reconstructed images in Section 4.1, not from the velocity data, so the acceleration claim is an interpretation whose validity depends on the assumed stratification and on H2O and CO tracing the same flow. That is a physical assumption the authors explicitly qualify in Section 5, including the possibility of intermittent or ballistic motion and the ALMA non-detection, not a circular derivation. The self-citations (Ohnaka et al. 2011, 2013, 2017b for reconstruction; Ohnaka et al. 2012, 2019 for CO opacity estimates) support methods or auxiliary opacity estimates, and the reconstruction is independently checked against simulated data in Appendix B with the same prior applied to all wavelength channels. Hence the paper is self-contained against external benchmarks, and no equation-level reduction or fitted-parameter-as-prediction circularity exists.
Assumptions & free parameters
free parameters (4)
- Fermi prior radius r_p =
20.0-25.0 mas
- Fermi prior steepness epsilon_p =
2.0-3.0 mas
- Limb-darkened disk diameter =
51.18 +/- 2.24 mas
- Limb-darkening parameter =
0.61 +/- 0.24
assumptions (4)
- domain assumption Systemic velocity of R Dor is 7.5 km/s in the local standard of rest (23.9 km/s heliocentric), adopted from published CO/radio measurements.
- domain assumption The hydrostatic MARCS synthetic spectrum with T_eff=2700 K, log g=0.0, M=1 M_sun, v_micro=2 km/s is an adequate zero-velocity template for the cross-correlation velocity measurement.
- domain assumption Line-formation heights: Mg below about 1.13 R*, H2O at about 1.5 R*, CO first overtone at about 1.8 R*.
- domain assumption The CO lines are optically thick and their blueshift is interpreted as Doppler motion of gas rather than opacity or imaging artifacts.
Cite this review
Pith. "Pith review of Infrared interferometric three-dimensional diagnosis of the atmospheric dynamics of the AGB star R Dor with VLTI/AMBER." pith.science (2026). https://pith.science/paper/P7IQRVW7
@misc{pith2026190806997,
  author       = {Pith},
  title        = {Pith review of: Infrared interferometric three-dimensional diagnosis of the atmospheric dynamics of the AGB star R Dor with VLTI/AMBER},
  year         = {2026},
  howpublished = {\url{https://pith.science/paper/P7IQRVW7}},
  note         = {Machine review of arXiv:1908.06997}
}
read the original abstract
The mechanism of mass loss in late evolutionary stages of low- and intermediate-mass stars is not yet well understood. Therefore, it is crucial to study the dynamics of the region within a few stellar radii, where the wind acceleration is considered to take place. We present three-dimensional diagnosis of the atmospheric dynamics of the closest asymptotic giant branch (AGB) star R Dor from the low photospheric layers to the extended outer atmosphere--for the first time for a star other than the Sun. The images reconstructed with a spatial resolution of 6.8 mas--seven times finer than the star's angular diameter of 51.2 mas in the continuum--using the AMBER instrument at the Very Large Telescope Interferometer show a large, bright region over the surface of the star and an extended atmosphere. The velocity-field maps over the star's surface and atmosphere obtained from the Mg and H2O lines near 2.3 micron forming at atmospheric heights below ~1.5 stellar radii show little systematic motion beyond the measurement uncertainty of 1.7 km/s. In marked contrast, the velocity-field map obtained from the CO first overtone lines reveals systematic outward motion at 7--15 km/s in the extended outer atmosphere at a height of ~1.8 stellar radii. Given the detection of dust formation at ~1.5 stellar radii, the strong acceleration of material between ~1.5 and 1.8 stellar radii may be caused by the radiation pressure on dust grains. However, we cannot yet exclude the possibility that the outward motion may be intermittent, caused by ballistic motion due to convection and/or pulsation.
Figures

Figures from the paper (8 more)





Reference graph
Works this paper leans on
-
[1]
ur Radioastronomie\\ Auf dem H\
thebibliography [1] 20pt to REFERENCES 6pt =0pt 10pt plus 3pt =0pt =0pt =1pt plus 1pt =0pt =0pt -12pt =13pt plus 1pt =20pt =13pt plus 1pt \@M =10000 =-1.0em =0pt =0pt 0pt =0pt =1.0em @enumiv\@empty 10000 10000 `\.\@m \@noitemerr \@latex@warning Empty `thebibliography' environment \@ifnextchar \@reference \@latexerr Missing key on reference command Each re...
2017
-
[2]
Adam, C., & Ohnaka, K.\ 2019, , in press, astro-ph/1907.05534
work page Pith review arXiv 2019
-
[3]
Arenou, F., Grenon, M., & G\'omez, A.\ 1992, , 258, 104
work page 1992
-
[4]
Bedding, T. R., Zijlstra, A. A., von der L\"uhe, O., et al.\ 1997, , 286, 957
work page 1997
-
[5]
A., Clayton, G
Cardelli, J. A., Clayton, G. C., & Mathis, J. S.\ 1989, , 345, 245
1989
-
[6]
Chelli, A., Hernandez Utrera, O., & Duvert, G.\ 2009, A&A, 502, 705
work page 2009
-
[7]
Decin, L., Richards, A. M. S., Danilovich, T., Homan, W., & Nuth, J. A.\ 2018, , 615, A28
work page 2018
- [8]
Show all 66 references
-
[9]
G.\ 2008, , 489, L5
Domiciano de Souza, A., Bendjoya, P., Vakili, F., Millour, F., & Petrov, P. G.\ 2008, , 489, L5
2008
-
[10]
R.\ 2002, Catalogue of Stellar Photometry in Johnson's 11-color system
Ducati, J. R.\ 2002, Catalogue of Stellar Photometry in Johnson's 11-color system
2002
-
[11]
J.\ 1993, An Introduction to the Bootstrap (New York, Chapman & Hall)
Efron, B., & Tibshirani, R. J.\ 1993, An Introduction to the Bootstrap (New York, Chapman & Hall)
1993
-
[12]
Freytag, B., Liljegren, S., & H\"ofner, S.\ 2017, , 600, A137
2017
-
[13]
Gonz\'alez Delgado, D., Olofsson, H., Kerschbaum, F., et al.\ 2003, , 411, 123
2003
-
[14]
Goorvitch, D.\ 1994, ApJS, 95, 535
1994
-
[15]
Gustafsson, B., Edvardsson, B., Eriksson, K., et al.\ 2008, , 486, 951
2008
-
[16]
H., & Barnes, T
Hinkle, K. H., & Barnes, T. G.\ 1979, , 227, 923
1979
-
[17]
H., Lebzelter, T., Joyce, R
Hinkle, K. H., Lebzelter, T., Joyce, R. R., & Fekel, F. C.\ 2002, , 123, 1002
2002
-
[18]
Homan, W., Danilovich, T., Decin, L., et al.\ 2018, , 614, A113
2018
-
[19]
H\"ofner, S.\ 2008, , 491, L1
2008
-
[20]
H\"ofner, S., Bladh, S., Aringer, B., & Ahuja, R.\ 2016, , 594, A108
2016
-
[21]
H\"ofner, S., & Olofsson, H.\ 2018, , 26, 1
2018
-
[22]
H\"ofner, S., & Freytag, B.\ 2019, , 623, A158
2019
-
[23]
Hestroffer, D.\ 1997, , 327, 199
1997
-
[24]
Hillen, M., Verhoelst, T., Degroote, P., Acke, B., & van Winckel, H.\ 2012, , 538, L6
2012
-
[25]
J., Tuthill, P
Ireland, M. J., Tuthill, P. G., Davis, J., & Tango, W.\ 2005, , 361, 337
2005
-
[26]
V., & Lambert, D
Jorissen, A., Smith, V. V., & Lambert, D. L.\ 1992, , 261, 164
1992
-
[27]
G., Johnson, H
J rgensen, U. G., Johnson, H. R., & Nordlund, \ 1992, , 261,263
1992
-
[28]
Khouri, T., Maercker, M., Waters, L. B. F. M., et al.\ 2016, , 591, A70
2016
-
[29]
Khouri, T., Vlemmings, W. H. T., Olofsson, H., et al.\ 2018, , 620, A75
2018
-
[30]
L., & Bell, B.\ 1995, Atomic Line Data, Kurucz CD-ROM No
Kurucz, R. L., & Bell, B.\ 1995, Atomic Line Data, Kurucz CD-ROM No. 23. Cambridge, Mass.: Smithsonian Astrophysical Observatory
1995
-
[31]
Perrin, G., et al.\ 2009, , 707, 632
Lacour, S., Thi\' e baut, E. Perrin, G., et al.\ 2009, , 707, 632
2009
-
[32]
Lagarde, N., Decressin, T., Charbonnel, C.\ 2012, , 543, A108
2012
-
[33]
Le Bouquin, J.-B., Absil, O., Benisty, M., et al.\ 2009, , 498, L41
2009
-
[34]
M., Quirrenbach, A., et al.\ 2011, , 529, A115
Mart\'i-Vidal, I., Marcaide, J. M., Quirrenbach, A., et al.\ 2011, , 529, A115
2011
-
[35]
C.\ 1987, , 71, 413
Mermilliod, J. C.\ 1987, , 71, 413
1987
-
[36]
Millour, F., Meilland, A., Chesneau, O., et al.\ 2011, , 526, A107
2011
-
[37]
Norris, B. R. M., Tuthill, P. G., Ireland, M. J., et al.\ 2012, , 220, 484
2012
-
[38]
Ohnaka, K., Hofmann, K.-H., Benisty, M., et al.\ 2009, , 503, 183
2009
-
[39]
Ohnaka, K., Weigelt, G., Millour, F., et al.\ 2011, , 529, A163
2011
-
[40]
Ohnaka, K., Hofmann, K.-H., Schertl, D., et al.\ 2012, A&A, 537, A53
2012
-
[41]
Ohnaka, K., Hofmann, K-.H., Schertl, D., et al.\ 2013, , 555, A24
2013
-
[42]
Ohnaka, K., Weigelt, G., Hofmann, K.-H.\ 2016, , 589, A91
2016
-
[43]
Ohnaka, K., Weigelt, G., Hofmann, K.-H.\ 2017, , 597, A20
2017
-
[44]
Ohnaka, K., Weigelt, G., Hofmann, K.-H.\ 2017, , 310, 548
2017
-
[45]
Ohnaka, K., Hadjara, M., & Maluenda Berna, M. Y. L.\ 2019, , 621, A6
2019
-
[46]
Paladini, C., Baron, F., Jorissen, A., et al.\ 2018, , 310, 553
2018
-
[47]
Park, S., et al.\ 2018, , 238, 29
2018
-
[48]
G., Malbet, F., Weigelt, G., et al.\ 2007, , 464, 1
Petrov, R. G., Malbet, F., Weigelt, G., et al.\ 2007, , 464, 1
2007
-
[49]
L., Kyuberis, A
Polyansky, O. L., Kyuberis, A. A., Zobov, N. F.\ 2018, , 480, 2597
2018
-
[50]
D., Smith, B
Price, S. D., Smith, B. J., Kuchar, T. A., Mizuno, D. R., & Kraemer, K. E.\ 2010, , 190, 203
2010
-
[51]
Ragland, S., Le Coroller, H., Pluzhnik, E., et al.\ 2008, , 679, 746
2008
-
[52]
Ryde, N., & Eriksson, K.\ 2002, , 386, 874
2002
-
[53]
N., Kazarovets, E
Samus, N. N., Kazarovets, E. V., Durlevich, O. V., Kireeva, N. N., Pastukhova, E. N., General Catalogue of Variable Stars: Version GCVS 5.1, 2017, Astronomy Reports, 2017, 61, 80
2017
-
[54]
R., Pauls, T
Schmitt, H. R., Pauls, T. A., Tycner, C., et al.\ 2009, , 691, 984
2009
-
[55]
C., Kraemer, K
Sloan, G. C., Kraemer, K. E., Price, S. D., & Shipman, R. F.\ 2003, , 147, 379
2003
-
[56]
S., Brooke, J
Sneden, C., Lucatello, S., Ram, R. S., Brooke, J. S. A., & Bernath, P.\ 2014, , 214, 26
2014
-
[57]
N., Tuthill, P
Stewart, P. N., Tuthill, P. G., Nicholson, P. D., Sloan, G. C., & Hedman, M. M.\ 2015, , 221, 30
2015
-
[58]
Tatulli, E., Millour, F., Chelli, A., et al.\ 2007, , 464, 29
2007
-
[59]
Thi\'ebaut, E.\ 2008, , 7013, 70131I
2008
-
[60]
Van de Sande, M., Decin, L., Lombaert, R., et al.\ 2018, , 609, A63
2018
-
[61]
van Leeuwen, F.\ 1997, , 474, 653
1997
-
[62]
Vlemmings, W. H. T., Khouri, T., De Beck, E., et al.\ 2018, , 613, L4
2018
-
[63]
Weigelt, G., Hofmann, K.-H., Schertl, D., et al.\ 2016, , 594, A106
2016
-
[64]
A., Driebe, T., et al.\ 2008, , 479, L21
Wittkowski, M., Boboltz, D. A., Driebe, T., et al.\ 2008, , 479, L21
2008
-
[65]
A., Ireland, M., et al.\ 2011, , 532, L7
Wittkowski, M., Boboltz, D. A., Ireland, M., et al.\ 2011, , 532, L7
2011
-
[66]
Wittkowski, M., Hofmann, K.-H., H\"ofner, S., et al.\ 2017, , 601, A3
2017
Reviewed August 14, 2026 · model on record in the stance chip above.
Discussion (0). Continue with ORCID to comment.