REVIEW 3 major objections 6 minor 37 references
Determination of Electron Band Structure using Temporal Interferometry
T0 review · 3 major / 6 minor · reviewed 2026-08-14 · deepseek-v4-flash
Pith's one-line read A temporal two-slit interferometer built from high-harmonic emission recovers a semiconductor's band structure from a single spectrum.
desk verdict Simulation-only proposal for single-shot band-structure retrieval from HHG fringes; the core relation is plausible and worth pursuing, but the two-burst premise needs quantitative testing before the strong claims hold. read the letter →
The pith
A machine-rendered reading of the paper's core claim, the machinery that carries it, and where it could break.
The reading
What carries the argument
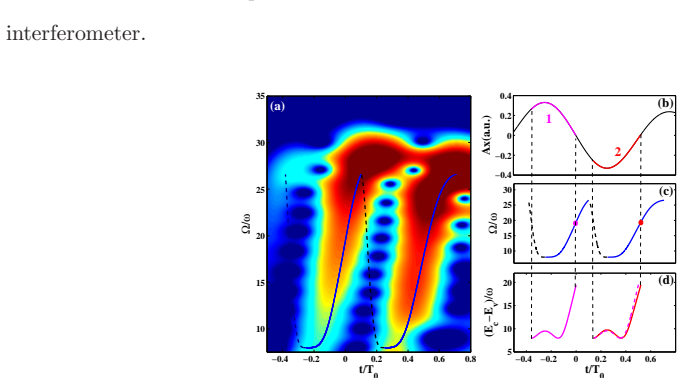
The load-bearing object is the temporal Young's interferometer formed by two emission bursts of HHG in a few-cycle field. It converts a time-domain two-slit geometry into energy-domain fringes through the relation $\Omega = (T_0/2\Delta t)O_q - \Delta S/\Delta t$; the slit gap $\Delta t$ and phase difference $\Delta S$ are computed from the saddle-point equations that connect ionization times, emission times, and the band-gap energy along the laser-driven trajectory. The inversion machinery is completed by expanding the band-gap dispersion as a Fourier cosine series $\epsilon(k_x) = \epsilon_g + \sum_{s=1}^5 c_s \cos(s k_x a_x)$, with the minimum gap $\epsilon_g$ taken from linear optics, and determining the five coefficients $c_s$ from ten harmonic-peak frequencies through a self-consistent iterative scheme rather than a brute-force spectral fit.
What would settle it
Take a crystal whose band structure has already been measured independently, record one few-cycle HHG spectrum, invert the fringe relation as described, and compare the recovered dispersion over the full Brillouin zone with the known one; if the discrepancy exceeds the claimed momentum resolution of about $\delta k \sim 0.02$ a.u., or if adding an intraband-current contribution moves the fringe peaks, the central claim fails.
Extended reading notes
Core claim
The central claim is that temporal two-slit interference of interband high-harmonic emission encodes the electron band structure directly in the energy-domain fringe pattern, so inverting the fringe relation recovers the band dispersion from a single few-cycle HHG spectrum. For a few-cycle driver the ionization is confined to two adjacent half cycles near the pulse peak; the two emission bursts act as slits separated by a delay $\Delta t$ and a phase difference $\Delta S$. Constructive interference gives harmonic peaks at $\Omega = (T_0/2\Delta t)O_q - \Delta S/\Delta t$, where $O_q$ is the odd-harmonic comb of a multi-cycle driver, and $\Delta t$ and $\Delta S$ are fixed by the saddle-point equations relating ionization and emission times to the conduction-valence energy difference. The paper demonstrates the inversion numerically on ZnO: writing the band gap as a five-term Fourier cosine series and fitting the harmonic-peak positions self-consistently reproduces the target band structure, and the recovered peaks agree with the semiconductor-Bloch-equation simulation to better than $10^{-3}$ in frequency. The method is claimed to be single-shot because it needs only one harmonic spectrum, not an intensity or delay scan, and does not require calculating HHG spectra for trial bands.
Load-bearing premise
The whole inversion depends on the assumption that, for harmonic energies above the minimum band gap, the emitted spectrum is dominated by exactly two bursts of recombination emission whose time separation and phase difference follow the saddle-point equations; if other emission processes shift the interference fringes, the reconstructed band structure will be biased.
Editorial extensions
If this is right
- A single HHG spectrum, rather than a series of intensity- or delay-resolved spectra, is enough to determine the band dispersion, so the measurement cost drops to one laser shot.
- Because the probe is optical photons rather than photoelectrons, the method works for bulk materials and under ambient conditions where photoemission-based measurements cannot.
- The few-cycle probe duration is short compared with typical ultrafast solid-state dynamics, so the scheme can be combined with pump-probe methods to track time-dependent band structure modifications.
- The retrieved momentum resolution of about $\delta k \sim 0.02$ a.u. and harmonic-frequency agreement below $10^{-3}$ indicate the precision of the method in the simulated ZnO case.
- The same inversion applies to any material whose harmonic yield beyond the minimum band gap is dominated by two identifiable interband emission bursts, including materials with multiple bands when the target-band signal can be isolated.
Reading between the lines
- A direct test of the method's scope would be to repeat the single-shot inversion on a material whose band structure is already known from photoemission; agreement over the whole Brillouin zone would generalize the two-burst assumption beyond ZnO.
- Because the inversion uses only the peak frequencies and not the harmonic intensities, it may remain valid in regimes where emission amplitudes are hard to model, which would make it robust for strongly driven materials.
- The same temporal-interferometer reading could be used to monitor the shift of a single harmonic peak as a fast proxy for band-gap changes in pump-probe experiments, without reconstructing the full dispersion at every delay.
- The requirement of a known minimum gap from linear optics means the method recovers the shape and curvature of the dispersion; a fully self-contained version would need an independent absolute-gap input.
Signed reviews
Editorial analysis
A structured set of objections, weighed in public.
Referee Report
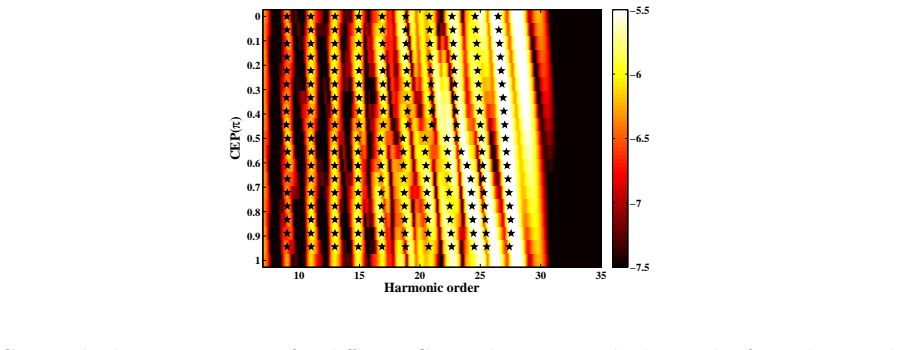
Summary. The manuscript proposes an all-optical method to reconstruct the band structure of a semiconductor from a single high-harmonic spectrum. The key idea is that two emission bursts from adjacent half-cycles of a few-cycle laser pulse form a temporal Young interferometer; the constructive-interference condition, Eq. (7), relates the harmonic peak frequencies to the time delay Δt and the interband phase difference ΔS between the two bursts. The authors compute Δt and ΔS from the saddle-point equations, Eq. (8), validate the resulting fringe prediction against semiconductor Bloch equation (SBE) simulations for ZnO over a range of carrier-envelope phases, and then invert the relation to recover a five-term Fourier expansion of the kx-dependent band gap from ten peak positions of a single simulated spectrum at CEP φ=0. They report retrieval errors below 10^-3 in peak frequency, a momentum resolution δk ≈ 0.02 a.u., and robustness to ±5% intensity and ±50 mrad CEP fluctuations.
Significance. If the method works as claimed, it offers a genuinely different route to bulk, ambient-condition band-structure characterization than ARPES and avoids the multi-shot parameter scans and trial-band fitting of earlier HHG-based approaches. A clear strength is that the forward fringe prediction in Fig. 2 is parameter-free given the band structure and is checked against independent SBE simulations. The numerical demonstration also uses realistic laser and material parameters, which aids reproducibility. However, the central claim rests on a dynamical premise—that the harmonic yield beyond the gap is dominated by exactly two interband bursts—that is only partially verified, and the inversion itself is a parameterized iterative fit rather than a closed-form reconstruction. The paper is a conceptually valuable proposal, but the load-bearing assumptions need quantitative testing before the claimed generality can be accepted.
major comments (3)
- [Eq. (7) and Figs. 2-5] The inversion formula Eq. (7) is derived from the two-slit intensity I(Ω) ∝ |1 + exp[i(ΩΔt + ΔS + π)]|^2, which is exact only when the harmonic yield is dominated by exactly two interband emission bursts with fixed delay and phase. The paper itself states, after Fig. 4, that 'the slight discrepancies between a two-slit interference and simulated experiments are induced by an additional emissions that emerge with increasing the CEP.' This is direct evidence that the two-burst premise is violated away from φ=0. Since the retrieval feeds the measured peak positions into Eq. (7), any additional burst or intraband contribution will shift the peaks and bias the retrieved band structure. The demonstration in Fig. 5 is performed at φ=0, where the premise is best, and no quantitative test is given for CEP values where the discrepancy appears. Please provide a quantitative estimate of the bias, for example by retrieving the band structure from simulated spectra at several CEPs and correlating the retrieval error with the residual between the two-slit prediction and the full SBE spectrum, or by specifying a criterion for selecting spectra for which the two-burst premise is valid.
- [Section on retrieval and Supplementary C] The self-consistent iterative inversion used to obtain the results in Fig. 5 is not described in the main text: the update rule for the coefficients c, the initialization, the convergence criterion, and the criteria for selecting the 'ten points' are all deferred to the supplementary material. Because the central numerical claims—the sub-10^-3 peak-frequency difference and the δk ≈ 0.02 a.u. momentum resolution—are produced by this algorithm, the demonstration is not reproducible from the manuscript as submitted. Please include the full algorithm, either in the main text or in an accessible supplementary file, so that the inversion can be independently implemented and tested.
- [Eq. (9) and Fig. 5(b)] The claim of 'directly reconstruct' the band structure overstates what is demonstrated. The reconstruction is a five-parameter fit within the fixed Fourier basis of Eq. (9), with the minimum gap ε_g supplied externally from linear optics, and the simulation probes only one crystal direction (k_y = k_z = 0 in the calculation). The accuracy of the result is therefore conditional on the truncation order s=5 and on the assumed separability of the gap along kx. The paper should explicitly state that the demonstrated reconstruction is a one-dimensional projection of the gap along Γ–M, quantify the sensitivity to the truncation order, and discuss how the full three-dimensional band structure would be assembled from measurements along different crystal orientations.
minor comments (6)
- [Eq. (1)] The source term σ in Eq. (1) is introduced but never defined; please state its explicit form and its relation to the interaction Hamiltonian.
- [Eq. (2)] The notation P(Ω, t) is unclear: it is not explained how this quantity is related to the harmonic intensity shown in Fig. 2 or to the interband current in Eq. (6). Please clarify the connection between the time-domain emission series and the frequency-domain spectrum used in the retrieval.
- [Eq. (4)] The lower limit t0 in the definition of the classical action S(K, t) is not specified; please state the initial time and its role in the gauge choice.
- [Text after Eq. (7)] The sentence 'we have ignored the amplitude difference of these two emissions' should be supplemented with the observation that unequal amplitudes change the fringe contrast but not the positions of the constructive peaks, so the neglect is harmless for peak-based retrieval; this would preempt a common objection.
- [Fig. 5(b)] The green shadow curves and the statement 'the momentum resolution amounts to δk ∼ 0.02 a.u.' need a precise definition: please specify how δk is computed from the uncertainty in c and from the laser-parameter fluctuations.
- [References and typos] There are minor presentation issues: 'Atom units' should read 'Atomic units'; reference [25] is missing the author list; and the supplementary material is cited as [28] but is not included with the arXiv submission, which should be made available for review.
Circularity Check
This paper is not circular: the band-structure retrieval is an inverse fit to independently SBE-generated spectra, and the self-citations are background rather than load-bearing.
full rationale
The central derivation is self-contained and the retrieval is tested against an independent simulation. Equation (7) is a constructive-interference condition for two emission bursts; the slit delay Δt and phase difference ΔS are computed from the saddle-point equations (8) for a trial band structure, not fitted to the peak positions used for reconstruction. The synthetic 'measurement' spectra are produced by solving the semiconductor Bloch equations (4)-(6) with the target dispersion, not by evaluating Eq. (7), so the agreement in Fig. 2 is an independent forward validation of the two-slit model. The inversion in Fig. 5 determines the five Fourier coefficients in Eq. (9) by matching the measured peak frequencies; the target band structure is not injected except for the minimum band gap εg, which the paper explicitly treats as an independently known input ('We assumes a known minimum band gap ǫg, which can be accurately measured with linear optical method'). The only self-citation is the formal emission-series expression Eq. (2) from the authors' prior work [27], but this is not load-bearing: the two-slit model is supported by SBE simulations and the saddle-point equations cite external work [35-37]. The paper's own acknowledgment that 'slight discrepancies ... are induced by an additional emissions that emerge with increasing the CEP' identifies a modeling-validity limitation, not a circular reduction. No equation is equivalent to its input by construction, and no fitted parameter is renamed as a prediction.
Assumptions & free parameters
free parameters (3)
- Fourier coefficients c1-c5 =
not tabulated; retrieved values plotted in Fig. 5(b)
- Minimum band gap ǫ_g =
ZnO value from prior linear optical measurement (assumed known)
- Dephasing time T2 =
2.5 fs
assumptions (8)
- domain assumption Interband emission dominates HHG beyond the minimum band gap; intraband currents are negligible.
- domain assumption Exactly two emission bursts in adjacent half-cycles form the temporal two-slit interferometer.
- domain assumption Saddle-point equations (Eq. 8) give correct ionization times, emission times, and the phase difference ΔS for a given band structure.
- ad hoc to paper The band gap is a sum of a known minimum gap and five cosine Fourier terms (Eq. 9).
- domain assumption The band dispersion is separable and the dynamics are effectively two-dimensional (kz=0).
- domain assumption The transition dipole is k-independent and fixed at the Γ-point value.
- domain assumption The few-cycle pulse is too short to modify the band structure during the measurement.
- domain assumption Couplings to other valence and conduction bands are negligible for the target bands.
Cite this review
Pith. "Pith review of Determination of Electron Band Structure using Temporal Interferometry." pith.science (2026). https://pith.science/paper/VQGFH5QH
@misc{pith2026190807283,
  author       = {Pith},
  title        = {Pith review of: Determination of Electron Band Structure using Temporal Interferometry},
  year         = {2026},
  howpublished = {\url{https://pith.science/paper/VQGFH5QH}},
  note         = {Machine review of arXiv:1908.07283}
}
read the original abstract
We propose an all-optical method to directly reconstruct the band structure of semiconductors. Our scheme is based on the temporal Young's interferometer realized by high harmonic generation (HHG) with a few-cycle laser pulse. As a time-energy domain interferometric device, temporal interferometer encodes the band structure into the fringe in the energy domain. The relation between the band structure and the emitted harmonic frequencies is established. This enables us to retrieve the band structure from the HHG spectrum with a single-shot measurement. Our scheme paves the way to study matters under ambient conditions and to track the ultrafast modification of band structures.
Figures

Figures from the paper (2 more)


Reference graph
Works this paper leans on
-
[1]
A. Damascelli, Z. Hussain, and Z. X. Shen, Rev. Mod. Phys. 75, 473 (2003)
work page 2003
-
[2]
A. M. Shuvaev, V. Dziom, N. N. Mikhailov, Z. D. Kvon, Y. Sha o, D. N. Basov, and A. 10 Pimenov, Phys. Rev. B 96, 155434 (2017)
work page 2017
-
[3]
S. Ghimire, A. D. DiChiara, E. Sistrunk, P. Agostini, L. F . DiMauro, and D. A. Reis, Nat. Phys. 7, 138 (2010)
work page 2010
- [4]
-
[5]
M. Hohenleutner, F. Langer, O. Schubert, M. Knorr, U. Hut tner, S. W. Koch, M. Kira, and R. Huber, Nature 523, 572 (2015)
work page 2015
-
[6]
Y. S. You, Y. Yin, Y. Wu, A. Chew, X. Ren, F. Zhuang, S. Ghola m-Mirzaei, M. Chini, Z. Chang, and S. Ghimire, Nat. Com. 8, 724 (2017)
work page 2017
-
[7]
Yoshikawa, T
N. Yoshikawa, T. Tamaya, and K. Tanaka, Science 356, 736 (2017)
2017
-
[8]
Y. Murakami, M. Eckstein, and P. Werner, Phy. Rev. Lett. 121 057405 (2018)
work page 2018
Show all 37 references
-
[9]
R. A. Ganeev, et al. , Opt. Express 26, 035013 (2018)
2018
-
[10]
Schiffrin, et al
A. Schiffrin, et al. , Nature 493, 70 (2012)
2012
-
[11]
Schultze, et al
M. Schultze, et al. , Nature 493, 75 (2012)
2012
-
[12]
B. Zaks, R. B. Liu, and M. S. Sherwin, Nature 483, 580 (2012)
2012
-
[13]
Langer, et al
F. Langer, et al. , Nature 533, 225 (2016)
2016
-
[14]
Langer, et al
F. Langer, et al. , Nature 557, 76 (2018)
2018
-
[15]
von Hoegen, R
A. von Hoegen, R. Mankowsky, M. Fechner, M. F¨ orst, and A. Cavalleri, Nature 555, 79 (2018)
2018
-
[16]
T. T. Luu, H. J. W¨ orner, Nat. Com. 9, 916 (2018)
2018
-
[17]
H. B. Banks, Q. Wu, D. C. Valovcin, S. Mack, A. C. Gossard, L. Pfeiffer, R. B. Liu, M. S. Sherwin, Phy. Rev. X 7 041042 (2017)
2017
-
[18]
C. Yu, S. Jiang, T. Wu, G. Yuan, Z. Wang, C. Jin, and R. Lu, P hy. Rev. B 98 085439 (2018)
2018
-
[19]
Wang, Tak-San Ho, and Shih-I Chu, J
C. Wang, Tak-San Ho, and Shih-I Chu, J. Phy. B: At. Mol. Op t. Phy. 49, 225401 (2016)
2016
-
[20]
T. T. Luu, M. Garg, S. Yu, A. Moulet, M. Th. Hassan, and E. G oulielmakis, Nature, 521, 498-502 (2015)
2015
-
[21]
Vampa, T
G. Vampa, T. J. Hammond, N. Thire, B. E. Schmidt, F. Legar e, C.R. McDonald, T. Brabec, D.D. Klug, P.B. Corkum, Phys. Rev. Lett. 115, 193603 (2015)
2015
-
[22]
A. A. Lanin, E. A. Stepanov, A. B. Fedotov, and A. M. Zhelt ikov, Optica 4, 516 (2016)
2016
-
[23]
W. K. Wootters, and W. H. Zurek, Phys. Rev. D 19, 473 (1979)
1979
-
[24]
M. O. Scully, B.-G. Englert, and H. Walther, Nature (Lon don) 351, 111 (1991)
1991
-
[25]
You et al, Opt. Lett. 42, 1816 (2017). 11
2017
-
[26]
Becker and M
W. Becker and M. Kleber, Phys. Scr. 94, 023001 (2019)
2019
-
[27]
L. Li, P. Lan, X. Zhu, T. Huang, Q. Zhang, M. Lein, and P. Lu , Phys. Rev. Lett. 122, 193901 (2019)
2019
-
[28]
Additional discussions of the results and details of th e iterative program
-
[29]
M. Wu, S. Ghimire, D. A. Reis, K. J. Schafer, and M. B. Gaar de, Phys. Rev. A 91, 043839 (2015)
2015
-
[30]
C. R. McDonald, G. Vampa, P. B. Corkum, and T. Brabec, Phy s. Rev. A 92, 033845 (2015)
2015
-
[31]
Vampa, C
G. Vampa, C. R. McDonald, G. Orlando, D. D. Klug, P. B. Cor kum, and T. Brabec, Phys. Rev. Lett. 113, 073901 (2014)
2014
-
[32]
Goano, F
M. Goano, F. Bertazzi, M. Penna, and E. Bellotti, J. Appl . Phys. 102, 083709 (2007)
2007
-
[33]
Golde, T
D. Golde, T. Meier, and S.W. Koch, Phys. Rev. B 77, 075330 (2008)
2008
-
[34]
T. T. Luu and H. J. W¨ orner, Phys. Rev. B 94, 115164 (2016)
2016
-
[35]
Vampa, C
G. Vampa, C. R. McDonald, G. Orlando, P. B. Corkum, and T. Brabec, Phys. Rev. B 91, 064302 (2015)
2015
-
[36]
Ikemachi, Y
T. Ikemachi, Y. Shinohara, T. Sato, J. Yumoto, M. Kuwata -Gonokami, and K. L. Ishikawa, Phys. Rev. A 95, 043416 (2017)
2017
-
[37]
Jiang, C
S. Jiang, C. Yu, G. Yuan, T. Wu, Z. Wang, and R. Lu, J. Phys. Condens. Matter 29, 275702 (2017). 12
2017
Reviewed August 14, 2026 · model on record in the stance chip above.
Discussion (0). Continue with ORCID to comment.