REVIEW 5 major objections 5 minor 7 references
Onset detection: A new approach to QBH system
T0 review · 5 major / 5 minor · reviewed 2026-08-14 · deepseek-v4-flash
Pith's one-line read A query-by-humming search engine can identify a song from note-onset timing alone, without storing or analyzing pitch.
desk verdict Onset-only QBH is a plausible idea with sound detection theory, but the headline claim of empirical superiority is not supported by the evidence in the paper. read the letter →
The pith
A machine-rendered reading of the paper's core claim, the machinery that carries it, and where it could break.
The reading
What carries the argument
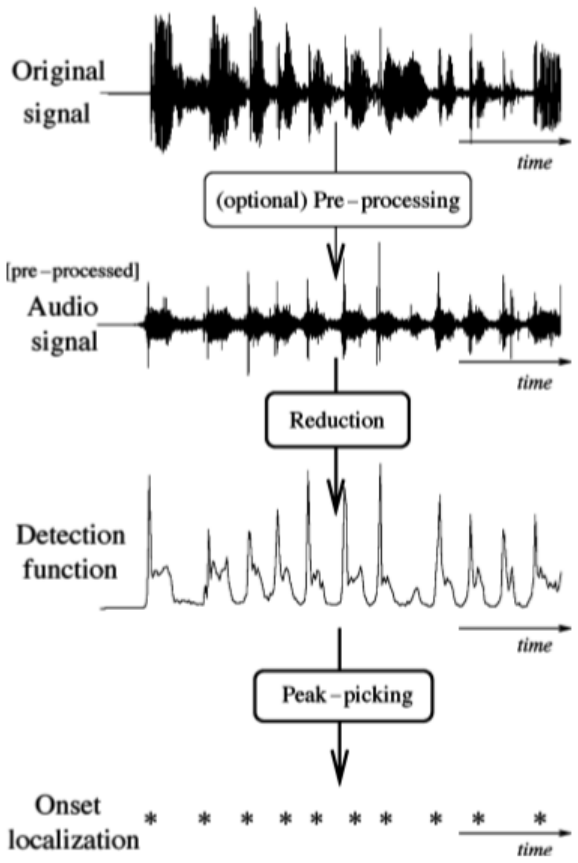
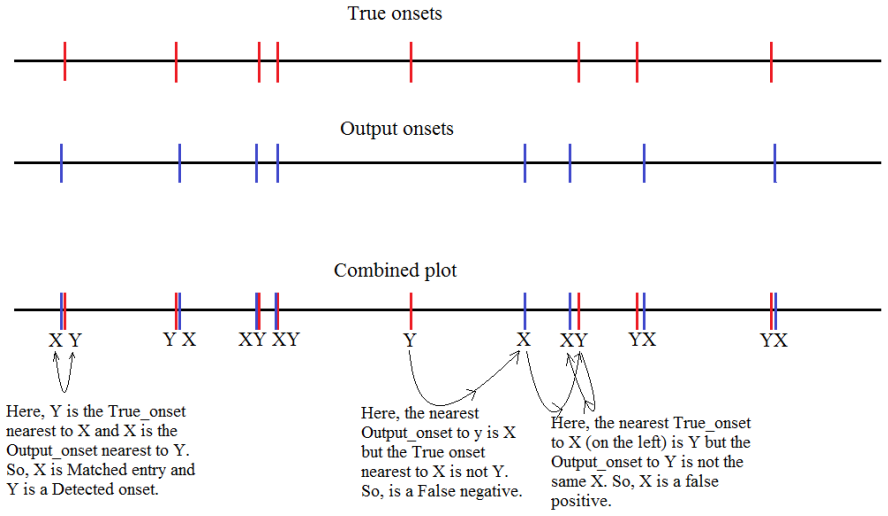
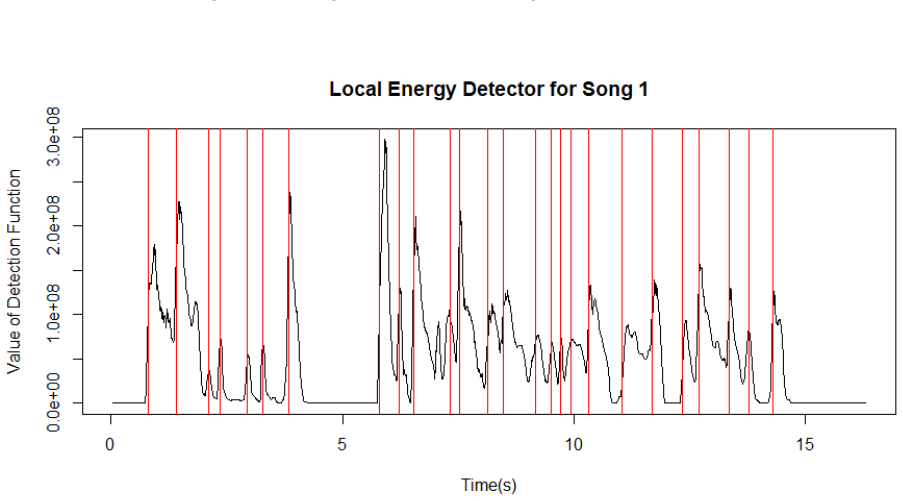
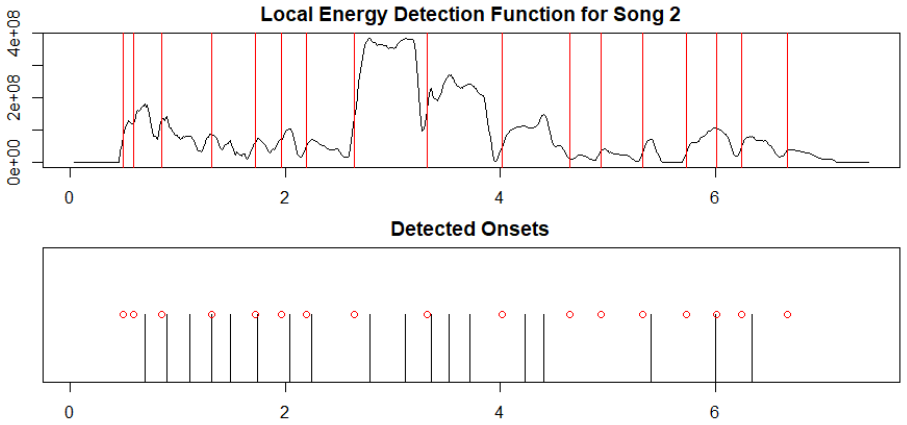
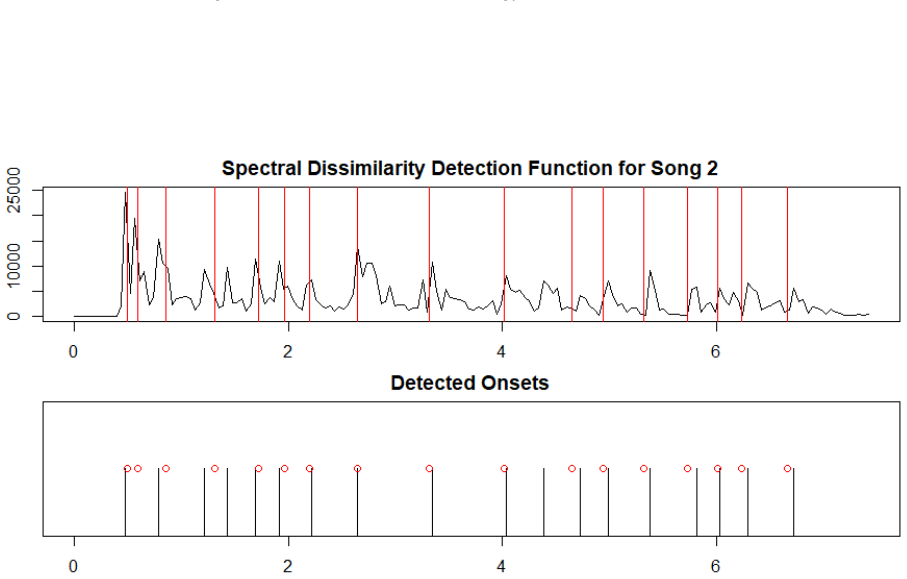
The load-bearing objects are the three detection functions, the subset-matching subroutine, and the correlative-matching search. The local energy detector sums squared samples in a sliding window and flags peaks; spectral dissimilarity sums positive magnitude changes across frequency bins below 1 kHz; dominant spectral dissimilarity tracks only positive changes in the maximum squared short-time Fourier magnitude. Subset matching labels each detected onset as a true positive or false positive by nearest-neighbour agreement with the database onsets. Correlative matching tries every linear rescaling of the true onsets onto the output onsets, computes Pearson correlation after subset matching, and multiplies by a correction factor $L^2/(mn)$ that penalizes false positives and false negatives. That correction factor is what keeps the ranking honest about detection errors.
What would settle it
The decisive check is to hum a different verse of the same song, or the same verse with an extra note inserted, and see whether the correlation score still puts the correct song first; the paper's own Section 7 concedes the system cannot locate the end of the first verse, so such a test directly probes the one-to-one matching assumption.
Extended reading notes
Core claim
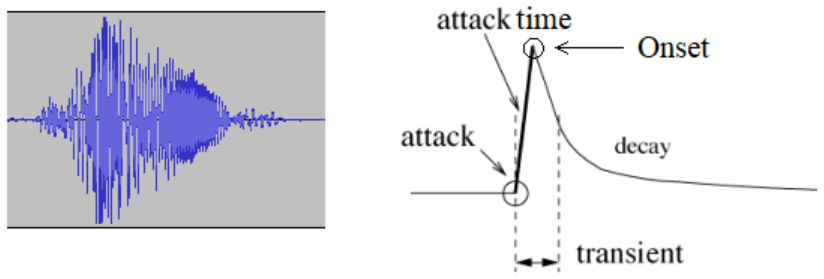
On the paper's own terms, the discovery is that the timing of note attacks, the onsets, is a sufficient statistic for song identity in a humming-retrieval task. Concretely, the authors claim that storing only the onsets of the first line of each database song, and detecting only onsets in the query, lets a correlation-based ranking recover the correct song in all three experiments with the dominant spectral dissimilarity detector, and in most cases with the other two detectors. The paper also gives a statistical analogy: local energy detection is a generalized likelihood-ratio test for white Gaussian noise against an unknown signal; spectral dissimilarity responds to positive changes across frequency bins; dominant spectral dissimilarity applies a periodogram-maximum test to the dominant frequency. This grounds the detection functions in detection theory rather than pure heuristics.
Load-bearing premise
The retrieval pipeline depends on the hummed query containing the same verse as the stored database entry and, after a uniform tempo change, on every query onset having one counterpart in the database.
Editorial extensions
If this is right
- A QBH database can store just a handful of onset times per song rather than audio or MIDI, so scaling to large catalogs becomes mostly a ranking-speed problem.
- Because matching is rhythmic rather than melodic, an off-key or imperfect-pitch hum can still retrieve the song as long as note timing is roughly preserved.
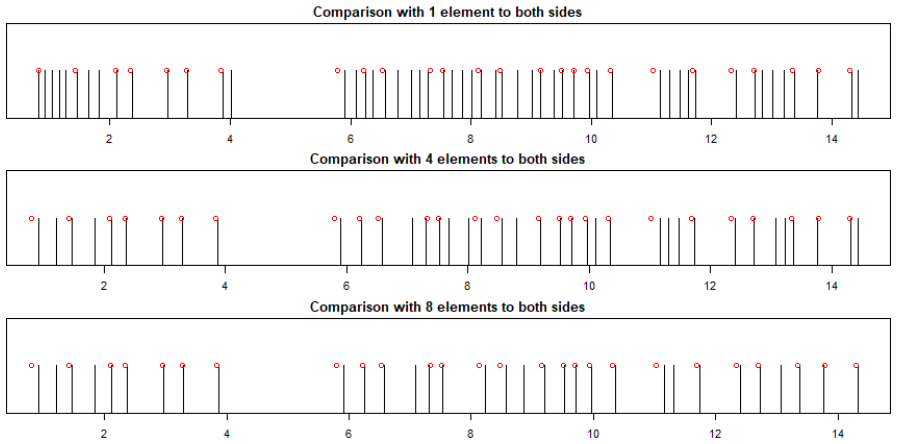
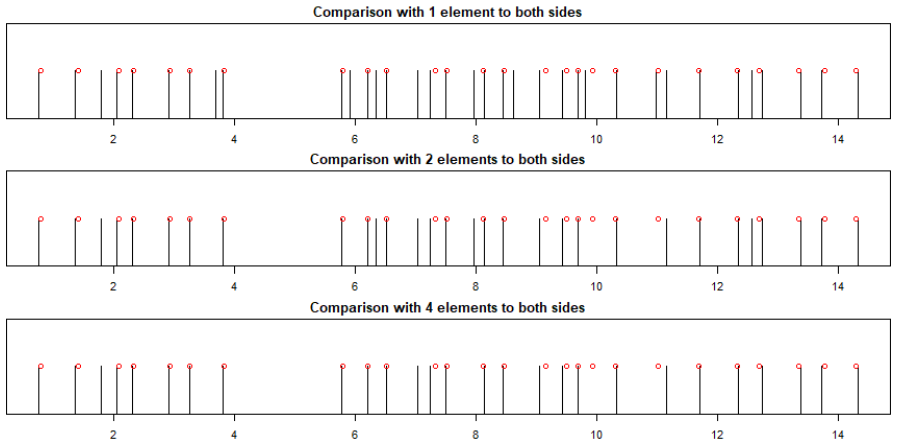
- Tuning peak detection to avoid false negatives matters more than avoiding false positives, since a missed true onset cannot be recovered at search time.
- The dominant spectral dissimilarity detector ranked the correct song first in all three reported experiments; the other two detectors ranked it first in two of three.
Reading between the lines
- If onset-only matching survives larger and more varied databases, QBH databases could be built automatically from scores or recordings without hiring singers, and queries could be matched even when the user is off-key.
- The linear-rescaling assumption could be relaxed by dynamic time warping, which would absorb local tempo drift and ornamented notes instead of forcing one global tempo change.
- A testable extension would add coarse pitch or melodic contour only as a secondary reranker, preserving the memory advantage while separating songs whose first-line rhythms are nearly identical.
Signed reviews
Editorial analysis
A structured set of objections, weighed in public.
Referee Report
Summary. The paper proposes an onset-only Query by Humming (QBH) system. It derives three onset-detection functions from GLRT principles: a local energy detector, a spectral dissimilarity detector, and a dominant spectral dissimilarity detector (Sections 3.1-3.3). Peak detection is performed by threshold and local-maximum comparison (Section 3.4), and probability bounds for detection and false positives are derived via Boole-Frechet inequalities (Section 3.5). Retrieval is done by subset matching and correlative matching with a linear tempo-scaling search (Sections 4.1-4.2). The experiments use three hummed queries against a 10-song database (Section 5), with claim of perfect retrieval for two songs and mixed results for the third, plus power calculations based on estimated noise variance and SSNR values.
Significance. If the central claim were established, the paper would be practically significant: an onset-only representation would reduce storage and search cost relative to pitch- or audio-based QBH, and might be robust to off-key humming. The statistical derivations in Sections 3.1-3.3 are textbook-correct GLRT arguments, and the Boole-Frechet bounds in Section 3.5 are valid as stated. The authors provide code and data via a GitHub repository, which supports reproducibility. However, the significance is substantially weakened by the absence of any comparison to existing QBH systems, the very small evaluation (3 queries, 10 songs), and the circularity of the numerical power claims, so the paper's headline claims are not currently supported.
major comments (5)
- [Abstract and Section 5] The abstract claims the system is 'better than existing methods ... empirically in terms of accuracy,' but no existing QBH method is implemented, cited, or compared. Section 5 reports only three hummed queries against a 10-song database containing the query songs, with no baseline. Three queries cannot statistically distinguish the method from chance or from a trivial ranking, and the absence of any QBH literature in the references means the superiority claim has no empirical or contextual grounding.
- [Section 5.1 and Tables 1-3] The evaluation is not independent of parameter tuning. The hyperparameters (window length, hop size, neighbour count, threshold criterion) are selected on the first song in Section 5.1, and the same settings are then used for the other two queries. The Jingle Bells run in Section 5.3 (Table 3) shows that Energy and Spectral Dissimilarity detectors, with these settings, rank wrong songs first; only Dominant SD succeeds. Thus the reported success is a fitted summary of the tuning song, not a predictive accuracy, and the claim of general empirical superiority is unsupported.
- [Sections 3.5 and 5.4] The numerical detection and false-positive probabilities are computed using a noise variance estimated from a blank 1-second recording and a SSNR estimated from the same hummed songs that are later claimed to be detected with at least 90% probability (Section 5.4, Figures 24-26). The mathematical bounds are valid given the model, but the specific numbers are plug-in estimates from the test data, so the 'measure of error' is a fitted parameter, not an independent prediction. The i.i.d. Gaussian noise assumption is also not validated on the actual recordings.
- [Section 4.1.2, 4.2, and 7] The retrieval pipeline assumes the hummed segment is the same verse as the stored database onsets, and that after a linear tempo rescaling the onset sets correspond one-to-one. Section 4.1.2 states the same verse is present and the timing is equal; Section 4.2 relaxes only timing via a linear transform; Section 7 admits the system cannot handle a user who does not know where the first verse ends. Extra or missing onsets (e.g., meends, ornaments) can cause the subset-matching step to mislabel onsets, so the method is not demonstrated for realistic query variation.
- [Sections 1 and 6] The claimed advantages in speed and memory are not quantified. The paper states that storing only onsets is memory efficient and that the system is faster than pitch-based methods, but no measurements of runtime, storage size, or comparison against any alternative representation are provided. These claims are load-bearing for the abstract's 'better than existing methods in terms of speed and memory.'
minor comments (5)
- [Section 2.1] There are typos such as 'an sound' and 'getaway' (should be 'way out'), and 'chi-sqaured' appears repeatedly in Section 3.5.1 and 3.5.2.
- [Section 2.2] The definition of 'beat' as 'the largest unit of time based on which ... all such measured time in beat units will be integers' is imprecise and does not match standard music terminology; this should be clarified or replaced with a standard definition.
- [Section 3.4] The threshold criteria (mean or 3rd quartile of the detection function) are introduced as ad hoc choices with no theoretical justification or sensitivity analysis; a brief discussion of their limitations would improve the paper.
- [References] The reference list contains no QBH system papers (e.g., Ghias et al., McNab et al., or MIREX QBH participants), which is surprising for a paper claiming superiority over existing QBH methods; at minimum, representative prior work should be cited and discussed.
- [Section 5.4] The statement that 'the squared value of SNR is roughly estimated as 5000 for each of the song' is based on T/σ^2 (mean energy over noise variance) which is not the SNR defined as A/σ; although the paper acknowledges this is a crude underestimate, the notation should be corrected to avoid confusion.
Circularity Check
Detector-power calculation is in-sample and statistically forced, but the QBH retrieval pipeline itself is not circular.
-
fitted input called prediction
[Section 5.4, Power Calculation (pp. 27-28)]
"we record a blank audio (without any onset) of 1 second which helps us to estimate the usual noise variance σ2... estimate the squared signal to noise ratio (SSNR) of that song as T/10165.98... We find that the sqaured value of SNR is roughly estimated as 5000 for each of the song, hence we use this to calculate the power of the energy detector."
The reported detection-power lower bounds and false-positive probabilities are computed by inserting noise-variance and SSNR estimates taken from the same hummed recordings into the model of Section 3.5. The threshold alpha is effectively set by alpha/sigma^2 ~ 5000, the estimated SSNR of those very songs; the resulting near-zero false-positive probability is therefore a fitted summary of the evaluation data rather than an independent prediction. This does not force the retrieval rankings, which come from actual onset matching, but it means the abstract's 'measure of error' is not independent evidence of detector performance.
full rationale
The onset detection functions are derived from explicit statistical models (GLRT for energy; heuristic extensions for spectral variants), and the peak-detection and matching algorithms are defined independently of the evaluation. The retrieval experiments, while small and lacking QBH baselines, are genuine retrieval tasks: the query songs are present in the database, but the algorithm does not know the answer and the rankings are produced by the matching score. The main circularity concern is confined to Section 5.4, where detector power and false-positive rates are computed using parameters estimated from the same recordings being evaluated, making the reported 'measure of error' an in-sample fitted value rather than a prediction. The unsupported superiority claim over existing QBH systems is an evaluation-completeness problem, not a circular-derivation problem. No self-citations are used, and no core mathematical derivation reduces to its own input.
Assumptions & free parameters
free parameters (6)
- window length omega =
4096 samples
- hop size h =
512 (energy), 2048 (spectral and dominant SD)
- neighbour count r =
8 (energy), 4 (spectral), 2 (dominant SD)
- threshold criterion =
mean-based thresholding
- noise variance sigma^2 =
10165.98
- squared signal-to-noise ratio (SSNR) =
approximately 5000
assumptions (5)
- domain assumption The signal is a sum of a deterministic (possibly decaying sinusoidal) component and independent white Gaussian noise with known variance sigma^2.
- domain assumption An onset manifests as a local peak in the amplitude envelope and in the detection function; true onsets are separated by at least 0.1 s.
- domain assumption The hummed query and the database reference share the same verse, so their onset sets correspond one-to-one after a linear tempo transform.
- standard math Standard results in statistical detection theory (GLRT, chi-squared and non-central chi-squared distributions, Boole-Frechet inequalities) apply.
- domain assumption Frequency bins above 1 kHz contain no useful hum information and can be discarded.
Cite this review
Pith. "Pith review of Onset detection: A new approach to QBH system." pith.science (2026). https://pith.science/paper/TWL3NMVS
@misc{pith2026190807409,
  author       = {Pith},
  title        = {Pith review of: Onset detection: A new approach to QBH system},
  year         = {2026},
  howpublished = {\url{https://pith.science/paper/TWL3NMVS}},
  note         = {Machine review of arXiv:1908.07409}
}
read the original abstract
Query by Humming (QBH) is a system to provide a user with the song(s) which the user hums to the system. Current QBH method requires the extraction of onset and pitch information in order to track similarity with various versions of different songs. However, we here focus on detecting precise onsets only and use them to build a QBH system which is better than existing methods in terms of speed and memory and empirically in terms of accuracy. We also provide statistical analogy for onset detection functions and provide a measure of error in our algorithm.
Figures

Figures from the paper (23 more)








Reference graph
Works this paper leans on
-
[1]
Kay, Fundamentals of Statistical Signal Processing, Volume II: Detection Theory
Steven M. Kay, Fundamentals of Statistical Signal Processing, Volume II: Detection Theory. Prentice-Hall, 1998
work page 1998
-
[2]
J. P. Bello, L. Daudet, S. Abdallah, C. Duxbury, M. Davies and M. B. Sandler, A tutorial on onset detection in music signals, in IEEE Transactions on Speech and Audio Processing, vol. 13, no. 5, pp. 1035-1047, Sept. 2005
work page 2005
-
[3]
I. Kauppinen, Methods for detecting impulsive noise in speech and audio signals , 2002 14th International Con- ference on Digital Signal Processing Proceedings. DSP 2002 (Cat. No.02TH8628), Santorini, Greece, 2002, pp. 967-970 vol.2
work page 2002
-
[4]
A. Holzapfel, Y . Stylianou, A. C. Gedik and B. Bozkurt,Three Dimensions of Pitched Instrument Onset Detection, in IEEE Transactions on Audio, Speech, and Language Processing, vol. 18, no. 6, pp. 1517-1527, Aug. 2010
work page 2010
-
[5]
https://www.uio.no/studier/emner/matnat/math/nedlagte-emner/MAT-INF2360/v12/part1.pdf
Uniservity of Oslo: Sound Processing Lecture Part I: Fourier analysis and applications to sound processing . https://www.uio.no/studier/emner/matnat/math/nedlagte-emner/MAT-INF2360/v12/part1.pdf
-
[6]
A Foundation in Digital Communication ETH Zurich
Amos Lapidoth. A Foundation in Digital Communication ETH Zurich. Swiss Federal Institute of Technology. 2009
work page 2009
-
[7]
Link for Github Repository: https://github.com/subroy13/OnsetDetection 30
Reviewed August 14, 2026 · model on record in the stance chip above.
Discussion (0). Continue with ORCID to comment.