REVIEW 3 major objections 5 minor 102 references
Metal Abundances and Star-Formation Rates of Emission-Line Galaxies in and around the Bootes Void
T0 review · 3 major / 5 minor · reviewed 2026-08-14 · deepseek-v4-flash
Pith's one-line read Galaxy environment does not set metallicity or star formation in void galaxies
desk verdict Careful complete-sample confirmation of the void null result above ~10^9 Msun; the global artifact argument has a circular corner, while the direct void comparison is the stronger and more useful part. read the letter →
The pith
A machine-rendered reading of the paper's core claim, the machinery that carries it, and where it could break.
The reading
What carries the argument
The machinery is a complete, line-flux-limited sample plus an environment metric and an explanatory relation. The sample is the 820 KR2 star-forming galaxies from the KISS survey, each with an O3N2-based oxygen abundance and a Kennicutt (1998) H-alpha star-formation rate. Local density is measured with an N=15 nearest-neighbor algorithm applied to an independent SDSS DR7 plus UZC comparison catalog of 14,577 galaxies, corrected for magnitude-limit incompleteness with the Postman & Geller (1984) luminosity-function normalization using Blanton et al. (2003) parameters. The load-bearing explanatory device is the mass-metallicity relation: it converts the observed density trend in stellar mass into a predicted abundance trend, and the close agreement of that prediction with the observed abundance trend is what turns apparent environmental effects into artifacts.
What would settle it
Measure the residual of each galaxy from the mass-metallicity relation and plot that residual against local density using the same KISS sample: if the residual correlates with density by more than the reported $\sim 0.07$ dex scatter, the claim that abundance trends are fully explained by mass fails. A targeted H-$\alpha$ survey of void dwarfs below $10^9\,M_\odot$ that found systematically lower metallicities or higher specific star-formation rates than mass-matched field dwarfs would also rule out the paper's conclusion for the lowest-mass systems.
Extended reading notes
Core claim
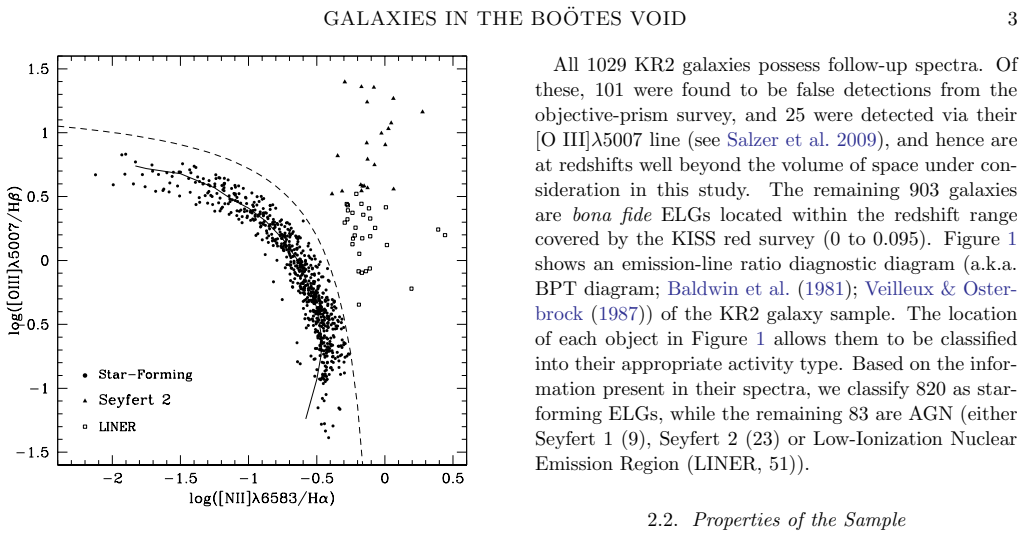
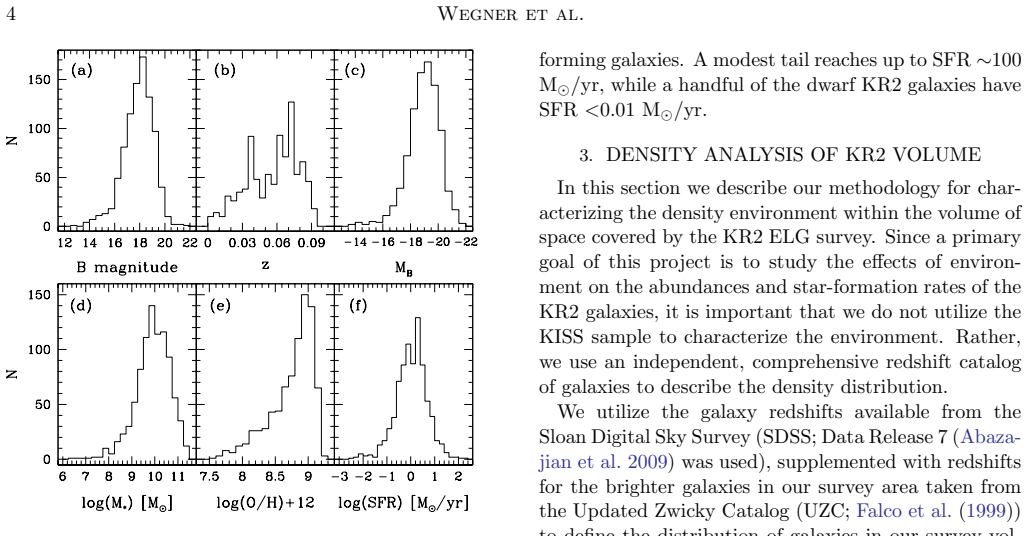
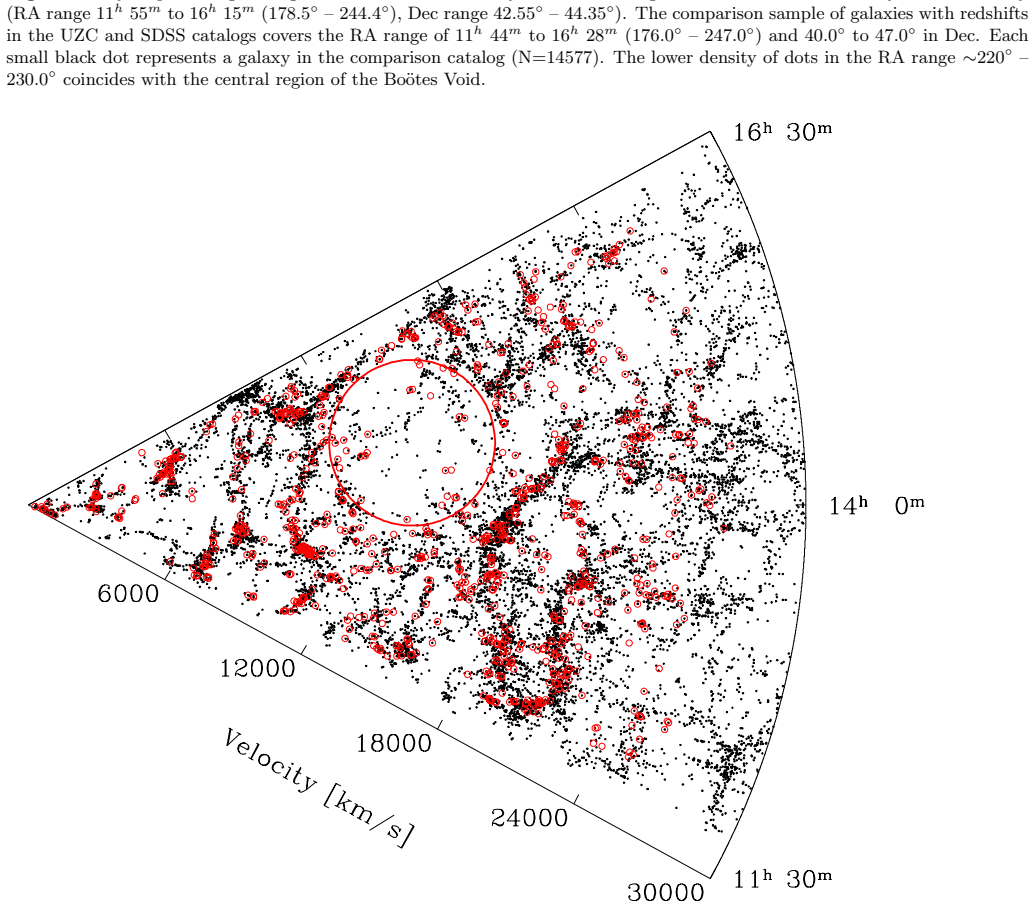
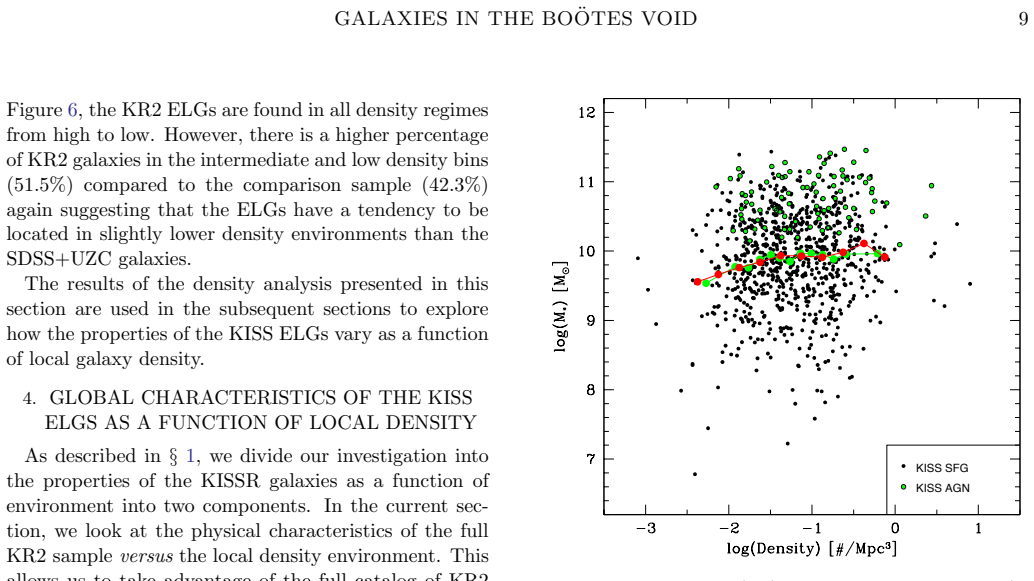
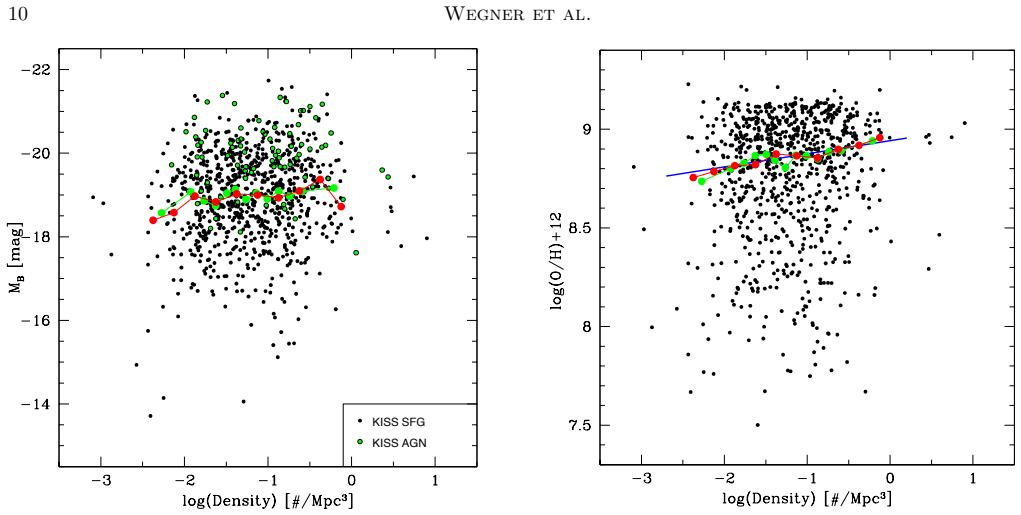
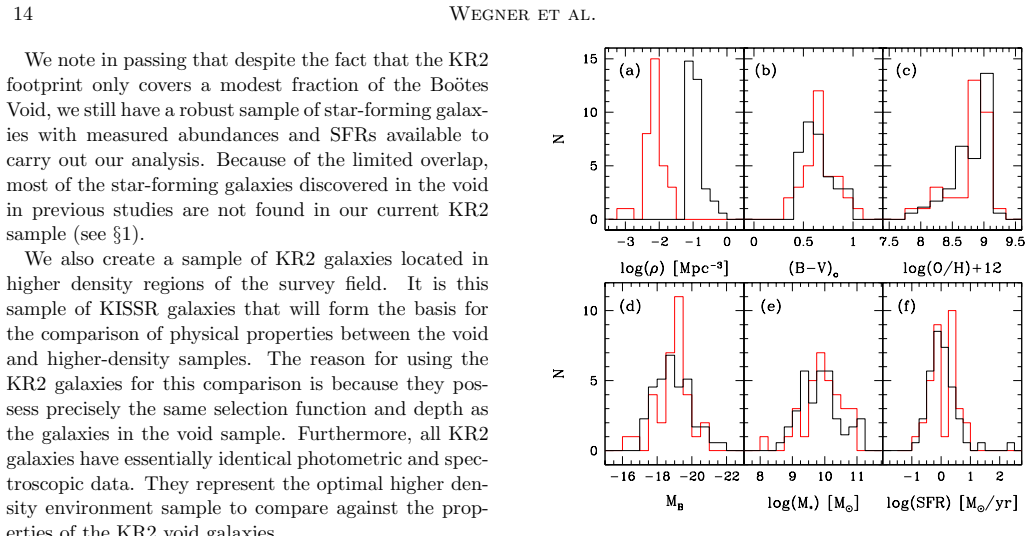
The central claim is that local galaxy density does not drive chemical enrichment or star formation in star-forming galaxies. The paper shows this in two ways. Globally, among 810 star-forming galaxies, the median stellar mass, oxygen abundance, and SFR all fall weakly with decreasing density, but the abundance drop (about $-0.166$ dex over 2.5 dex in density) matches almost exactly the $-0.171$ dex predicted from the observed 0.38 dex mass drop and the mass-metallicity relation of Hirschauer et al. (2018), and the SFR trend vanishes when plotted as specific SFR. Within the Bootes Void itself, 33 star-forming galaxies have the same mean and median metallicity, stellar mass, luminosity, color, and SFR as a comparison sample of 58 galaxies in regions 16.5 times denser; K-S tests cannot reject a common parent population. The paper concludes that the weak global trends are artifacts of the tendency of low-density regions to contain lower-mass galaxies, and that the chemical evolution and star formation of these systems are governed by internal processes rather than environment.
Load-bearing premise
The density assignments, and with them the void sample and the reported 16.5x density contrast, assume that the SDSS DR7 plus UZC comparison catalog, after the luminosity-function correction, faithfully traces the true galaxy density field on megaparsec scales.
Editorial extensions
If this is right
- Galaxy metallicity is set by galaxy mass, not by the density of the surrounding large-scale structure, at least for masses above roughly $10^9$ to $10^{9.5}$ solar masses.
- The lower star-formation rates seen in low-density environments are simply the lower rates of lower-mass galaxies; specific star-formation rate is flat with density.
- Void galaxies and high-density galaxies of the same mass have statistically indistinguishable star-formation histories, so present-day environment cannot be the main driver of their assembly.
- Comparisons that report higher star formation in voids must be mass-matched or they will misread the mass-density trend as an environmental effect.
- Any environmental dependence of metallicity or star formation, if it exists, must be confined to dwarf galaxies below the sample's completeness limit.
Reading between the lines
- Extending the same mass-residual analysis to deeper, lower-mass samples would test whether the mass-metallicity relation itself is environment-independent at the dwarf end; a change in the mass-metallicity residual with density would localize where environment starts to matter.
- The paper's argument implies that most of a galaxy's stellar mass was assembled before the modern void-wall density contrast developed; stellar-population age gradients across voids would provide an independent check.
- Because the density metric averages over hundreds of kiloparsecs to a few megaparsecs, close-pair interactions on tens of kiloparsec scales could still leave an environmental imprint on star formation that this analysis is not designed to see.
- If future, algorithmically defined void catalogs reproduce the 16.5x density contrast with the same null result, the case for environment-independent enrichment becomes hard to avoid.
Signed reviews
Editorial analysis
A structured set of objections, weighed in public.
Referee Report
Summary. The paper uses 820 star-forming galaxies from the second H-alpha-selected KISS catalog (KR2) to test whether gas-phase metallicity and star-formation rate depend on local environment. Densities are derived from an independent SDSS DR7 + UZC redshift catalog using an N=15 nearest-neighbor estimator with a Postman-Geller luminosity-function correction. In the global analysis (Section 4), binned median stellar mass, metallicity, and SFR decline weakly toward low density, but sSFR shows no trend; the authors argue the metallicity and SFR trends are artifacts of the mass-density trend, using the Hirschauer et al. (2018) M-Z slope to predict the metallicity change. In the void analysis (Section 5), 33 KR2 star-forming galaxies selected inside an adopted Bootes Void boundary are compared with 58 KR2 galaxies at higher density and matched redshift; no significant differences are found in metallicity or SFR, despite a factor of 16.5 difference in mean density. The paper concludes that environment does not drive chemical enrichment or star formation for galaxies above roughly 10^9 to 10^9.5 solar masses.
Significance. If the conclusions hold, the paper provides a useful constraint: for H-alpha-selected star-forming galaxies above roughly 10^9 solar masses, local density does not measurably affect metallicity or SFR, consistent with a picture in which internal processes dominate. The study's strengths include the uniform KISS selection, complete follow-up spectroscopy for all KR2 candidates, self-consistent abundance and SFR estimators, a comparison sample drawn from the same survey, and an explicit statement of the mass range over which the constraint applies. The central 'artifact' argument, however, is currently weakened by a partly circular use of the M-Z relation, and the void boundary is defined by eye; both issues are fixable with targeted robustness checks.
major comments (3)
- [Section 4.3, Figure 10] The artifact argument is partly circular. Section 2.2 states that 70 of the 810 KR2 star-forming galaxies have abundances assigned from the Hirschauer et al. (2018) M-Z relation because their spectra lack the necessary emission lines. Section 4.3 then takes the slope of that same relation (0.451) and multiplies by the observed 0.38 dex mass drop to predict a -0.171 dex metallicity drop, which is compared with the observed -0.166 +/- 0.069 dex. Because a subset of the data in Figure 10 was generated directly from this relation, and because the relation was calibrated on the same KISS sample and abundance scale, the agreement is at least partly tautological. The manuscript does not state how many of the 33 void galaxies or 58 high-density comparison galaxies have M-Z-estimated abundances. I request a robustness analysis that removes the 70 M-Z-assigned objects from the global trends and from the void/high-density comparison, or uses an external M-Z calibration, with the resulting slopes and K-S probabilities reported.
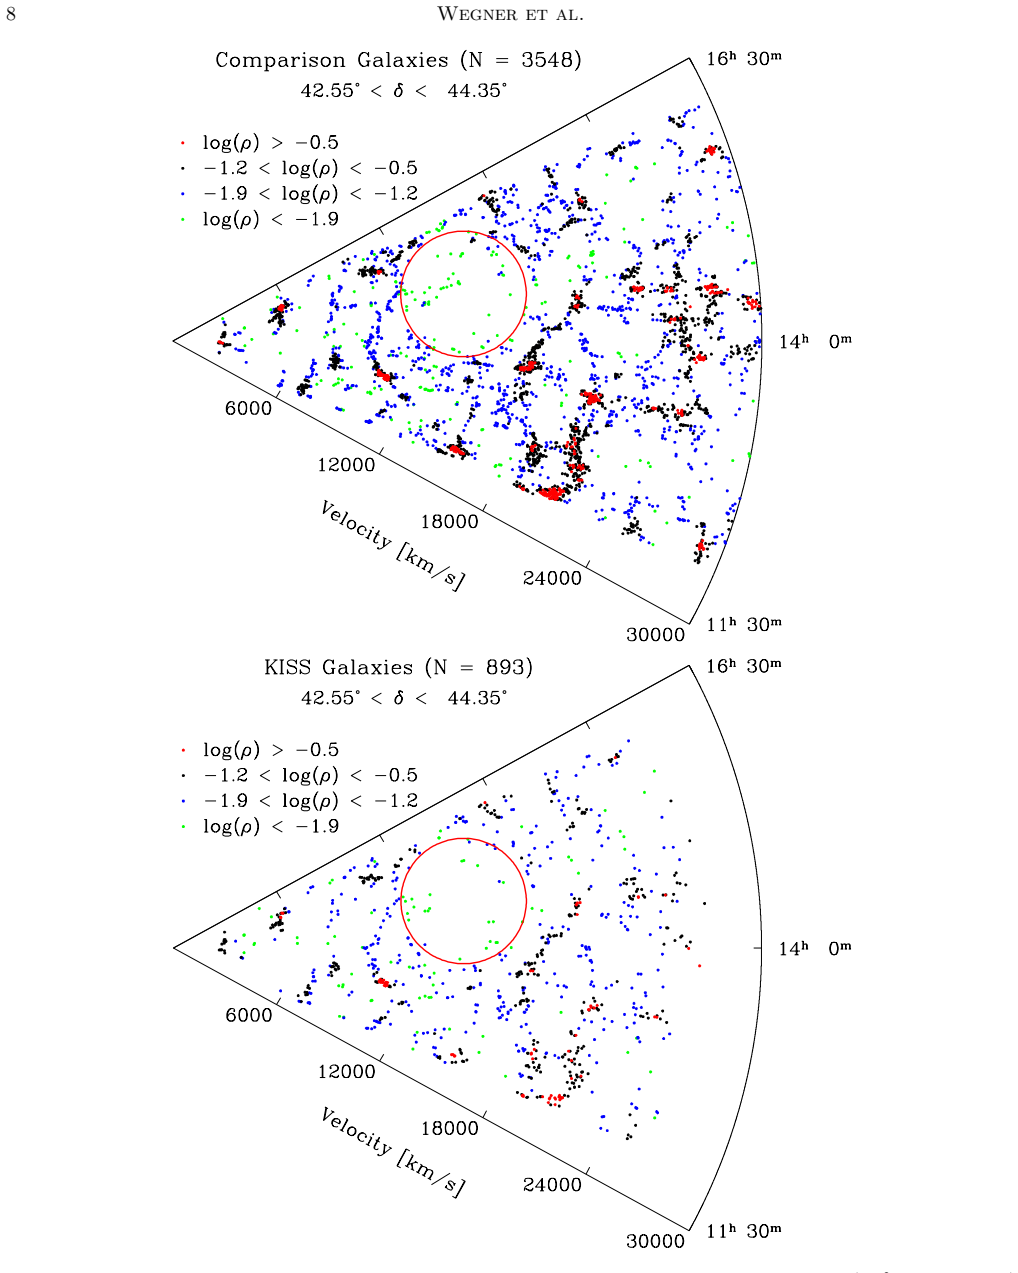
- [Section 5.1] The void sample is not defined reproducibly. The text says the center, velocity, and radius of the red circle were adjusted by eye to maximize inclusion of low-density objects while excluding intermediate-density sources, and then six galaxies outside the circle were added based on a density threshold. Although Table 1 lists the resulting 33 objects, the construction depends on subjective choices. Please replace this with an algorithmic boundary (for example, a fixed density threshold with a stated center and radius) and show that the conclusions are stable to plausible variations in the boundary parameters (e.g., radius 2800-3600 km/s, density threshold log(rho) from -1.8 to -2.0).
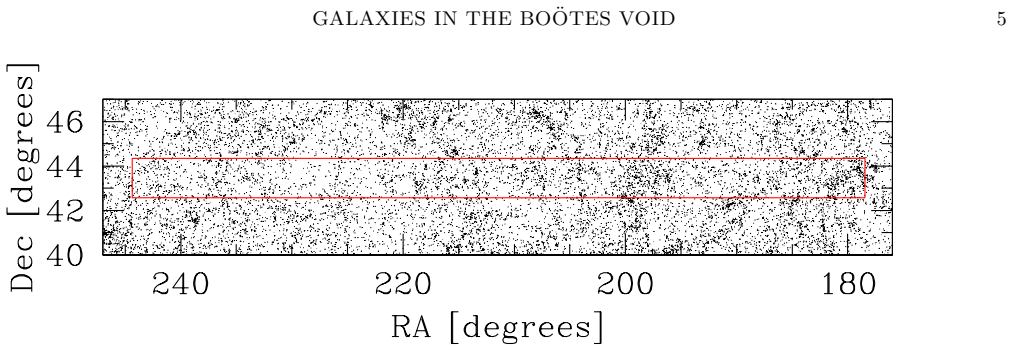
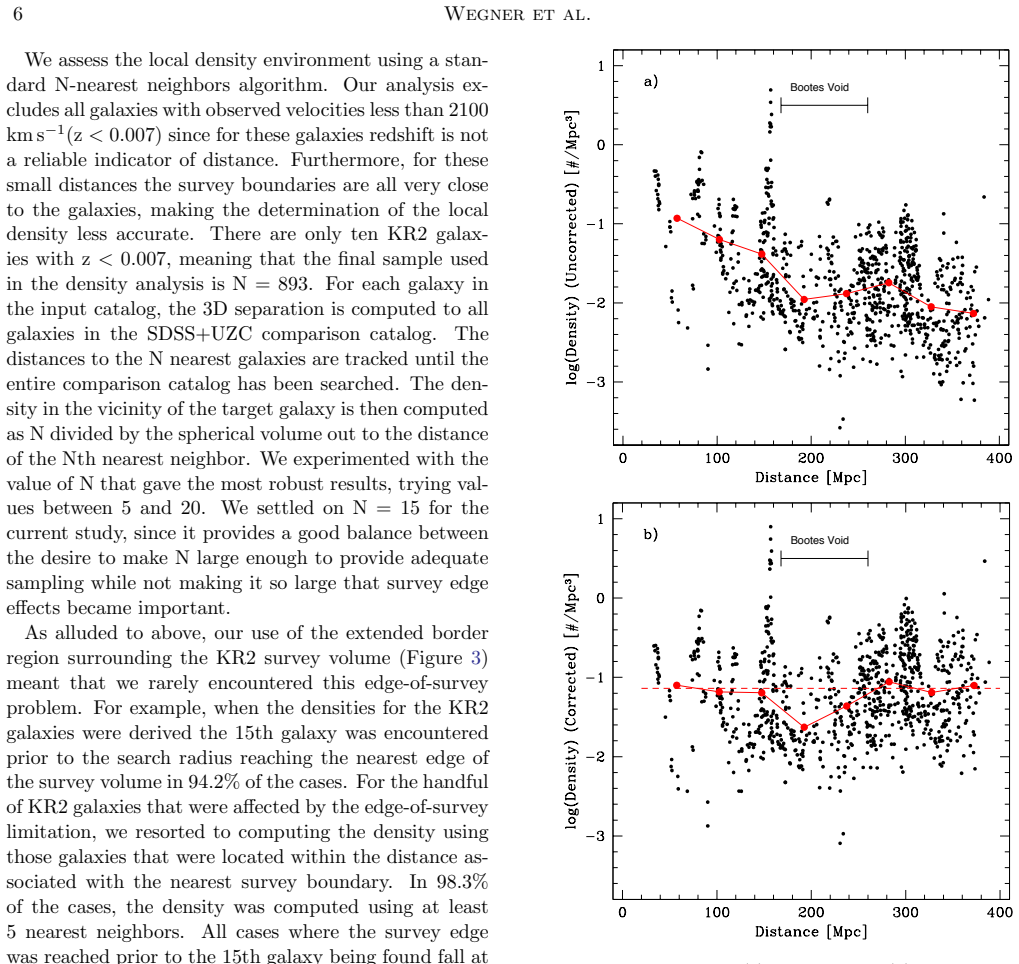
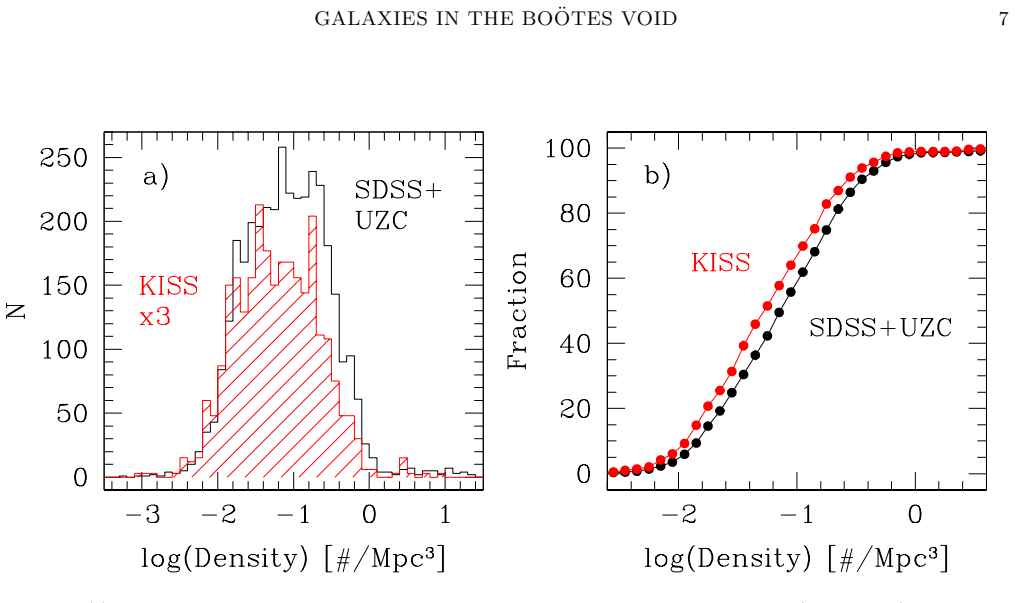
- [Section 3, Figure 5] The density estimates rely on the SDSS DR7 + UZC comparison catalog being complete enough for N=15 nearest-neighbor counts after a Postman-Geller correction with Blanton et al. (2003) luminosity function parameters. Because the paper notes that KISS reaches 1-2 mag deeper than the SDSS redshift survey, faint galaxies absent from the comparison catalog could bias derived densities at the void distance. The constancy of the corrected mean density outside the void is reassuring, but a more direct test, such as recomputing densities with a volume-limited subsample or with alternative luminosity function parameters, would make the density assignments, and hence the reported 16.5x density contrast, more robust.
minor comments (5)
- [Abstract] The last sentence contains an apparent wording error: 'the observed drop in stellar mass with decreasing metallicity' should read 'with decreasing density', since the argument concerns the mass-density trend.
- [Section 2.2] The claim that all 820 star-forming galaxies possess metallicity and SFR estimates should be qualified, because 70 galaxies have M-Z-based rather than O3N2-based abundances; consider saying 'metallicity estimates (O3N2 or M-Z based)' in the abstract and Section 7.
- [Section 5.2] The K-S test for log(SFR) returns a 39.5% probability, which means the test fails to reject the null hypothesis; with N=33 and N=58 the test has limited power, so the text should not present this as positive evidence of identical parent populations. Reporting a confidence interval for the mean/median SFR offset or a bootstrap test would be more informative.
- [Table 2, Section 5.2] The error in the mean is computed as sigma/sqrt(N) for all properties; for skewed distributions such as log(SFR) this may be misleading. Consider also reporting bootstrapped confidence intervals or median-based statistics.
- [Figure 10 and Section 4.3] The figure caption quotes a 0.20 dex drop in median abundance over the plotted density range, while the text and Section 4.3 use the fitted value -0.166 +/- 0.069 dex for comparison with the M-Z prediction; please make explicit which quantity is being compared.
Circularity Check
Global metallicity-density 'prediction' is partly circular: 70/810 metallicities come from the same Hirschauer et al. M-Z relation used to predict the trend, and that relation was fit to the same KISS sample.
-
fitted input called prediction
[Section 2.2 (sample properties); Section 4.3 (global discussion)]
"For 70 KR2 galaxies the existing follow-up spectra do not contain the necessary emission lines to allow us to compute an O3N2 abundance. For these galaxies the abundances are estimated using the mass-metallicity (M-Z) relation presented in the Hirschauer et al. (2018) study."
These 70 objects' metallicities are, by construction, a linear function of their stellar mass with the 0.451 slope of the Hirschauer et al. relation. When Section 4.3 multiplies the observed 0.38 dex mass drop by that same slope to 'predict' a 0.171 dex metallicity drop, the 70 M-Z-assigned objects automatically contribute a metallicity-density trend that tracks their mass-density trend. The observed drop of 0.166 dex used for comparison is computed from the full sample that includes these 70 objects, so the agreement is not an independent confirmation; at least part of the predicted trend is an input rather than a measurement.
-
self citation load bearing
[Section 4.3]
"The recent study by Hirschauer et al. (2018) derived a linear M-Z relation with a slope of 0.451 per dex in terms of the logarithm of the stellar mass, using precisely the same metallicities employed in the current study. Using the Hirschauer et al. (2018) M-Z relation slope we infer that a systematic drop in the stellar mass by this amount would translate into a corresponding drop in the observed O/H abundance of -0.171 dex."
The load-bearing calibration is a prior paper by overlapping authors (Hirschauer and Salzer are co-authors here) that was fit to the same KISS galaxies and the same O3N2 metallicities used in the present analysis. It is therefore not an external, parameter-free test: the slope that generates the predicted metallicity drop was derived from the very data being 'explained.' The near-equality of -0.171 and -0.166 demonstrates consistency with a same-sample fit rather than a first-principles environmental prediction.
full rationale
The direct void-versus-high-density comparison in Section 5 is largely self-contained: local densities come from an independent SDSS+UZC catalog, the void and comparison samples are drawn from the same KISS selection function, and the K-S tests compare measured property distributions. That portion of the paper does not reduce to the M-Z relation and provides independent support for the primary claim of no strong environmental dependence. However, the global artifact argument in Section 4.3 is partly circular. Seventy of the 810 star-forming galaxies have metallicities assigned from the Hirschauer et al. (2018) M-Z relation, and the same relation's slope is then used to predict the metallicity-density trend, with the quoted agreement of -0.171 dex versus -0.166 +/- 0.069 dex. Moreover, the relation was fit using precisely the same KISS metallicities employed here, so it is not an independent calibration. The paper does not state how many of the 33 void or 58 high-density galaxies received M-Z-inferred abundances, so the independence of the Section 5 comparison is incompletely documented; this is a limitation rather than a demonstrated circular step. Overall, the central observational comparison retains independent content, but the 'fully explained by mass' prediction is partially tautological, warranting a score of 6.
Assumptions & free parameters
free parameters (4)
- Mass-metallicity relation slope (Hirschauer et al. 2018) =
0.451 per dex
- SDSS luminosity function parameters (Blanton et al. 2003) =
M*_g = -20.1, alpha = -0.89
- Nearest-neighbor count N =
15
- Bootes Void boundary (center and radius) =
RA 14h50m, v=15000 km/s, radius=3200 km/s
assumptions (5)
- domain assumption Standard flat LambdaCDM cosmology with Omega_m=0.3, Omega_Lambda=0.7, H0=70 km/s/Mpc.
- domain assumption The mass-metallicity relation derived by Hirschauer et al. (2018) applies to all KISS galaxies and can be used both to estimate missing metallicities and to predict density trends.
- domain assumption The SDSS DR7 + UZC comparison catalog, corrected with the luminosity-function normalization, traces the true galaxy density field on the scales probed.
- domain assumption H-alpha luminosities measured from objective-prism spectra are reliable total fluxes for SFR computation.
- domain assumption The N=15 nearest-neighbor density estimator captures the local environment relevant to galaxy evolution.
Cite this review
Pith. "Pith review of Metal Abundances and Star-Formation Rates of Emission-Line Galaxies in and around the Bootes Void." pith.science (2026). https://pith.science/paper/YP5N5EFW
@misc{pith2026190807539,
  author       = {Pith},
  title        = {Pith review of: Metal Abundances and Star-Formation Rates of Emission-Line Galaxies in and around the Bootes Void},
  year         = {2026},
  howpublished = {\url{https://pith.science/paper/YP5N5EFW}},
  note         = {Machine review of arXiv:1908.07539}
}
read the original abstract
We explore the possible dependencies of galaxy metal abundance and star-formation rate (SFR) on local environment, focusing on the volume of space in and around the Bootes Void. Our sample of star-forming galaxies comes from the second catalog of the H-alpha-selected KPNO International Spectroscopic Survey (KISS) which overlaps the void. This sample represents a statistically complete, line-flux-limited ensemble of 820 star-forming galaxies, all of which possess metallicity and SFR estimates. We carry out two distinct analyses of the KISS galaxies: one which probes the properties of the entire sample as a function of local density, and a second which details the properties of 33 KISS star-forming galaxies located within the Bootes Void. In both cases we find no evidence that either the metallicity of the KISS galaxies or their SFRs depend on the environments within which the galaxies are located. Our global analysis does show weak trends for decreasing stellar mass, decreasing metallicity, and decreasing SFRs with decreasing local densities. However, we argue that the metallicity and SFR trends are artifacts of the stellar mass - local density trend. In particular, the change in metallicity with density is precisely what one would predict from the mass-metallicity relation given the observed drop in stellar mass with decreasing metallicity. Likewise, the SFR trend with density disappears when one instead considers the mass-normalized specific SFR. The KISS galaxies dwelling in the Bootes Void are found to have nearly identical metallicity and SFR properties to a matched comparison sample, despite the fact that the former are located in density environments that are, on average, more than 16 times lower.
Figures
Figures from the paper (8 more)

Reference graph
Works this paper leans on
-
[1]
߿? . On ǏϷỷÝEB ? Po _ Џ? _ H. wO S崔V4s;, i<S'
thebibliography [1] 20pt to REFERENCES 6pt =0pt 10pt plus 3pt =0pt =0pt =1pt plus 1pt =0pt =0pt -12pt =13pt plus 1pt =20pt =13pt plus 1pt \@M =10000 =-1.0em =0pt =0pt 0pt =0pt =1.0em @enumiv\@empty 10000 10000 `\.\@m \@noitemerr \@latex@warning Empty `thebibliography' environment \@ifnextchar \@reference \@latexerr Missing key on reference command Each re...
2019
-
[2]
N., Adelman-McCarthy, J
Abazajian, K. N., Adelman-McCarthy, J. K., Ag \"u eros, M. A., et al.\ 2009, , 182, 543
2009
-
[3]
Alpaslan, M., Robotham, A. S. G., Obreschkow, D., et al.\ 2014, , 440, L106
2014
-
[4]
Alpaslan, M., Driver, S., Robotham, A. S. G., et al.\ 2015, , 451, 3249
2015
-
[5]
A., & Szalay, A
Aragon-Calvo, M. A., & Szalay, A. S.\ 2013, , 428, 3409
2013
-
[6]
A., Phillips, M
Baldwin, J. A., Phillips, M. M., & Terlevich, R.\ 1981, , 93, 5
1981
-
[7]
R., Hogg, D
Blanton, M. R., Hogg, D. W., Bahcall, N. A., et al.\ 2003, , 592, 819
2003
-
[8]
Cai, Y.-C., Padilla, N., & Li, B.\ 2015, , 451, 1036
2015
Show all 102 references
-
[9]
Cautun, M., van de Weygaert, R., Jones, B. J. T., et al.\ 2014, , 441, 2923
2014
-
[10]
N., Pustilnik, S
Chengalur, J. N., Pustilnik, S. A., Makarov, D. I., et al.\ 2015, , 448, 1634
2015
-
[11]
Clampitt, J., Cai, Y.-C., & Li, B.\ 2013, , 431, 749
2013
-
[12]
L., et al.\ 2006, , 370, 1213
Collobert, M., Sarzi, M., Davies, R. L., et al.\ 2006, , 370, 1213
2006
-
[13]
M., Wegner, G
Corsini, E. M., Wegner, G. A., Thomas, J., et al.\ 2017, , 466, 974
2017
-
[14]
Cruzen, S., Wehr, T., Weistrop, D., et al.\ 2002, , 123, 142
2002
-
[15]
De Lucia, G., Springel, V., White, S. D. M., et al.\ 2006, , 366, 499
2006
-
[16]
A., & Huchra, J.\ 1990, , 99, 463
Dey, A., Strauss, M. A., & Huchra, J.\ 1990, , 99, 463
1990
-
[17]
A., Vogeley, M
Douglas, K. A., Vogeley, M. S., & Cen, R.\ 2018, , 864, 144
2018
-
[18]
A., & Evans, I
Dopita, M. A., & Evans, I. N. 1986, , 307, 431
1986
-
[19]
Einasto, J., Suhhonenko, I., H \"u tsi, G., et al.\ 2011, , 534, A128
2011
-
[20]
E., Kurtz, M
Falco, E. E., Kurtz, M. J., Geller, M. J., et al.\ 1999, , 111, 438
1999
-
[21]
A., & Geller, M
Grogin, N. A., & Geller, M. J.\ 2000, , 119, 32
2000
-
[22]
J., et al.\ 2004a, , 128, 644
Gronwall, C., Jangren, A., Salzer, J. J., et al.\ 2004a, , 128, 644
-
[23]
J., Sarajedini, V
Gronwall, C., Salzer, J. J., Sarajedini, V. L., et al.\ 2004b, , 127, 1943
1943
-
[24]
S., Salzer, J
Hirschauer, A. S., Salzer, J. J., Bresolin, F., et al.\ 2015, , 150, 71
2015
-
[25]
S., Salzer, J
Hirschauer, A. S., Salzer, J. J., Janowiecki, S., et al.\ 2018, , 155, 82
2018
-
[26]
Hoeft, M., Yepes, G., Gottl \"o ber, S., et al.\ 2006, , 371, 401
2006
-
[27]
W., Blanton, M
Hogg, D. W., Blanton, M. R., Brinchmann, J., et al.\ 2004, , 601, L29
2004
-
[28]
S., & Pan, D.\ 2012, , 426, 3041
Hoyle, F., Vogeley, M. S., & Pan, D.\ 2012, , 426, 3041
2012
-
[29]
K., Hopp, U., & Kuhn, B.\ 1997, , 319, 67
Huchtmeier, W. K., Hopp, U., & Kuhn, B.\ 1997, , 319, 67
1997
-
[30]
J., Sarajedini, V
Jangren, A., Salzer, J. J., Sarajedini, V. L., et al.\ 2005a, , 130, 2571
-
[31]
J., et al.\ 2005b, , 130, 496
Jangren, A., Wegner, G., Salzer, J. J., et al.\ 2005b, , 130, 496
-
[32]
M., Tremonti, C., 2003, , 346, 1055
Kauffmann, G., Heckman, T. M., Tremonti, C., 2003, , 346, 1055
2003
-
[33]
Kennicutt, R. C., Jr. 1998, , 35, 267
1998
-
[34]
P., Oemler, A., Schechter, P
Kirshner, R. P., Oemler, A., Schechter, P. L., et al.\ 1981, , 248, L57
1981
-
[35]
P., Oemler, A., Schechter, P
Kirshner, R. P., Oemler, A., Schechter, P. L., et al.\ 1983, in IAU Symposium 104, Early Evolution of the Universe and Its Present Structure , 197
1983
-
[36]
P., Oemler, A., Schechter, P
Kirshner, R. P., Oemler, A., Schechter, P. L., et al.\ 1987, , 314, 493
1987
-
[37]
Y., Egorova, E
Kniasev, A. Y., Egorova, E. S., & Pustilnik, S. A. \ 2018, , 479, 3842
2018
-
[38]
R., & Cen, R.\ 2011, , 735, 132
Kreckel, K., Joung, M. R., & Cen, R.\ 2011, , 735, 132
2011
-
[39]
Kreckel, K., Peebles, P. J. E., van Gorkom, J. H., et al.\ 2011, , 141, 204
2011
-
[40]
A., et al.\ 2011, , 141, 4
Kreckel, K., Platen, E., Arag \'o n-Calvo, M. A., et al.\ 2011, , 141, 4
2011
-
[41]
A., et al.\ 2012, , 144, 16
Kreckel, K., Platen, E., Arag \'o n-Calvo, M. A., et al.\ 2012, , 144, 16
2012
-
[42]
Kreckel, K., Croxall, K., Groves, B., et al.\ 2015, , 798, L15
2015
-
[43]
Y., Clampitt, J., Cai, Y
Lam, T. Y., Clampitt, J., Cai, Y. C., et al.\ 2015, , 428, 3409
2015
-
[44]
C., Salzer, J
Lee, J. C., Salzer, J. J., & Melbourne, J.\ 2004, , 616, 752
2004
-
[45]
F., Serrano, A, et al.\ 1979, , 80, 155
Lequeux, J., Rayo, J. F., Serrano, A, et al.\ 1979, , 80, 155
1979
-
[46]
Li, B., Zho, G.-B., & Koyama, K.\ 2012, , 421, 3481
2012
-
[47]
I., van de Weygaert, R., Cautun, M., et al.\ 2018, , 473, 1195
Libeskind, N. I., van de Weygaert, R., Cautun, M., et al.\ 2018, , 473, 1195
2018
-
[48]
Liebscher, D.-E., Priester, W., & Hoell, J.\ 1992, , 261, 377
1992
-
[49]
A., Scherrer, R
Mao, Q., Berlind, A. A., Scherrer, R. J., et al.\ 2017, , 835, 161
2017
-
[50]
W.\ 2012, , 144, 4
McConnachie, A. W.\ 2012, , 144, 4
2012
-
[51]
J.\ 2002, , 123, 2302
Melbourne, J., & Salzer, J. J.\ 2002, , 123, 2302
2002
-
[52]
J., et al.\ 2004, , 127, 686
Melbourne, J., Phillips, A., Salzer, J. J., et al.\ 2004, , 127, 686
2004
-
[53]
M., Vogeley, M
Moorman, C. M., Vogeley, M. S., Hoyle, F., et al.\ 2014, , 444, 3559
2014
-
[54]
M., Vogeley, M
Moorman, C. M., Vogeley, M. S., Hoyle, F., et al.\ 2015, , 810, 108
2015
-
[55]
M., Moreno, J., White, A., et al.\ 2016, , 831, 118
Moorman, C. M., Moreno, J., White, A., et al.\ 2016, , 831, 118
2016
-
[56]
P., & Scott, D.\ 2011, , 83, 103515
Moss, A., Zibin, J. P., & Scott, D.\ 2011, , 83, 103515
2011
-
[57]
W., Kirshner, R
Moody, J. W., Kirshner, R. P., MacAlpine, G. M., et al.\ 1987, , 314, L33
1987
-
[58]
G., & Karachentsev, I
Nasonova, O. G., & Karachentsev, I. D.\ 2011, Astrophysics, 54, 1
2011
-
[59]
C., Dopita, M
Nicholls, D. C., Dopita, M. A., Sutherland, R. S., et al.\ 2014, , 786, 155
2014
-
[60]
C., Jerjen, H., Dopita, M
Nicholls, D. C., Jerjen, H., Dopita, M. A., et al.\ 2014, , 780, 88
2014
-
[61]
C., Vogeley, M
Pan, D. C., Vogeley, M. S., Hoyle, F., et al.\ 2012, , 421, 926
2012
-
[62]
P., et al.\ 2015, , 574, A113
Papastergis, E., Giovanelli, R., Haynes, M. P., et al.\ 2015, , 574, A113
2015
-
[63]
G., Prada, F., Holtzman, J., et al.\ 2006, , 372, 1710
Patiri, S. G., Prada, F., Holtzman, J., et al.\ 2006, , 372, 1710
2006
-
[64]
Peebles, P. J. E.\ 2001, , 557, 495
2001
-
[65]
Peebles, P. J. E., & Nusser, A.\ 2010, , 465, 565
2010
-
[66]
Peimbert, M., & Torres-Peimbert, S.\ 1992, , 253, 349
1992
-
[67]
Platen, E., van de Weygaert, R., & Jones, B. J. T.\ 2007, , 380, 551
2007
-
[68]
C., Hopp, U., & Els\"asser, H.\ 1997, , 325, 881
Popescu, C. C., Hopp, U., & Els\"asser, H.\ 1997, , 325, 881
1997
-
[69]
C., Hopp, U., & Rosa, M
Popescu, C. C., Hopp, U., & Rosa, M. R.\ 1999, , 350, 414
1999
-
[70]
J.\ 1984, , 281, 95
Postman, M., & Geller, M. J.\ 1984, , 281, 95
1984
-
[71]
A., & Tepliakova, A
Pustilnik, S. A., & Tepliakova, A. L.\ 2011, , 415, 1188
2011
-
[72]
A., Martin, J.-M., Lyamina, Y
Pustilnik, S. A., Martin, J.-M., Lyamina, Y. A., et al.\ 2013, , 432, 2224
2013
-
[73]
A., Perepelitsyna, Y
Pustilnik, S. A., Perepelitsyna, Y. A., & Kniasev, A. Y.\ 2016, , 463, 670
2016
-
[74]
A., Tepliakova, A
Pustilnik, S. A., Tepliakova, A. L., & Makarov, D. I.\ 2019, , 482, 4329
2019
-
[75]
Ricciardelli, E., Cava, A., Varela, J., et al.\ 2014, , 445, 4045
2014
-
[76]
R., Vogeley, M
Rojas, R. R., Vogeley, M. S., Hoyle, F., et al.\ 2005, , 624, 571
2005
-
[77]
P., et al.\ 2008, , 135, 588
Saintonge, A., Giovanelli, R., Haynes, M. P., et al.\ 2008, , 135, 588
2008
-
[78]
J., Hanson, M
Salzer, J. J., Hanson, M. M., & Gavazzi, G.\ 1990, , 353, 39
1990
-
[79]
J., Gronwall, C., Lipovetsky, V
Salzer, J. J., Gronwall, C., Lipovetsky, V. A., et al.\ 2000, , 120, 80
2000
-
[80]
J., Gronwall, C., Lipovetsky, V
Salzer, J. J., Gronwall, C., Lipovetsky, V. A., et al.\ 2001, , 121, 66
2001
-
[81]
J., Gronwall, C., Sarajedini, V
Salzer, J. J., Gronwall, C., Sarajedini, V. L., et al.\ 2002, , 123, 1292
2002
-
[82]
J., Jangren, A., Gronwall, C., et al.\ 2005a, , 130, 2584
Salzer, J. J., Jangren, A., Gronwall, C., et al.\ 2005a, , 130, 2584
-
[83]
J., Lee, J
Salzer, J. J., Lee, J. C., Melbourne, J., et al.\ 2005b, , 624, 661
-
[84]
J., Williams, A
Salzer, J. J., Williams, A. L., & Gronwall, C.\ 2009, , 695, L67
2009
-
[85]
Sanduleak, N., & Pesch, P.\ 1982, , 258, L11
1982
-
[86]
Sanduleak, N., & Pesch, P.\ 1987, , 63, 809
1987
-
[87]
Schechter, P.\ 1976, , 203, 297
1976
-
[88]
A., & Huchra, J.\ 1988, , 95, 1602
Strauss, M. A., & Huchra, J.\ 1988, , 95, 1602
1988
-
[89]
A., Weinberg, D
Strauss, M. A., Weinberg, D. H., Lupton, R. H., et al.\ 2002, , 124, 1810
2002
-
[90]
H., Gregg, M
Szomoru, A., van Gorkom, J. H., Gregg, M. D., et al.\ 1996, , 111, 2150
1996
-
[91]
G., Kirshner, R
Tifft, W. G., Kirshner, R. P., Gregory, S. A., et al.\ 1986, , 310, 75
1986
-
[92]
V., & Klypin, A.\ 2009, , 395, 1915
Tikhonov, A. V., & Klypin, A.\ 2009, , 395, 1915
2009
-
[93]
L., & Conroy, C.\ 2009, , 691, 633
Tinker, J. L., & Conroy, C.\ 2009, , 691, 633
2009
-
[94]
A., Heckman, T
Tremonti, C. A., Heckman, T. M., Kauffmann, G., et al.\ 2004, , 613, 898
2004
-
[95]
Varela, J., Betancort-Rijo, J., Trujillo, I., et al.\ 2012, , 744, 82
2012
-
[96]
van de Weygaert, R., & Platen, E.\ 2011, International Journal of Modern Physics Conference Series, 41
2011
-
[97]
E.\ 1987, , 63, 295
Veilleux, S., & Osterbrock, D. E.\ 1987, , 63, 295
1987
-
[98]
J., Jangren, A., et al.\ 2003, , 125, 2373
Wegner, G., Salzer, J. J., Jangren, A., et al.\ 2003, , 125, 2373
2003
-
[99]
A.\ 2008, , 136, 1
Wegner, G., & Grogin, N. A.\ 2008, , 136, 1
2008
-
[100]
A.\ 1988, , 331, 172
Weistrop, D., & Downes, R. A.\ 1988, , 331, 172
1988
-
[101]
C., et al.\ 1992, , 396, L23
Weistrop, D., Hintzen, P., Kennicutt, R. C., et al.\ 1992, , 396, L23
1992
-
[102]
Weistrop, D., Hintzen, P., Liu, C., et al.\ 1995, , 109, 981
1995
Reviewed August 14, 2026 · model on record in the stance chip above.
Discussion (0). Continue with ORCID to comment.