REVIEW 2 major objections 4 minor 57 references
Preserving Command Line Workflow for a Package Management System using ASCII DAG Visualization
T0 review · 2 major / 4 minor · reviewed 2026-08-14 · deepseek-v4-flash
Pith's one-line read Interactive ASCII dependency graphs win over command-line users in a head-to-head study
desk verdict Solid preference result in a well-run study; the training-attribution argument for error parity is post hoc and needs a check or a softer claim. read the letter →
The pith
A machine-rendered reading of the paper's core claim, the machinery that carries it, and where it could break.
The reading
What carries the argument
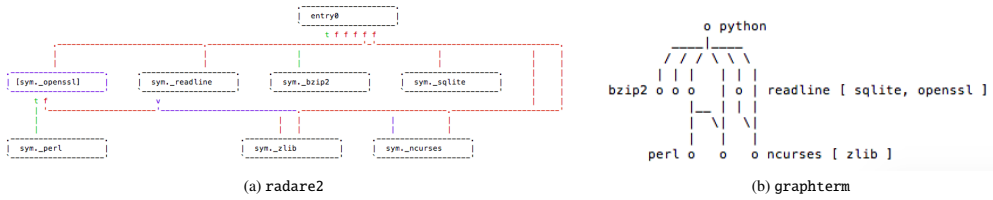
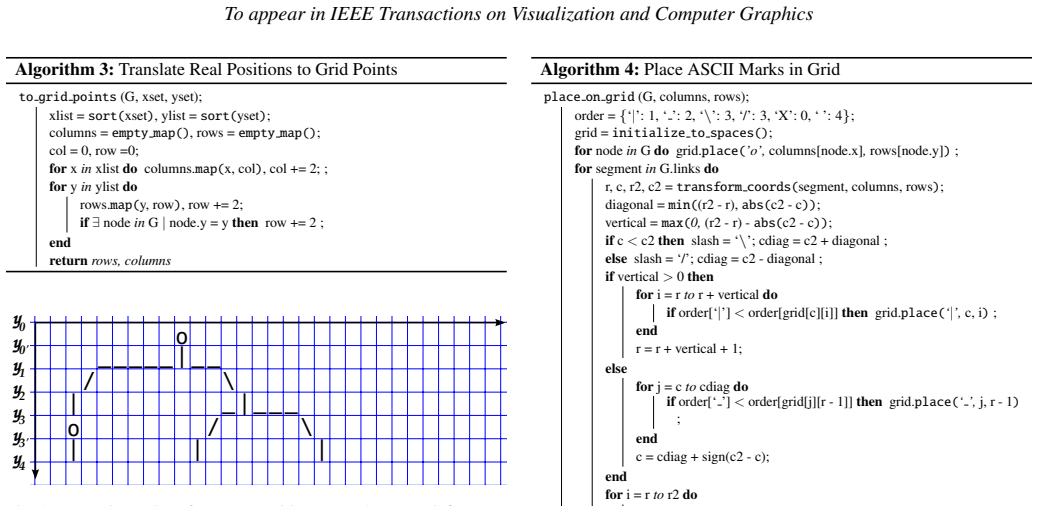
The load-bearing object is graphterm, an interactive terminal renderer that converts a layered (Sugiyama-style) graph layout, which arranges nodes in rows so edges flow in one direction, into a compact ASCII grid using only the glyphs {|, -, /, \, X, o}. The conversion begins from the Tulip hierarchical layout, then re-routes and bundles crossing diagonal edges to keep the grid compact, maps layout positions to a discrete grid, and places labels either beside nodes or in a bracketed right-side list. Interactivity, including slash-search, n/p node traversal, arrow-key or WASD panning, and two highlighting modes for direct versus all reachable neighbors, resolves the edge ambiguity that the compact ASCII drawing introduces.
What would settle it
A remote-session study would settle it: participants log into a cluster through a plain terminal, must generate and view the Spack dot output as a PDF on their own, including any file transfer, and then repeat the same task battery; if graphterm's preference margin disappears or reverses under that overhead, the central claim fails.
Extended reading notes
Core claim
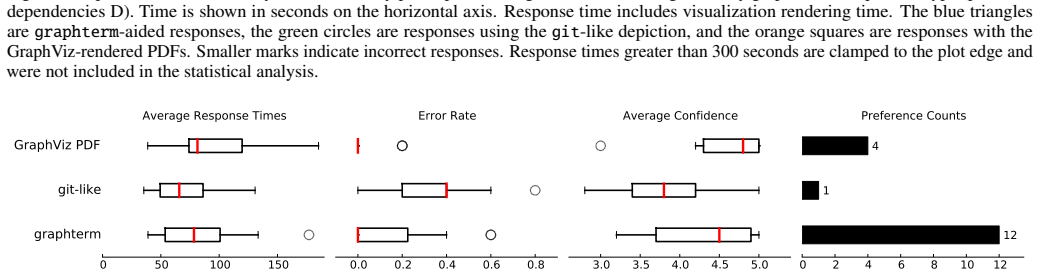
The central claim, stated on the paper's own terms, is that interactive ASCII visualization is a viable alternative to graphical dependency views for command-line users, and that users prefer it when the whole workflow happens in the terminal. The study found a weak effect of visualization on response time, with the git-like ASCII workflow faster than the GraphViz-PDF workflow (p < 0.05 post hoc), while both ASCII workflows produced more errors and lower confidence than the PDF workflow. Preference did not track accuracy: eleven of fifteen participants reported preferring graphterm, nine used only graphterm during the free-choice block, and all three Spack-experienced participants chose it. The authors interpret this as evidence that users accept a sub-optimal visualization when it is convenient to their workflow, but also note the tradeoff is not absolute, since the git-like ASCII view was not preferred.
Load-bearing premise
The load-bearing assumption is that the measured preference transfers to the remote, GUI-free scenario that motivates the work: the study ran locally or with graphical forwarding pre-enabled, so participants never faced a separate login step, a file copy, or viewer launch lag when using the PDF route.
Editorial extensions
If this is right
- Spack can ship graphterm as a third graph view, letting users inspect dependency topology without leaving the shell or copying files.
- Other terminal-bound analysis tools, such as build logs, profiler output, or git histories, can adopt the same pattern: interactive ASCII for quick topology questions, with a high-fidelity export reserved for precise reading.
- Because the git-like ASCII view was the least preferred despite being fastest, the result is not 'ASCII is good' but 'interactive, compact, terminal-native interaction is what users reward'.
- The higher error rate in ASCII workflows means package managers should keep a precise graphical view for decisions where a missed dependency would break a build; graphterm is better framed as the quick-look tool.
- The paper attributes several graphterm errors to training and question misreading, so improving the interactive instructions could narrow the accuracy gap in actual deployments.
Reading between the lines
- If the preference persists on real remote logins, which the study did not test, graphterm-style views could plausibly become the default dependency view on HPC login nodes, where file transfer is the dominant cost.
- The study's neutralization of PDF overhead may bias the comparison toward GraphViz; a remote-session replication with unmodified login and file-copy steps could reveal an even larger preference for graphterm.
- The six-character glyph set and bundling strategy suggest a readability-versus-compactness trade-off worth measuring directly; varying the degree of bundling across graphs while holding tasks fixed could identify when ambiguity starts costing accuracy.
- Because most Spack dependency graphs have under 50 nodes, the ASCII approach is well matched to the data; applying it to larger graphs would require aggregation or focus+context, not just layout tuning.
Signed reviews
Editorial analysis
A structured set of objections, weighed in public.
Referee Report
Summary. The paper presents graphterm, an interactive ASCII DAG visualization for the Spack package manager, together with a task analysis based on interviews with Spack maintainers, a layout adaptation of Tulip's hierarchical placement to an ASCII grid, and a within-subjects user study (n=15) comparing graphterm against Spack's existing git-like ASCII graph and the GraphViz-rendered PDF workflow. The quantitative results show that ASCII workflows are faster (with a weak overall effect, p<0.1, and a significant post-hoc git-like vs. GraphViz difference), less accurate, and lower in confidence than GraphViz PDFs. The central preference finding is that 11 of 15 participants preferred graphterm directly and 9 of 15 used only graphterm in the free-choice block, including all three Spack-experienced participants. The paper argues from these results that graphterm is a viable alternative for command-line users despite the accuracy and confidence costs.
Significance. The paper makes a concrete, falsifiable empirical claim: interactive ASCII dependency graphs can be preferred in command-line workflows even when they carry accuracy and confidence costs. The in-sample preference result is well supported, the study is reported with appropriate statistical hedging on the weaker effects, and the authors are candid about limitations. Strengths include the open-source graphterm tool, the systematic GitHub survey of dependency visualization practice, the task-analysis grounding, and the honesty about participant-recruitment constraints. The main significance is conditional on scoping: the measured preference is for a local or pre-configured terminal setting, and the broader 'viable alternative' claim depends on a post hoc attribution of graphterm's extra errors to insufficient training rather than intrinsic ASCII difficulty. Neither issue invalidates the preference result, but both need to be addressed before the paper's central conclusion can be accepted at face value.
major comments (2)
- [Sec. 6.2 (Discussion) and Sec. 6.3 (Limitations)] The claim in Sec. 6.2 that 'the error rate in practice may be comparable' is load-bearing for the paper's viability conclusion, but it rests on an unmeasured causal attribution. The paper classifies six of the ten graphterm errors as due to insufficient training, yet Sec. 6.3 only observes that the error pattern 'may indicate' insufficient training; no training-comprehension check was administered. The same participants (P5 and P6) committed 6 of the 10 graphterm errors and 4 of the 23 git-like errors, which is equally consistent with an intrinsic difficulty of the ASCII orientation convention (e.g., the o-node and diagonal/vertical mark conventions) rather than a correctable training gap. I ask the authors to either (a) report the error comparison with and without P5, P6, P7, and P10, (b) add an objective training-comprehension measure, or (c) remove the 'may be comparable' claim and reframe the contribution around the supported preference result. Note also that the accounting in Sec. 6.2 is incomplete as written: 2 + 6 = 8, not 10, of the graphterm errors are accounted for by the stated attributions.
- [Sec. 6.3 (Effect of Study Setup on Response Time)] The motivating scenario of the paper is remote command-line access, where file transfer and X11 forwarding impose overhead (Sec. 3.2, Workflow). However, Sec. 6.3 states that participants ran locally or were pre-warned to enable X11 forwarding, and that 'participants did not experience the scenario where a separate login operation or file copy was required to view a PDF or image file.' This removes exactly the cost that the proposed tool is designed to eliminate. The in-sample preference is not invalidated, but the abstract's claim that participants preferred graphterm 'when approached from a command line interface workflow' should be scoped to local or pre-configured terminals; as written, the paper over-generalizes the preference to the remote scenario that motivates it. A remote-condition study or a more conservative statement of scope is needed.
minor comments (4)
- [Sec. 6 (Results and Analysis)] In the paragraph 'ASCII Visualizations Resulted in Lower Response Confidence,' the reported p-value 'p < 0.5' should read 'p < 0.05' to be consistent with the chi-square test used and with the surrounding language.
- [References] In reference [8], the journal title is printed as 'IEEE Transactions on Visualization and Computer Grahpics'; this should be corrected to 'Graphics.'
- [Sec. 3.1 (Visualizing Dependencies in Spack)] The sentence claiming the git-like layout is 'an unambiguous representation: when one edge is routed into another, they both exit at the same terminus' is unclear; if two edges share routing, the representation may still be ambiguous to a viewer, so this phrasing should be revised.
- [Fig. 11] The x-axis label 'Maximum Bracket Lengths (Labels)' would be clearer as 'Maximum number of labels in a bracketed list,' since the histogram measures label counts rather than physical lengths.
Circularity Check
No circularity found: the preference and accuracy claims are empirical measurements from a within-subjects study, not derivations from the paper's own definitions or fitted parameters.
full rationale
The paper's load-bearing claims are empirical: graphterm was preferred by 11/15 participants in direct questioning and 9/15 in the free-choice block, with response time, accuracy, and confidence measured in a within-subjects study. None of these results is defined in terms of a prior input; no parameter is fitted to a subset of data and then reported as a prediction, and no uniqueness theorem is imported from the authors' prior work. The task analysis (Sec. 3.2) is based on interviews with Spack maintainers and was reviewed by a co-author, but it does not define the outcome measures, so this is a mild self-validation, not a circular reduction. Self-citations to Spack and to Tulip are references to the system under study and to an external layout library, respectively, and are not used to justify the measured preference. The Sec. 6.2 attribution of some graphterm errors to misread questions or insufficient training is a post hoc interpretation that is not backed by a measured training-comprehension check; this is a threat to the validity of the 'comparable error rate' inference, but it is not circular because those error counts are observed data rather than outputs of the paper's model. The study limitations in Sec. 6.3, including the absence of a remote file-copy or separate-login condition, weaken external validity of the 'command line workflow' framing but do not make any claim equal to its input by construction. In sum, the derivation chain is self-contained and empirical; no specific reduction to inputs is exhibited.
Assumptions & free parameters
free parameters (4)
- Grid spacing multiplier (2x) =
2
- Edge re-route offset factor (0.5) =
0.5
- Row doubling for node rows =
extra grid row per node row
- Glyph priority order =
{'|':1, '_':2, '/':3, '\\':3, 'X':0, ' ':4}
assumptions (5)
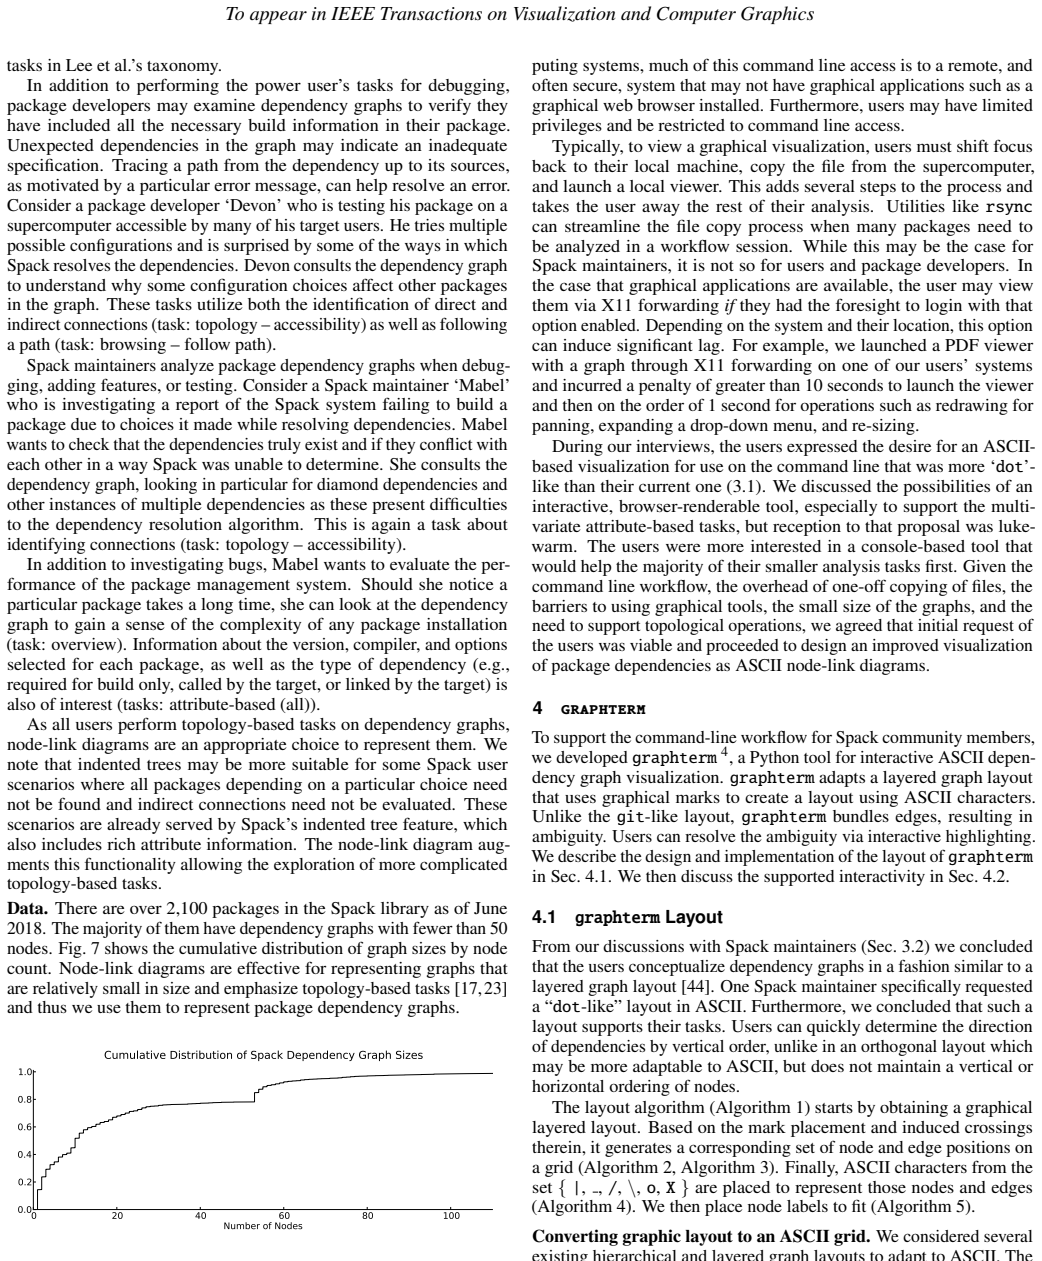
- domain assumption Spack package dependency graphs are directed acyclic graphs with typically at most a few tens of nodes (Fig. 7), so node-link diagrams are appropriate.
- domain assumption Interviews with two Spack maintainers (one a co-author) yield a representative characterization of user groups and tasks.
- domain assumption A layered (dot-like) layout matches users' mental model and supports the identified tasks.
- domain assumption The Gestalt principle of continuation makes edge-glyph collision resolution safe for readability.
- domain assumption The 15 analyzed participants are representative of command-line Spack users.
Cite this review
Pith. "Pith review of Preserving Command Line Workflow for a Package Management System using ASCII DAG Visualization." pith.science (2026). https://pith.science/paper/IMCG3EFI
@misc{pith2026190807544,
  author       = {Pith},
  title        = {Pith review of: Preserving Command Line Workflow for a Package Management System using ASCII DAG Visualization},
  year         = {2026},
  howpublished = {\url{https://pith.science/paper/IMCG3EFI}},
  note         = {Machine review of arXiv:1908.07544}
}
read the original abstract
Package managers provide ease of access to applications by removing the time-consuming and sometimes completely prohibitive barrier of successfully building, installing, and maintaining the software for a system. A package dependency contains dependencies between all packages required to build and run the target software. Package management system developers, package maintainers, and users may consult the dependency graph when a simple listing is insufficient for their analyses. However, users working in a remote command line environment must disrupt their workflow to visualize dependency graphs in graphical programs, possibly needing to move files between devices or incur forwarding lag. Such is the case for users of Spack, an open source package management system originally developed to ease the complex builds required by supercomputing environments. To preserve the command line workflow of Spack, we develop an interactive ASCII visualization for its dependency graphs. Through interviews with Spack maintainers, we identify user goals and corresponding visual tasks for dependency graphs. We evaluate the use of our visualization through a command line-centered study, comparing it to the system's two existing approaches. We observe that despite the limitations of the ASCII representation, our visualization is preferred by participants when approached from a command line interface workflow.
Figures


Figures from the paper (14 more)








Reference graph
Works this paper leans on
-
[1]
T. Abrahamsson. Emacs Artist. http://www.lysator.liu.se/˜tab/artist/, Ac- cessed 2017-03, Updated 2014-03
work page 2017
-
[2]
S. Alvarez. radare2. http://github.com/radare, Accessed 2017-03
work page 2017
-
[3]
D. Auber. Tulip - a huge graph visualization framework. In M. Junger and P. Mutzel, eds., Graph Drawing Software, pp. 105–126. 2004
work page 2004
-
[4]
C. Barski. vijual. http://lisperati.com/vijual/, Accessed 2017-06, Last Updated 2010-01
work page 2017
- [5]
- [6]
-
[7]
J. E. Bresenham. Algorithm for computer control of a digital plotter. IBM Systems Journal, 4(1):25–30, 1965. doi: 10.1147/sj.41.0025
-
[8]
P. Caserta and O. Zendra. Visualization of the static aspects of software: A survey. IEEE Transactions on Visualization and Computer Grahpics, 17(7):913–933, 2011. doi: 10.1109/TVCG.2010.110
Show all 57 references
-
[9]
Chimani, C
M. Chimani, C. Gutwenger, M. J ¨unger, G. W. Klau, K. Klein, and P. Mutzel. The Open Graph Drawing Framework (OGDF), pp. 543–569. CRC Press, 2014
2014
-
[10]
Cornelissen, D
B. Cornelissen, D. Holten, A. Zaidman, L. Moonen, J. J. van Wijk, and A. van Deursen. Understanding execution traces using massive sequence and circular bundle views. In Proceedings of the IEEE International Conference on Program Comprehension, pp. 49–58, 2007. doi: 10.1109/ I...
2007
-
[11]
Dwyer, N
T. Dwyer, N. Henry Riche, K. Marriott, and C. Mears. Edge compression techniques for visualization of dense directed graphs. IEEE Transactions on Visualization and Computer Graphics, 19(12):961–968, 2013. doi: 10. 1109/TVCG.2013.151
2013
-
[12]
J. W. E. Eaton, D. Bateman, S. Hauberg, and R. Wehbring. GNU Octave version 3.8.1 manual: a high-level interactive language for numerical computations. CreateSpace Independent Publishing Platform, 2014. ISBN 1441413006
2014
-
[13]
T. Gamblin. Spack. https://github.com/LLNL/spack, Accessed 2017-03
2017
-
[14]
Gamblin, M
T. Gamblin, M. P. LeGendre, M. R. Collette, G. L. Lee, A. Moody, B. R. de Supinski, and W. S. Futral. The Spack package manager: Bringing order to HPC software chaos. In SC15: International Conference for High Performance Computing, Networking, Storage and Analysis , pp. 1–12,...
2015
-
[15]
E. R. Gansner, E. Koutsofios, S. C. North, and K.-P. V o. A technique for drawing directed graphs. IEEE Transactions on Software Engineering, 19(3):214–230, 1993. doi: 10.1109/32.221135
1993 doi
-
[16]
E. R. Gansner and S. C. North. An open graph visualization system and its applications to software engineering. Software – Practice and Experience, 30(11):1203–1233, 2000
2000
-
[17]
Ghoniem, J.-D
M. Ghoniem, J.-D. Fekete, and P. Castagliola. A comparison of the readability of graphs using node-link and matrix-based representations. In Proceedings of the IEEE Symposium on Information Visualization, pp. 17–24, 2004. doi: 10.1109/INFVIS.2004.1
2004 doi
-
[18]
L. M. Haibt. A program to draw multilevel flow charts. In Proceedings of the Western Joint Computer Conference, IRE-AIEE-ACM ’59 (Western), pp. 131–137. ACM, 1959. doi: 10.1145/1457838.1457861
1959
-
[19]
K. N. I. Hamouda. AsciiO. http://search.cpan.org/dist/App- Asciio/lib/App/Asciio.pm, Accessed 2017-03
2017
-
[20]
L. Hemens. ASCIIFlow. http://www.asciiflow.com, Accessed 2017-03. 13
2017
-
[21]
Hothorn, F
T. Hothorn, F. Bretz, and P. Westfall. Simultaneous inference in general parametric models. Biometrical Journal, 50(3):346–363, 2008. doi: 10. 1002/bimj.200810425
2008
-
[22]
M. Howell. Homebrew, the missing package manager for OS X. http://brew.sh, Accessed November 2017
2017
-
[23]
Keller, C
R. Keller, C. M. Eckert, and P. J. Clarkson. Matrices or node-link diagrams: which visual representation is better for visualizing connectivity models? Information Visualization, 5(1):62–76, 2006. doi: 10.1057/palgrave.ivs. 9500116
2006 doi
-
[24]
D. E. Knuth. Computer-drawn flowcharts. Communications of the ACM, 6(9):555–563, 1963. doi: 10.1145/367593.367620
1963
-
[25]
R. Koschke. Software visualization in software maintenance, reverse engineering, and re-engineering: A research survey. Journal of Software Maintenance and Evolution: Research and Practice, 15(2):87–109, 2003. doi: 10.1002/smr.270
2003 doi
-
[26]
R. G. Kula, C. De Roover, D. German, T. Ishio, and K. Inoue. Visualizing the evolution of systems and their library dependencies. In Proceedings of the IEEE Working Conference on Software Visualization, pp. 127–136, Sept. 2014. doi: 10.1109/VISSOFT.2014.29
2014 doi
-
[27]
B. Lee, C. Plaisant, C. S. Parr, J.-D. Fekete, and N. Henry. Task taxonomy for graph visualization. In Proceedings of the AVI Workshop on BEyond Time and Errors: Novel Evaluation Methods for Information Visualization, pp. 1–5, 2006. doi: 10.1145/1168149.1168168
2006
-
[28]
Liu and J
Z. Liu and J. Heer. The effects of interactive latency on exploratory visual analysis. IEEE Transactions on Visualization and Computer Graphics, 20(12):2122–2131, Dec 2014. doi: 10.1109/TVCG.2014.2346452
2014
-
[29]
Marku˘s, M
N. Marku˘s, M. Fratarcangeli, I. S. Pand ˘zi´c, and J. Ahlberg. Faster ren- dering of image mosaics and ASCII art. Computer Graphics Forum, 34(6):251–261, 2015. doi: 10.1111/cgf.12597
2015 doi
-
[30]
D. Merkel. Docker: Lightweight linux containers for consistent develop- ment and deployment. Linux Journal, 2014(239), Mar. 2014
2014
-
[31]
Noack and C
A. Noack and C. Lewerentz. A space of layout styles for hierarchical graph models of software systems. In Proceedings of the ACM Symposium on Software Visualization, pp. 155–164, 2005. doi: 10.1145/1056018. 1056040
2005 doi
-
[32]
P. D. O’Grady and S. T. Rickard. Automatic ASCII art conversion of binary images using non-negative constraints. In Proceedings of the Irish Signals and Systems Conference, pp. 186–191, 2008. doi: 10.1049/cp:20080660
2008 doi
-
[33]
C. Pettitt. dagre. https://github.com/cpettitt/dagre, Accessed 2017-06
2017
-
[34]
H. C. Purchase, M. McGill, L. Colpoys, and D. Carrington. Graph drawing aesthetics and the comprehensions of UML class diagrams: an empiri- cal study. In Proceedings of the Australian Symposium on Information Visualization, pp. 129–137, 2001
2001
-
[35]
R: A Language and Environment for Statistical Computing
R Core Team. R: A Language and Environment for Statistical Computing. R Foundation for Statistical Computing, Vienna, Austria, 2014
2014
-
[36]
MPI: A message-passing interface standard, version 3.1, June 4, 2015
Message Passing Interface Forum. MPI: A message-passing interface standard, version 3.1, June 4, 2015
2015
-
[37]
Reniers, L
D. Reniers, L. V oinea, and A. Telea. Visual exploration of program structure, dependencies and metrics with SolidSX. In Proceedings of the IEEE International Workshop on Visualizating Software for Understanding and Analysis, pp. 1–4, 2011. doi: 10.1109/VISSOF.2011.6069461
2011
-
[38]
M. Russell. ascii-graphs. https://github.com/mdr/ascii-graphs, Accessed 2017-06
2017
-
[39]
A. Rusu, A. J. Fabian, R. Jianu, and A. Rusu. Using the Gestalt Principle of Closure to Alleviate the Edge Crossing Problem in Graph Drawings. In Proceedings of the 15th International Conference on Information Visual- ization, 11. doi: 10.1109/IV.2011.63
-
[40]
Sensalire, P
M. Sensalire, P. Ogao, and A. Telea. Evaluation of software visualization tools: Lessons learned. In Proceedings of the IEEE International Workshop on Visualizing Software for Understanding and Analysis, pp. 19–26, Sept
-
[41]
G. N. Silva. APT Howto. Technical report, Debian, 2001. http://www. debian. org/doc/manuals/apt-howto
2001
-
[42]
Simpkins and J
A. Simpkins and J. C. Hamano. Add history graph API. git repository commit c12172d2eab91b79b8181b04ab5a5332a96e34a8, accessed from https://github.com/git/git June 2017, May 2008
2017
-
[43]
M.-A. D. Storey and H. A. M¨uller. Manipulating and documenting soft- ware structures using SHriMP Views. In Proceedings of International Conference on Software Maintenance, pp. 275–284, Oct. 1995. doi: 10. 1109/ICSM.1995.526549
1995
-
[44]
Sugiyama, S
K. Sugiyama, S. Tagawa, and M. Toda. Methods for visual understanding of hierarchical system structures. IEEE Transactions on Systems, Man, and Cybernetics, 11(2):109–125, 1981. doi: 10.1109/TSMC.1981.4308636
1981
-
[45]
Takeuchi, D
Y . Takeuchi, D. Takafuji, Y . Ito, and K. Nakano. ASCII art generation using the local exhaustive search on the GPU. In Proceedings of the International Symposium on Computing and Networking , pp. 194–200, Dec. 2013. doi: 10.1109/CANDAR.2013.35
2013 doi
-
[46]
Tamassia
R. Tamassia. On embedding a graph in the grid with the minimum number of bends. SIAM Journal on Computing, 16(3):421–444, 1987. doi: 10. 1137/0216030
1987
-
[47]
Tamassia, ed
R. Tamassia, ed. Handbook of Graph Drawing and Visualization. CRC Press, Aug. 2013
2013
-
[48]
Graph::Easy
Tels. Graph::Easy. http://bloodgate.com/perl/graph/manual/, Accessed 2016-09. Updated: 2007-09
2016
-
[49]
Ware and R
C. Ware and R. Bobrow. Motion to support rapid interactive queries on node-link diagrams. ACM Transactions on Applied Perception, 1(1):3–18,
-
[50]
C. Ware, H. Purchase, L. Colpoys, and M. McGill. Cognitive measure- ments of graph aesthetics. Information Visualization, 1(2):103–110, 2002. doi: 10.1057/palgrave.ivs.9500013
2002 doi
-
[51]
Williams, C
T. Williams, C. Kelley, R. Lang, D. Kotz, J. Campbell, G. Elber, and A. Woo. gnuplot. http://www.gnuplot.info, Accessed 2017-03
2017
-
[52]
B. Winter. Linear models and linear mixed effects models in R with linguistic applications. arXiv:1308.5499, 2013
2013 arXiv
-
[53]
X. Xu, L. Zhang, and T.-T. Wong. Structured-based ASCII Art. ACM Transactions on Graphics, 29(4):52:1–52:10, 2010. doi: 10.1145/1778765 .1778789
2010 doi
-
[54]
Yoghourdjian, T
V . Yoghourdjian, T. Dwyer, G. Gange, S. Kieffer, K. Klein, and K. Mar- riott. High-quality ultra-compact grid layout of grouped networks. IEEE Transactions on Visualization and Computer Graphics, 22(1):339–349,
-
[2004]
doi: 10.1145/1008722.1008724
-
[2009]
doi: 10.1109/VISSOF.2009.5336431
2009
-
[2016]
site:github.com visualize de- pendencies
doi: 10.1109/TVCG.2015.2467251 A E XPERIMENTAL OBJECTS USED IN STUDY We provide more details about the experimental objects used in the study. Table 4 appends information about the number of layers per graph, the division of nodes in each layer, and the layers on which the tar...
2015
Reviewed August 14, 2026 · model on record in the stance chip above.
Discussion (0). Continue with ORCID to comment.