REVIEW 4 major objections 6 minor 63 references
Siblings, friends and acquaintances: Testing galaxy association methods
T0 review · 4 major / 6 minor · reviewed 2026-08-14 · deepseek-v4-flash
Pith's one-line read Friends-of-Friends galaxy grouping, the standard percolation method for identifying groups and clusters in surveys, systematically over-associates members around massive halos in dense environments, inflating cluster-scale systems to…
desk verdict Honest FoF calibration study whose qualitative contamination result holds, but whose headline percentages lack error bars and come from in-sample tuning. read the letter →
The pith
A machine-rendered reading of the paper's core claim, the machinery that carries it, and where it could break.
The reading
What carries the argument
The machinery is the Friends-of-Friends linking-length percolation algorithm, which links galaxies whose projected separation and radial-velocity difference both fall below thresholds $D_{\mathrm{p,max}}$ and $V_{\mathrm{R,max}}$. The central diagnostic is the ratio $\mathrm{RS/O}$: the number of satellites that the simulation's halo finder assigns to a main halo divided by the number of halos that FoF associates to it, so values below one count fake positives. The other load-bearing element is the truth definition: the halo finder's host/satellite tree in the MDPL2 simulation, taken as the correct galaxy-group membership. Around this, the paper builds empirical 95th-percentile fits for maximum projected distance and radial velocity difference as functions of main-halo mass, and uses them as post-processing cuts together with a nearest-neighbour substructure test to flag or remove contaminated systems.
What would settle it
Redo the same FoF runs on MDPL2 but replace the simulation's host/satellite tree with a different subhalo-tracking definition of true membership, then recompute the fraction of massive main halos with $\mathrm{RS/O}<1$ in the densest environmental bin; if the fraction drops from roughly 62% to below about 20%, the claimed contamination is an artefact of the chosen truth definition rather than of FoF itself.
Extended reading notes
Core claim
The central discovery is that the percolation/FoF association method, even with linking lengths optimised on the simulation, is not uniformly accurate: its success depends strongly on environment. In the densest environmental percentiles, typical of rich groups and clusters, about 62% of main halos with at least two satellites have $\mathrm{RS/O}<1$, meaning the method attaches more satellites than are gravitationally bound, with a mean ratio of 0.5 and scatter 0.22. When the FoF output is used to define $>10^{15}\,h^{-1}M_\odot$ clusters, the method returns roughly four times the true number of central galaxies and seven times the true number of satellites; the excess members are mostly low-mass field halos that contribute little mass but inflate velocity dispersions and distort conditional luminosity functions. The authors argue that these are not artefacts of the added velocity uncertainties, which change only about 1% of classifications, but consequences of the method's geometry in high-density regions, and that applying cuts derived from the simulation, such as the 95th percentile of maximum projected satellite distance and radial velocity difference as functions of main-halo mass, markedly improves the recovered group properties.
Load-bearing premise
The whole accuracy calculation assumes the simulation's own halo-finder grouping, the host/satellite labels, is the correct galaxy-group membership; if that grouping is ambiguous, especially for infalling galaxies near cluster edges, the quoted contamination fractions measure disagreement with the halo finder rather than error against physical groups.
Editorial extensions
If this is right
- FoF-based group and cluster catalogues in dense environments carry a large fraction of fake members, so observables computed from those members, such as velocity dispersions, harmonic radii, and conditional luminosity functions, are biased even when the linking parameters are chosen for maximum overall success.
- Counting systems with FoF-defined virial masses above $10^{15}\,h^{-1}M_\odot$ overproduces clusters by a factor of roughly four in centrals and seven in satellites, so richness- and luminosity-based cluster samples built this way are substantially contaminated at the high-mass end.
- Applying the paper's mass-dependent cuts on maximum projected distance and radial velocity difference, together with substructure tests, can reduce but not eliminate the contamination; the substructure test only flags a third to half of the contaminated systems at moderate confidence.
- Low-density environments are much less affected, so FoF results for field galaxies and small groups are more trustworthy than those for clusters.
- Radial-velocity uncertainties are not the source of the contamination, since removing them changes only about 1% of classifications; the geometry of the linking thresholds in dense regions drives the fake-positive rate.
Reading between the lines
- A direct test of the paper's diagnosis would be to run the same FoF parameters on the same MDPL2 halo catalogue but replace the simulation's host/satellite labels with a different subhalo-tracking definition of membership; if the dense-environment contamination fraction drops below about 20%, the reported 62% is particular to the chosen truth definition rather than to FoF itself.
- The fake positives are mostly low-mass field halos projected near massive cluster halos, which suggests contamination concentrates in the infall region around clusters; a membership criterion based on infall dynamics or splashback radius could remove most spurious members without the paper's mass-dependent cuts.
- Because contamination is environment-dependent and strongest exactly where cluster-versus-field comparisons are made, the paper's numbers imply that some observed environmental trends in galaxy properties could be inflated by FoF selection artefacts; testing this would require redoing those comparisons with the paper's cleaned memberships.
- The same methodology could be applied to other association algorithms, such as Bayesian or clustering-based group finders, to see whether the contamination is a generic property of projection-based grouping or specific to percolation with fixed linking lengths.
Signed reviews
Editorial analysis
A structured set of objections, weighed in public.
Referee Report
Summary. The paper tests the standard Friends-of-Friends (FoF) linking-length percolation method for associating galaxies into groups, using the MDPL2 dark matter simulation at z=0. The authors build a mock galaxy catalogue by assigning K-band luminosities to Rockstar halos via a simple HOD, add radial-velocity uncertainties calibrated to 2MRS, and compute projected distances in three Cartesian planes. They select two tuned FoF parameter sets (cases A and B) plus the Crook et al. (2007) set (case C), then quantify success as a function of environmental density. The central finding is that FoF association in dense, cluster-like environments is heavily contaminated: for massive main halos in the densest percentile, roughly 62% have more associated members than true satellites (RS/O<1), and for systems with virial mass above 10^15 Msun/h the method produces about four times too many centrals and seven times too many satellites relative to the Rockstar bound-halo populations. The authors also propose mass-dependent cuts on maximum projected distance and radial velocity (Eq. 3 in Section 4.6) that improve the success fraction, and they apply the method to the Virgo cluster as a sanity check.
Significance. If the central result holds, it is important: raw FoF group catalogues in dense environments are not merely incomplete but heavily contaminated, which biases velocity dispersions, harmonic radii, and conditional luminosity functions. The paper uses a large public simulation, makes its benchmark assumption explicit, and gives a transparent, reproducible analysis pipeline. The Virgo application is a useful qualitative sanity check. However, the quantitative headline is weakened by the fact that the linking-length parameters are tuned on the same catalogue used for evaluation, by the absence of uncertainty estimates on the key percentages, and by the reliance on Rockstar's host/satellite classification as the definition of true membership. These issues do not undermine the qualitative direction of the result, but they do prevent the specific contamination rates from being taken as robust, calibration-free measurements.
major comments (4)
- [§4.2, §4.3] Cases (A) and (B) are selected by scanning the mesh in Figure 3 and manually choosing parameters that maximize the success fraction on the very same MDPL2 halo catalogue that is then used to measure the success fractions in Figures 4–5 and the contamination statistics in Figures 6–7 and Section 4.4. Because the headline numbers (62% of massive main halos with RS/O<1 in the densest environments, and the 4x/7x central/satellite overcounting for 10^15 Msun/h systems) are measured on the same data used for tuning, they are in-sample estimates rather than independent measures of FoF performance. Please provide an out-of-sample evaluation, for example by splitting the simulation volume into independent subvolumes, using a different simulation, or withholding a subset of halos, and report how the contamination fractions vary with plausible parameter choices.
- [§4.3, §4.4] The key percentages and distribution properties in Section 4.3 and Section 4.4 are quoted as exact values from one Gpc/h simulation at z=0, with no error bars or sample-variance estimates. The environmental density bins are not independent draws, and the three projection planes are correlated. Please add bootstrap or jackknife uncertainties over subvolumes (or over the three projection planes) for the quoted fractions such as 62%, 7%, 25%, 4x, and 7x, and for the reported means/dispersions of the RS/O distributions. Without these, the reader cannot assess whether the differences between environmental bins are significant.
- [§4.6, Eq. (3)] The constraints in Equation (3) are fitted to the 95th percentiles of DMh,max and ΔVR,max measured from the same MDPL2 simulation, and then the percolation algorithm is rerun on the same halos to demonstrate the improvement in Figure 15. This is an in-sample evaluation: the fitted curves absorb noise and peculiarities of the particular simulation, so the reported improvement is likely overestimated. Please validate the constraints on an independent simulation or an independent subvolume, propagate the fit-parameter uncertainties into the classification, and report how the improvement depends on the choice of percentile (e.g., 90th versus 99th).
- [§4.2, §4.3] The evaluation treats Rockstar's host/satellite association as the correct group membership, as stated in Section 4.2 ('Assuming the association of halos in the simulation as the correct one'). This is an explicit and honest definitional choice, but it means the quoted contamination rates are relative to Rockstar's halo-finder classification, not directly to physical galaxy-group membership. Infalling halos near cluster outskirts are particularly ambiguous, and a different halo finder or a different definition of 'true satellite' could shift the quoted percentages. Please discuss the robustness of the contamination fractions to this definitional ambiguity, or provide a side test using a different association definition (for example, splashback-based or phase-space based membership) for a subset of halos.
minor comments (6)
- [Abstract] The phrase 'In order to constraint the limitations' should read 'In order to constrain the limitations'.
- [Figure 6] The y-axis labels 'n [Mpc−3]' appear to describe a count of neighbor halos within 1.75 Mpc/h, which is not a number density. Please relabel the axis as a count (N) or convert to a true number density.
- [§4.4] In the paragraph discussing Figure 9, the text states 'Dp,max = 525 Mpc, i.e., ≈ 355 Mpc h−1'; the units should be kpc, not Mpc, and the conversion as written is inconsistent.
- [Figure 17 caption] The caption refers to 'Section sec.param' instead of the actual section number where the linking-length parameters are defined.
- [§4.6] The statement that the 95th percentile 'barely matches the 2σ deviation' is imprecise; for a Gaussian distribution the 95th percentile is approximately 1.645σ, not 2σ.
- [References] The reference 'York D. G. S. 2000' should be formatted as York et al. (2000), and the entry for Ivezić has a typographical issue in the author name.
Circularity Check
The central contamination claim is benchmarked against external Rockstar labels and is not circular, but the Section 4.6 improvement claim is in-sample: the Eq. (3) cuts are fitted to the same simulation's true satellite distances and then evaluated on that same simulation, so the reported gain is partly guaranteed by construction.
-
fitted input called prediction
[Section 4.6, Eq. (3) and Figure 15]
"For constraining the projected distances, we select as an upper limit the 95th percentile of DMh,max ... We rerun the percolation algorithm for halos more massive than 1011 M⊙ h−1 (case A), applying the restrictions in the maximum projected distance to the main halo (DMh,max) and the maximum difference in radial velocity (ΔVR,max). These restrictions resulted in an improvement in the fraction of halos accurately classified by the method."
The function in Eq. (3) is fitted to the 95th percentiles of DMh,max and ΔVR,max taken from the same MDPL2 simulation's true host–satellite pairs used for the evaluation. Rerunning the percolation algorithm with those fitted values as hard cuts and then measuring the fraction of accurately classified halos on the same simulation is therefore not an independent test: by construction roughly 95% of real satellites lie inside each fitted bound, so the reported improvement is statistically forced by the choice of thresholds. The same in-sample logic applies to the linking-length parameters of cases (A), (B) and (C), which were selected from the success map of Figure 3 on this very catalogue before being used to measure contamination fractions.
full rationale
The paper's primary claim—that FoF association produces a large fraction of contaminants for massive halos in dense environments—is derived by comparing FoF outputs against Rockstar's host/satellite classification, which is external to the FoF algorithm. The paper explicitly states this assumption ('Assuming the association of halos in the simulation as the correct one'), so the contamination measurement is definitional rather than tautological, and the Virgo-cluster application provides an external sanity check. I find no load-bearing self-citations or imported uniqueness theorems; the cited prior work is used for context and parameter choices, not to guarantee the main result. The main circularity concern is in-sample tuning. The linking-length parameters for cases (A), (B) and (C) are chosen by maximizing success on the same MDPL2 catalogue that is later used to evaluate success and contamination, which inflates apparent performance but does not by itself force the contamination fractions. More concretely, the Section 4.6 constraints are fitted to the 95th percentiles of the true satellite distance and velocity distributions (Eq. 3), and then the algorithm is rerun and the improvement is measured on the same simulation; this improvement is partly guaranteed by construction, since the fitted thresholds are derived from the very labels used as the ground truth. The paper is candid about its limitations (indicative luminosities, lack of virial masses in surveys, future work for direct survey comparison) and does not claim external validation for the constraints. Overall, the central contamination result is independent and non-circular, but the secondary improvement result and the parameter selection are in-sample, so a moderate score is appropriate.
Assumptions & free parameters
free parameters (7)
- Dp,max (Case A) =
525 kpc
- VR,max (Case A) =
980 km/s
- Dp,max (Case B) =
975 kpc
- VR,max (Case B) =
1100 km/s
- DMh,max constraint fit coefficients =
alpha=2.66, beta=-0.75, gamma=14.93
- DeltaV_R,max constraint fit coefficients =
alpha=1255, beta=-0.83, gamma=14.03
- Environmental density radius =
1.75 Mpc/h
assumptions (4)
- domain assumption Rockstar host/satellite halo assignment is the correct definition of galaxy group membership, so any deviation by the FoF method is a misclassification.
- domain assumption Each dark matter halo hosts exactly one galaxy, and galaxy luminosity is a monotonic function of halo virial mass through HOD matching.
- domain assumption The mock catalogue is complete up to the adopted virial mass limit over the full redshift range, ignoring flux-limited and redshift completeness.
- domain assumption The Crook et al. (2007) percolation algorithm with fixed linking lengths adequately represents FoF methods used in galaxy surveys.
Cite this review
Pith. "Pith review of Siblings, friends and acquaintances: Testing galaxy association methods." pith.science (2026). https://pith.science/paper/26DFN7LI
@misc{pith2026190807593,
  author       = {Pith},
  title        = {Pith review of: Siblings, friends and acquaintances: Testing galaxy association methods},
  year         = {2026},
  howpublished = {\url{https://pith.science/paper/26DFN7LI}},
  note         = {Machine review of arXiv:1908.07593}
}
abstract
In order to constraint the limitations of association methods applied to galaxy surveys, we analysed the catalogue of halos at $z=0$ of a cosmological simulation, trying to reproduce the limitations that an observational survey deal with. We focused in the percolation method, usually called Friends of Friends method, commonly used in literature. The analysis was carried on the dark matter cosmological simulation MDPL2, from the Multidark project. Results point to a large fraction of contaminants for massive halos in high density environments. Thresholds in the association parameters and the subsequent analysis of observational properties can mitigate the occurrence of fake positives. The use of tests for substructures can also be efficient in particular cases.
Figures

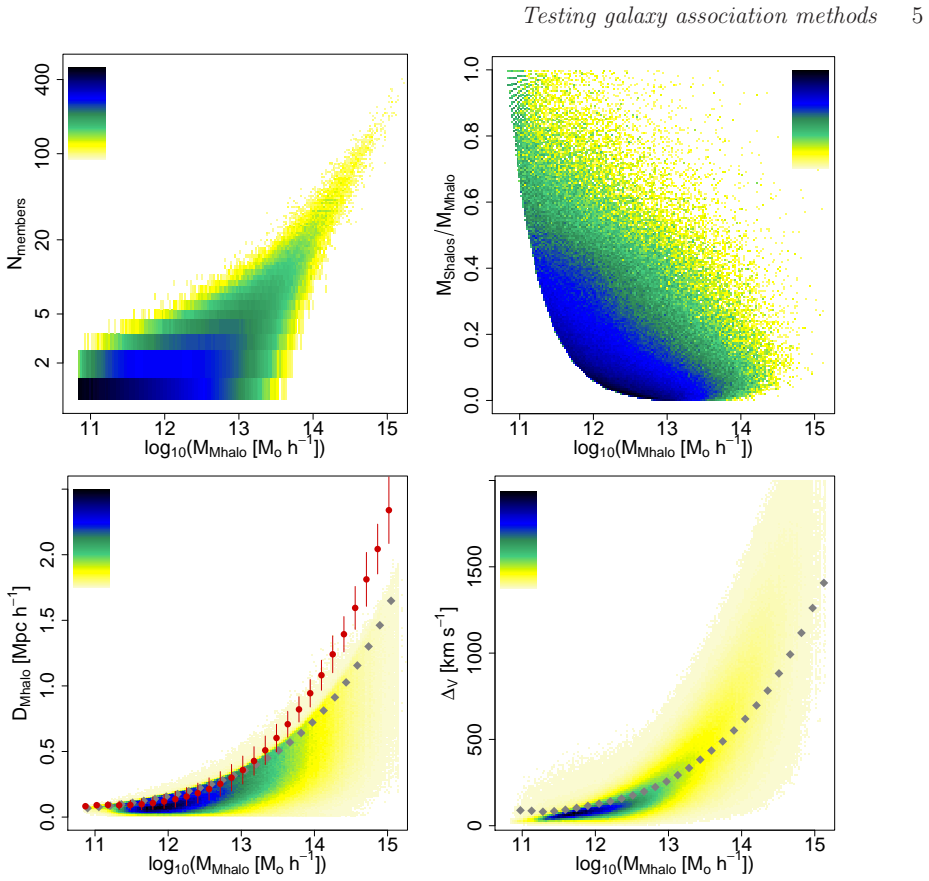

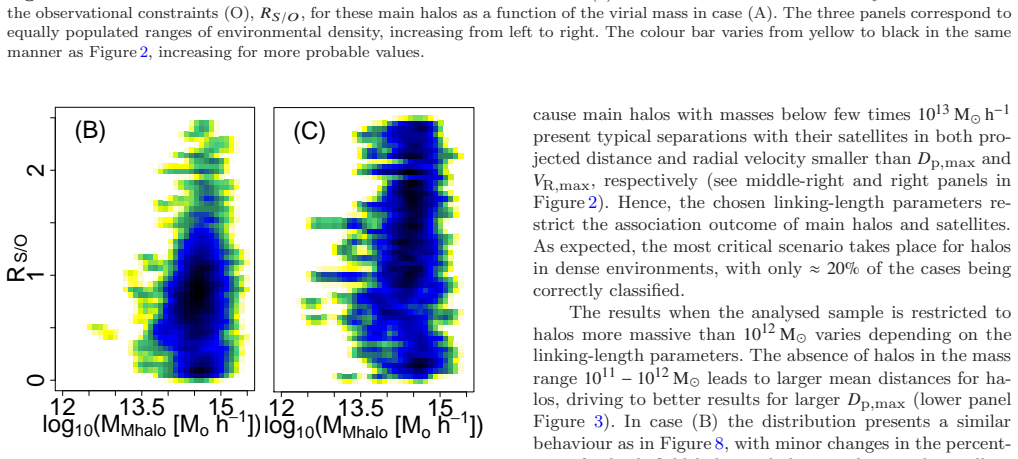
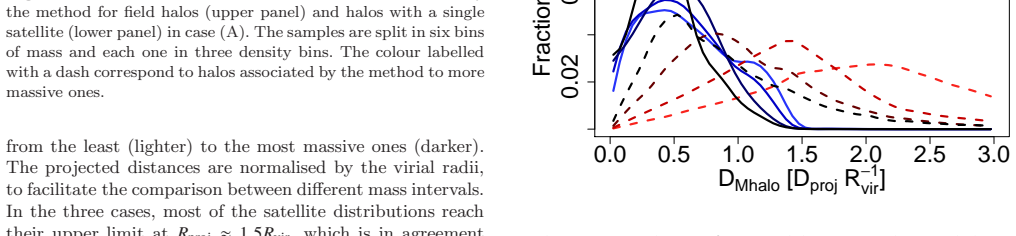
Figures from the paper (14 more)





Reference graph
Works this paper leans on
-
[1]
Abazajian K. N., et al., 2009, @doi [ ] 10.1088/0067-0049/182/2/543 , http://adsabs.harvard.edu/abs/2009ApJS..182..543A 182, 543
-
[3]
Behroozi P. S., Wechsler R. H., Wu H.-Y., 2013, @doi [ApJ] 10.1088/0004-637X/762/2/109 , https://ui.adsabs.harvard.edu/abs/2013ApJ...762..109B 762, 109
-
[4]
A., et al., 2006, @doi [ ] 10.1086/508170 , http://adsabs.harvard.edu/abs/2006ApJS..167....1B 167, 1
Berlind A. A., et al., 2006, @doi [ ] 10.1086/508170 , http://adsabs.harvard.edu/abs/2006ApJS..167....1B 167, 1
doi:10.1086/508170 2006
-
[5]
Binggeli B., Popescu C. C., Tammann G. A., 1993, , https://ui.adsabs.harvard.edu/abs/1993A&AS...98..275B 98, 275
work page 1993
- [6]
-
[8]
Caso J. P., Bassino L. P., G \'o mez M., 2015, @doi [MNRAS] 10.1093/mnras/stv2015 , http://adsabs.harvard.edu/abs/2015MNRAS.453.4421C 453, 4421
-
[9]
M., 1996, @doi [ApJ] 10.1086/176827 , http://adsabs.harvard.edu/abs/1996ApJ...458..435C 458, 435
Colless M., Dunn A. M., 1996, @doi [ApJ] 10.1086/176827 , http://adsabs.harvard.edu/abs/1996ApJ...458..435C 458, 435
doi:10.1086/176827 1996
-
[10]
Conroy C., Wechsler R. H., Kravtsov A. V., 2006, @doi [ ] 10.1086/503602 , http://adsabs.harvard.edu/abs/2006ApJ...647..201C 647, 201
doi:10.1086/503602 2006
Show all 63 references
-
[11]
A., et al., 2018, @doi [ ] 10.1093/mnras/sty1131 , http://adsabs.harvard.edu/abs/2018MNRAS.479....2C 479, 2
Cora S. A., et al., 2018, @doi [ ] 10.1093/mnras/sty1131 , http://adsabs.harvard.edu/abs/2018MNRAS.479....2C 479, 2
2018 doi
-
[12]
C., Huchra J
Crook A. C., Huchra J. P., Martimbeau N., Masters K. L., Jarrett T., Macri L. M., 2007, @doi [ ] 10.1086/510201 , http://adsabs.harvard.edu/abs/2007ApJ...655..790C 655, 790
2007 doi
-
[13]
A., 2014, @doi [ ] 10.1093/mnras/stu378 , http://adsabs.harvard.edu/abs/2014MNRAS.440.1763D 440, 1763
Duarte M., Mamon G. A., 2014, @doi [ ] 10.1093/mnras/stu378 , http://adsabs.harvard.edu/abs/2014MNRAS.440.1763D 440, 1763
2014 doi
-
[15]
R., et al., 2004b, @doi [ ] 10.1111/j.1365-2966.2004.08354.x , http://adsabs.harvard.edu/abs/2004MNRAS.355..769E 355, 769
Eke V. R., et al., 2004b, @doi [ ] 10.1111/j.1365-2966.2004.08354.x , http://adsabs.harvard.edu/abs/2004MNRAS.355..769E 355, 769
2004
-
[16]
A., et al., 2018, @doi [ ] 10.3847/1538-4357/aac32a , http://adsabs.harvard.edu/abs/2018ApJ...862..149F 862, 149
Finn R. A., et al., 2018, @doi [ ] 10.3847/1538-4357/aac32a , http://adsabs.harvard.edu/abs/2018ApJ...862..149F 862, 149
2018 doi
-
[18]
M., 1993, A&AS, http://adsabs.harvard.edu/abs/1993A
Garcia A. M., 1993, A&AS, http://adsabs.harvard.edu/abs/1993A
1993
-
[19]
Gavazzi G., Boselli A., 1996, Astrophysical Letters and Communications, http://adsabs.harvard.edu/abs/1996ApL
1996
-
[20]
Gavazzi G., Boselli A., Scodeggio M., Pierini D., Belsole E., 1999, @doi [ ] 10.1046/j.1365-8711.1999.02350.x , https://ui.adsabs.harvard.edu/abs/1999MNRAS.304..595G 304, 595
1999
-
[21]
J., Diaferio A., Kurtz M
Geller M. J., Diaferio A., Kurtz M. J., 1999, @doi [ ] 10.1086/312024 , http://adsabs.harvard.edu/abs/1999ApJ...517L..23G 517, L23
1999 doi
-
[22]
G., Baugh C
Gonzalez-Perez V., Lacey C. G., Baugh C. M., Lagos C. D. P., Helly J., Campbell D. J. R., Mitchell P. D., 2014, @doi [ ] 10.1093/mnras/stt2410 , http://adsabs.harvard.edu/abs/2014MNRAS.439..264G 439, 264
2014 doi
-
[23]
M., V \'a zquez-Mata J
Hern \'a ndez-Toledo H. M., V \'a zquez-Mata J. A., Mart \' nez-V \'a zquez L. A., Avila Reese V., M \'e ndez-Hern \'a ndez H., Ortega-Esbr \' S., N \'u \ n ez J. P. M., 2008, @doi [ ] 10.1088/0004-6256/136/5/2115 , http://adsabs.harvard.edu/abs/2008AJ....136.2115H 136, 2115
2008 doi
-
[24]
M., Jarrett T
Hess K. M., Jarrett T. H., Carignan C., Passmoor S. S., Goedhart S., 2015, preprint, http://adsabs.harvard.edu/abs/2015arXiv150606143H ( @eprint arXiv 1506.06143 )
2015 arXiv
-
[25]
Hirschmann M., De Lucia G., Iovino A., Cucciati O., 2013, @doi [ ] 10.1093/mnras/stt827 , http://adsabs.harvard.edu/abs/2013MNRAS.433.1479H 433, 1479
2013 doi
-
[26]
P., Geller M
Huchra J. P., Geller M. J., 1982, @doi [ ] 10.1086/160000 , http://adsabs.harvard.edu/abs/1982ApJ...257..423H 257, 423
1982 doi
-
[27]
P., et al., 2012, @doi [ApJS] 10.1088/0067-0049/199/2/26 , http://adsabs.harvard.edu/abs/2012ApJS..199...26H 199, 26
Huchra J. P., et al., 2012, @doi [ApJS] 10.1088/0067-0049/199/2/26 , http://adsabs.harvard.edu/abs/2012ApJS..199...26H 199, 26
2012 doi
-
[28]
arXiv:0805.2366
Ivezi \'c Z ., et al., 2008, arXiv e-prints, https://ui.adsabs.harvard.edu/\#abs/2008arXiv0805.2366I p. arXiv:0805.2366
2008 arXiv
-
[29]
Kawinwanichakij L., et al., 2017, @doi [ ] 10.3847/1538-4357/aa8b75 , http://adsabs.harvard.edu/abs/2017ApJ...847..134K 847, 134
2017 doi
-
[30]
Kim S., et al., 2014, @doi [ApJS] 10.1088/0067-0049/215/2/22 , http://adsabs.harvard.edu/abs/2014ApJS..215...22K 215, 22
2014 doi
-
[31]
Kim S., et al., 2016, @doi [ ] 10.3847/1538-4357/833/2/207 , http://adsabs.harvard.edu/abs/2016ApJ...833..207K 833, 207
2016 doi
-
[32]
A., Trujillo-Gomez S., Primack J., 2011, @doi [ ] 10.1088/0004-637X/740/2/102 , http://adsabs.harvard.edu/abs/2011ApJ...740..102K 740, 102
Klypin A. A., Trujillo-Gomez S., Primack J., 2011, @doi [ ] 10.1088/0004-637X/740/2/102 , http://adsabs.harvard.edu/abs/2011ApJ...740..102K 740, 102
2011 doi
-
[33]
Klypin A., Yepes G., Gottl\"ober S., Prada F., Heb S., 2016, @doi [MNRAS] 10.1093/mnras/stw248 , 457, 4340
2016 doi
-
[35]
Knebe A., et al., 2018, @doi [ ] 10.1093/mnras/stx2662 , http://adsabs.harvard.edu/abs/2018MNRAS.474.5206K 474, 5206
2018 doi
-
[36]
S., et al., 2001, @doi [ApJ] 10.1086/322488 , 560, 566
Kochanek C. S., et al., 2001, @doi [ApJ] 10.1086/322488 , 560, 566
2001 doi
-
[37]
Kolmogorov A., 1933, Giornale dell'Istituto Italiano degli Attuari , 4, 83
1933
-
[38]
M., Stebbins A., Annis J., Dell'Antonio I
Kubo J. M., Stebbins A., Annis J., Dell'Antonio I. P., Lin H., Khiabanian H., Frieman J. A., 2007, @doi [ ] 10.1086/523101 , http://adsabs.harvard.edu/abs/2007ApJ...671.1466K 671, 1466
2007 doi
-
[39]
M., Avila-Reese V., Abonza-Sane J., del Olmo A., 2016, @doi [ ] 10.1051/0004-6361/201527844 , http://adsabs.harvard.edu/abs/2016A
Lacerna I., Hern \'a ndez-Toledo H. M., Avila-Reese V., Abonza-Sane J., del Olmo A., 2016, @doi [ ] 10.1051/0004-6361/201527844 , http://adsabs.harvard.edu/abs/2016A
2016 doi
-
[40]
S., Engler C., Urich L., 2018, @doi [ ] 10.3847/1538-4357/aadae1 , http://adsabs.harvard.edu/abs/2018ApJ...865...40L 865, 40
Lisker T., Vijayaraghavan R., Janz J., Gallagher III J. S., Engler C., Urich L., 2018, @doi [ ] 10.3847/1538-4357/aadae1 , http://adsabs.harvard.edu/abs/2018ApJ...865...40L 865, 40
2018 doi
-
[41]
L., Mamon G
okas E. L., Mamon G. A., 2003, @doi [ ] 10.1046/j.1365-8711.2003.06684.x , http://adsabs.harvard.edu/abs/2003MNRAS.343..401L 343, 401
2003
-
[43]
Makarov D., Prugniel P., Terekhova N., Courtois H., Vauglin I., 2014, @doi [ ] 10.1051/0004-6361/201423496 , http://adsabs.harvard.edu/abs/2014A
2014 doi
-
[44]
S., Narayan G., Kirshner R
Mandel K. S., Narayan G., Kirshner R. P., 2011, @doi [ ] 10.1088/0004-637X/731/2/120 , https://ui.adsabs.harvard.edu/abs/2011ApJ...731..120M 731, 120
2011 doi
-
[45]
Materne J., 1978, , http://adsabs.harvard.edu/abs/1978A
1978
-
[46]
H., Teodorescu A
M \'e ndez R. H., Teodorescu A. M., Kudritzki R.-P., Burkert A., 2009, @doi [ ] 10.1088/0004-637X/691/1/228 , http://adsabs.harvard.edu/abs/2009ApJ...691..228M 691, 228
2009 doi
-
[47]
L., Gnedin O
Muratov A. L., Gnedin O. Y., 2010, @doi [ApJ] 10.1088/0004-637X/718/2/1266 , http://adsabs.harvard.edu/abs/2010ApJ...718.1266M 718, 1266
2010 doi
-
[48]
Niemi S.-M., Hein \"a m \"a ki P., Nurmi P., Saar E., 2010, @doi [MNRAS] 10.1111/j.1365-2966.2010.16457.x , http://adsabs.harvard.edu/abs/2010MNRAS.405..477N 405, 477
2010
-
[49]
Paturel G., 1979, , http://adsabs.harvard.edu/abs/1979A
1979
-
[50]
Planck Collaboration et al., 2013, preprint, http://adsabs.harvard.edu/abs/2013arXiv1303.5076P ( @eprint arXiv 1303.5076 )
2013 arXiv
-
[51]
S., Bai L., Ponman T
Rasmussen J., Mulchaey J. S., Bai L., Ponman T. J., Raychaudhury S., Dariush A., 2012, @doi [ ] 10.1088/0004-637X/757/2/122 , http://adsabs.harvard.edu/abs/2012ApJ...757..122R 757, 122
2012 doi
-
[52]
Ricci M., et al., 2018, @doi [ ] 10.1051/0004-6361/201832989 , http://adsabs.harvard.edu/abs/2018A
2018 doi
-
[53]
R., Hilker M., Schirmer M., 2015, @doi [A&A] 10.1051/0004-6361/201424530 , http://adsabs.harvard.edu/abs/2015A
Richtler T., Salinas R., Lane R. R., Hilker M., Schirmer M., 2015, @doi [A&A] 10.1051/0004-6361/201424530 , http://adsabs.harvard.edu/abs/2015A
2015 doi
-
[54]
Robotham A. S. G., et al., 2011, @doi [ ] 10.1111/j.1365-2966.2011.19217.x , http://adsabs.harvard.edu/abs/2011MNRAS.416.2640R 416, 2640
2011
-
[55]
P., Romanowsky A
Salinas R., Richtler T., Bassino L. P., Romanowsky A. J., Schuberth Y., 2012, @doi [A&A] 10.1051/0004-6361/201116517 , http://adsabs.harvard.edu/abs/2012A
2012 doi
-
[56]
Schaye J., et al., 2015, @doi [ ] 10.1093/mnras/stu2058 , http://adsabs.harvard.edu/abs/2015MNRAS.446..521S 446, 521
2015 doi
-
[57]
Schechter P., 1976, @doi [ ] 10.1086/154079 , http://adsabs.harvard.edu/abs/1976ApJ...203..297S 203, 297
1976 doi
-
[58]
F., et al., 2006, @doi [ ] 10.1086/498708 , http://adsabs.harvard.edu/abs/2006AJ....131.1163S 131, 1163
Skrutskie M. F., et al., 2006, @doi [ ] 10.1086/498708 , http://adsabs.harvard.edu/abs/2006AJ....131.1163S 131, 1163
2006 doi
-
[59]
Smirnov N., 1948, The Annals of Mathematical Statistics , 19, 279
1948
-
[60]
G., Nelan J., Bezanson R., 2009, @doi [AJ] 10.1088/0004-6256/138/5/1417 , http://adsabs.harvard.edu/abs/2009AJ....138.1417T 138, 1417
Tal T., van Dokkum P. G., Nelan J., Bezanson R., 2009, @doi [AJ] 10.1088/0004-6256/138/5/1417 , http://adsabs.harvard.edu/abs/2009AJ....138.1417T 138, 1417
2009 doi
-
[61]
G., Stoica R
Tempel E., Kruuse M., Kipper R., Tuvikene T., Sorce J. G., Stoica R. S., 2018, @doi [ ] 10.1051/0004-6361/201833217 , http://adsabs.harvard.edu/abs/2018A
2018 doi
-
[62]
B., 1988, Nearby galaxies catalog
Tully R. B., 1988, Nearby galaxies catalog
1988
-
[63]
B., et al., 2013, @doi [AJ] 10.1088/0004-6256/146/4/86 , http://adsabs.harvard.edu/abs/2013AJ....146...86T 146, 86
Tully R. B., et al., 2013, @doi [AJ] 10.1088/0004-6256/146/4/86 , http://adsabs.harvard.edu/abs/2013AJ....146...86T 146, 86
2013 doi
-
[64]
P., 2006, @doi [ ] 10.1111/j.1365-2966.2006.10605.x , http://adsabs.harvard.edu/abs/2006MNRAS.371.1173V 371, 1173
Vale A., Ostriker J. P., 2006, @doi [ ] 10.1111/j.1365-2966.2006.10605.x , http://adsabs.harvard.edu/abs/2006MNRAS.371.1173V 371, 1173
2006
-
[65]
Vogelsberger M., et al., 2014, @doi [ ] 10.1093/mnras/stu1536 , http://adsabs.harvard.edu/abs/2014MNRAS.444.1518V 444, 1518
2014 doi
-
[66]
Wojtak R., et al., 2018, @doi [ ] 10.1093/mnras/sty2257 , http://adsabs.harvard.edu/abs/2018MNRAS.481..324W 481, 324
2018 doi
-
[67]
York D. G. S., 2000, @doi [ ] 10.1086/301513 , http://adsabs.harvard.edu/abs/2000AJ....120.1579Y 120, 1579
2000 doi
-
[68]
de Vaucouleurs G., 1975, @doi [ ] 10.1086/154014 , http://adsabs.harvard.edu/abs/1975ApJ...202..610D 202, 610
1975 doi
-
[69]
write newline
" write newline "" before.all 'output.state := FUNCTION fin.entry write newline FUNCTION new.block output.state before.all = 'skip after.block 'output.state := if FUNCTION new.sentence output.state after.block = 'skip output.state before.all = 'skip after.sentence 'output.stat...
Reviewed August 14, 2026 · model on record in the stance chip above.
Discussion (0). Continue with ORCID to comment.