REVIEW 4 major objections 5 minor 47 references
First clear detection of the CCS Zeeman splitting toward the pre-stellar core, Taurus Molecular Cloud-1
T0 review · 4 major / 5 minor · reviewed 2026-08-14 · deepseek-v4-flash
Pith's one-line read This paper reports the first clear Zeeman detection in the CCS 45 GHz line toward the pre-stellar core TMC-1, giving a line-of-sight magnetic field of 117 ± 21 µG and implying the core is magnetically supercritical.
desk verdict A credible but not yet definitive first CCS Zeeman detection in a prestellar core; the unblended control line cannot rule out a multi-component beam-squint artifact. read the letter →
The pith
A machine-rendered reading of the paper's core claim, the machinery that carries it, and where it could break.
The reading
What carries the argument
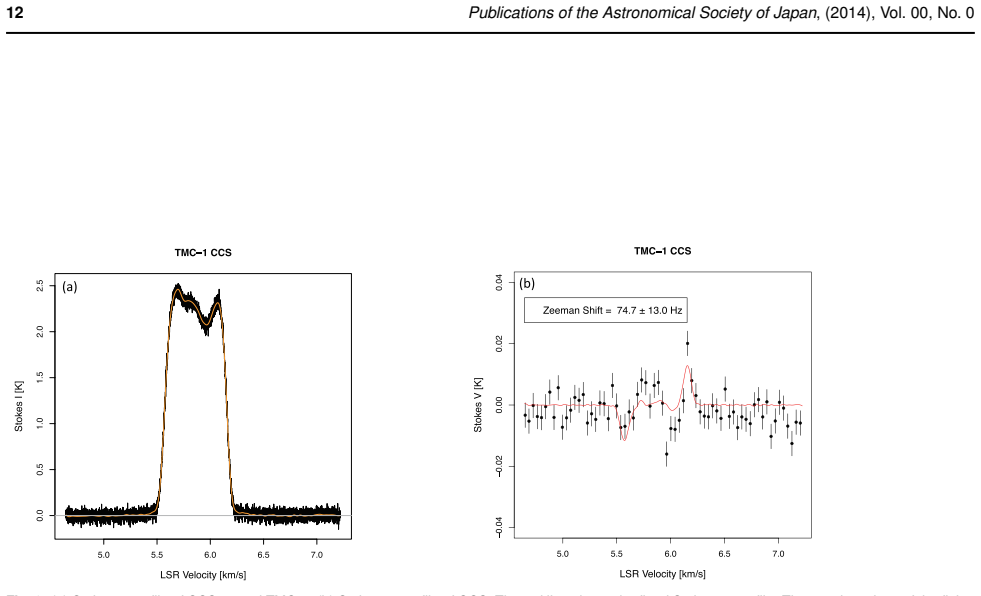
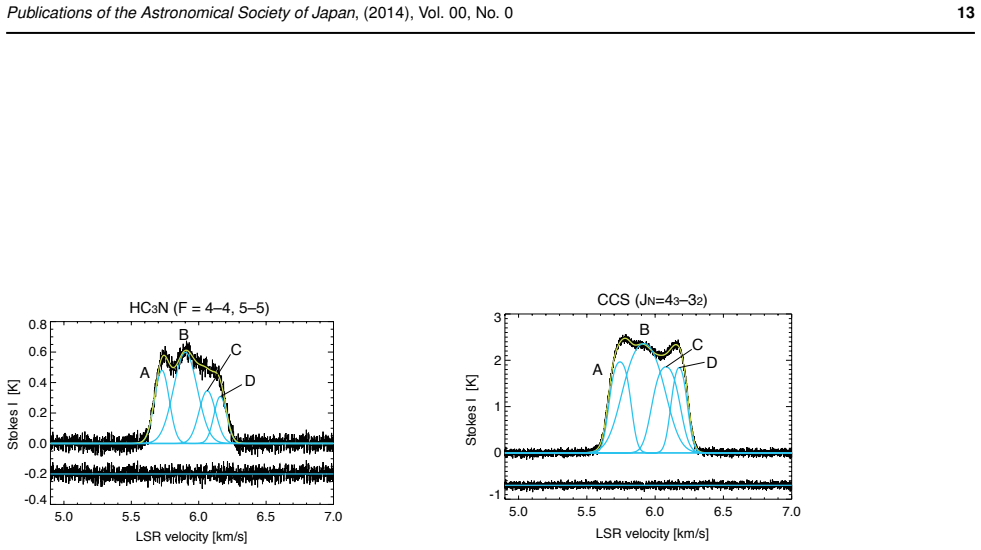
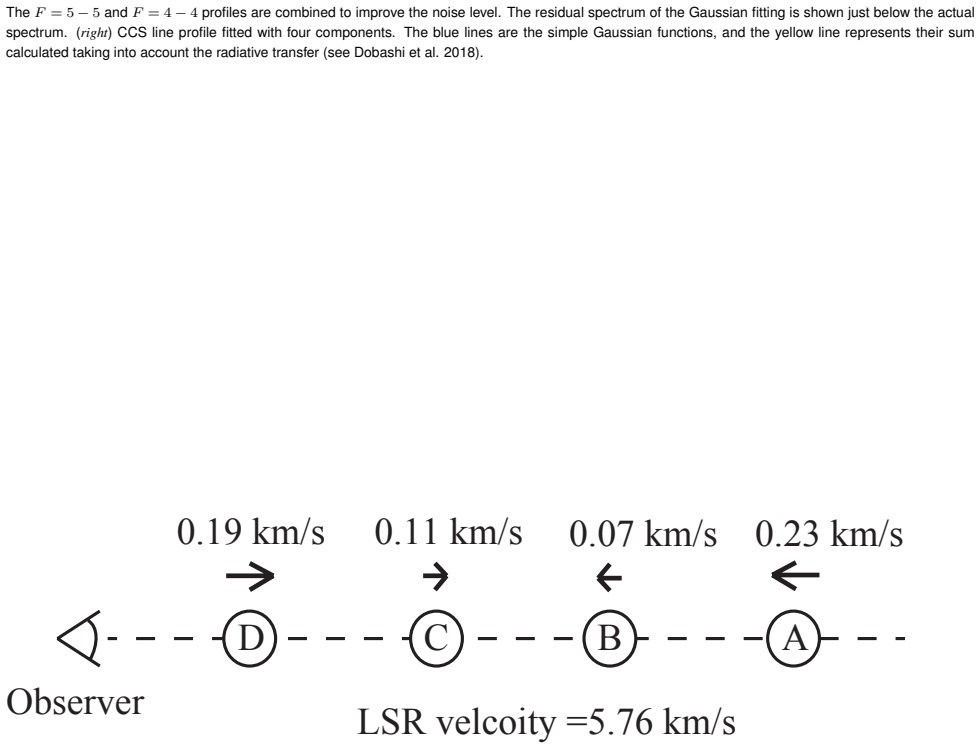
The load-bearing mechanism is the Zeeman effect in the CCS radical molecule, which has an unpaired electron and therefore a comparatively large Landé factor. A magnetic field along the line of sight splits the rotational line, generating a circular-polarization (Stokes V) spectrum proportional to the frequency derivative of the total intensity: $V\propto a_3\,dI/d\nu$. The authors derive $dI/d\nu$ from a spline fit to the Stokes I profile, fit $a_3$ to the observed Stokes V spectrum after correcting for beam squint, then convert the fitted frequency shift to $B_{\rm los}$ using the CCS Landé factor of 64 Hz per 100 µG. The paper's key simplifying assumption is that the four Gaussian velocity components A-D of the CCS line share one line-of-sight field, so their combined derivative is $V = a_3\,d(\sum_i I_i)/d\nu$. The simultaneously observed HC$_3$N line serves as a non-Zeeman control under identical calibration.
What would settle it
Observe the Stokes V spectrum of TMC-1 with enough spectral resolution to fit the Zeeman shift separately for each of the four velocity components A-D; if the fitted frequency shifts differ among components by more than the uncertainties, the single-field assumption fails and the quoted 117 µG is not a single physical field.
Extended reading notes
Core claim
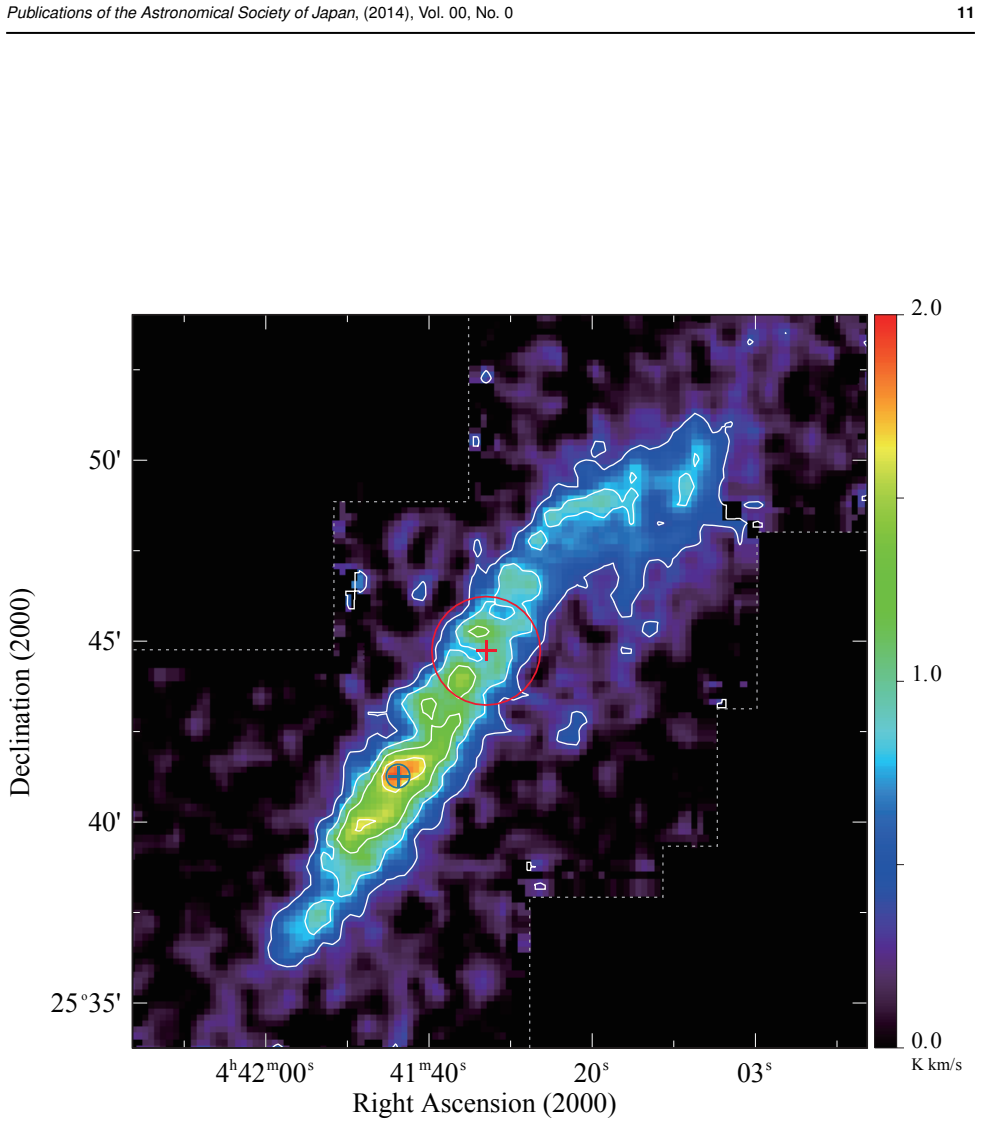
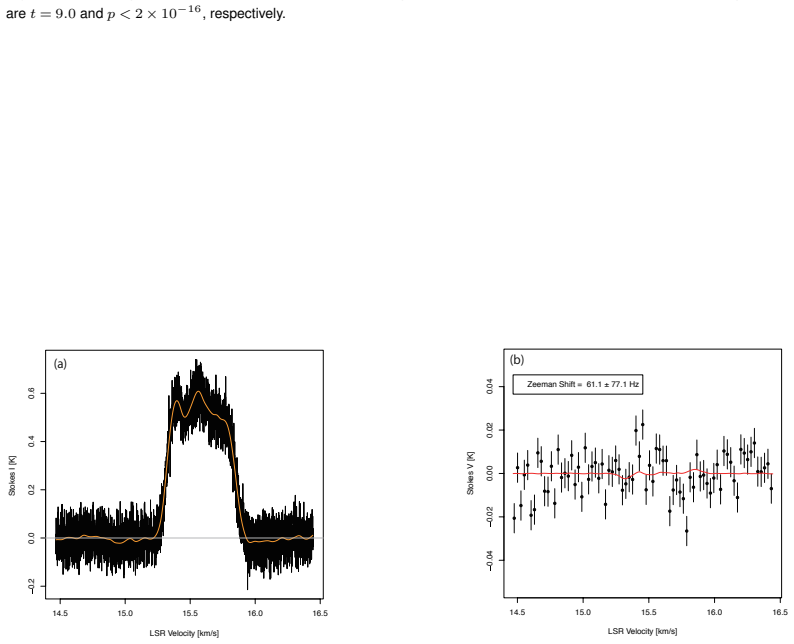
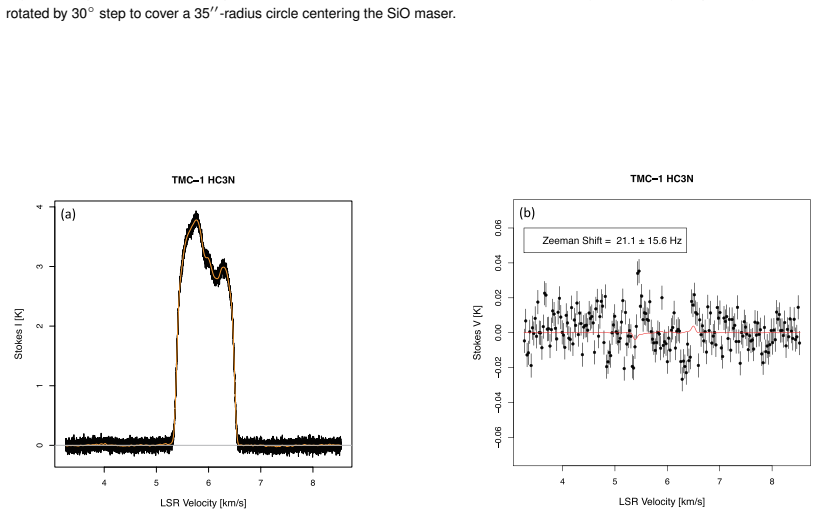
On the paper's own terms, the discovery is a clear first measurement: the Stokes V spectrum of the CCS $J_N=4_3-3_2$ line toward TMC-1 is well fitted by the model $V = a_1 + a_2 I + a_3\,dI/d\nu$ with $a_3$ corresponding to a Zeeman frequency shift of $+75.3\pm13.4$ Hz, while the simultaneously observed HC$_3$N $J=5-4$ satellite line yields an insignificant shift of $61.1\pm77.1$ Hz ($t=0.7$, $p=0.48$). Using the CCS Landé factor, the shift converts to a line-of-sight magnetic field of about $117\pm21$ µG. With an adopted inclination angle of 45$^\circ$ and a Herschel column density of $3\times10^{22}$ cm$^{-2}$, the normalized mass-to-flux ratio is $\lambda\simeq2.2$. The paper therefore concludes that TMC-1 is magnetically supercritical, and that the radiative-transfer-inferred contraction speed of about 0.6 km s$^{-1}$ is consistent with a core on the verge of protostellar formation.
Load-bearing premise
The load-bearing assumption is that the four velocity components of the CCS line all experience the same line-of-sight magnetic field, so their Zeeman signals can be added into one derivative-shaped pattern; if the components lie in different fields, the fitted 117 µG is a blend rather than a true field.
Editorial extensions
If this is right
- TMC-1's magnetic field is strong enough to affect angular momentum transport via magnetic braking, but not strong enough to stop collapse; the core is magnetically supercritical with $\lambda\simeq2.2$.
- The inferred contraction speed of about 0.6 km s$^{-1}$, roughly three times the isothermal sound speed, places TMC-1 in a dynamically infalling stage just before protostar formation.
- CCS Zeeman observations open a direct probe of magnetic fields at densities around $10^4$ cm$^{-3}$, the pre-stellar core regime where traditional Zeeman tracers (HI, OH, CN) are less effective.
- Simultaneous observation of a non-Zeeman line can serve as a calibration check for future Zeeman detections in dense cores.
Reading between the lines
- If the four velocity components A-D actually occupy regions with different magnetic field strengths, the single fitted shift of about 75 Hz is a blend rather than any one component's field; the quoted 117 µG could then be biased. Observing the Stokes V at higher spectral resolution or with a smaller beam would isolate each component.
- The same 45-GHz dual-polarization technique could be applied to a survey of pre-stellar cores to measure how often $\lambda>1$ holds, and whether supercritical cores are the typical progenitors of stars.
- Combining this line-of-sight Zeeman field with plane-of-sky fields from dust polarization would allow the 3D field geometry and inclination angle to be determined directly instead of assuming 45 degrees.
- A targeted comparison between this CCS Zeeman field and OH Zeeman fields at neighboring positions could calibrate how magnetic field strength scales with gas density inside collapsing cores.
Signed reviews
Editorial analysis
A structured set of objections, weighed in public.
Referee Report
Summary. The paper reports the first claimed clear detection of Zeeman splitting in the CCS J_N=4_3-3_2 line at 45.379 GHz toward the prestellar core TMC-1, using the Nobeyama 45-m telescope with the Z45 receiver and PolariS spectrometer. From a fit of Stokes V to V = a1 + a2 I + a3 dI/dν, the authors derive a frequency shift of +75.3 ± 13.4 Hz and a line-of-sight magnetic field strength of 117 ± 21 µG. A simultaneous observation of the non-Zeeman HC3N satellite line yields 61.1 ± 77.1 Hz, which they interpret as a non-detection supporting the CCS result. Combining the measured B_los with a Herschel column density of 3×10^22 cm^-2, they obtain a normalized mass-to-flux ratio λ≈2.2 and conclude that TMC-1 is magnetically supercritical. The paper also uses a four-component decomposition of the CCS line and prior radiative transfer models to argue that the core is undergoing global infall at ~0.6 km/s.
Significance. If confirmed, this would be the first clear detection of CCS Zeeman splitting toward a prestellar core, providing a direct measurement of the magnetic field in a dense, star-forming core at n~10^4 cm^-3. Such a measurement is important for testing theories of magnetically regulated core collapse and for calibrating indirect field estimates. The paper benefits from using an independent laboratory Landé factor, a newly developed receiver, and simultaneous observation of a non-Zeeman control line. However, the central claim rests on a calibration-control argument whose statistical power is currently weak, and on a beam-squint correction that may not account for the multi-component structure of the CCS line. The significance of the result is high if the systematic issues can be resolved, but the present evidence is not yet conclusive.
major comments (4)
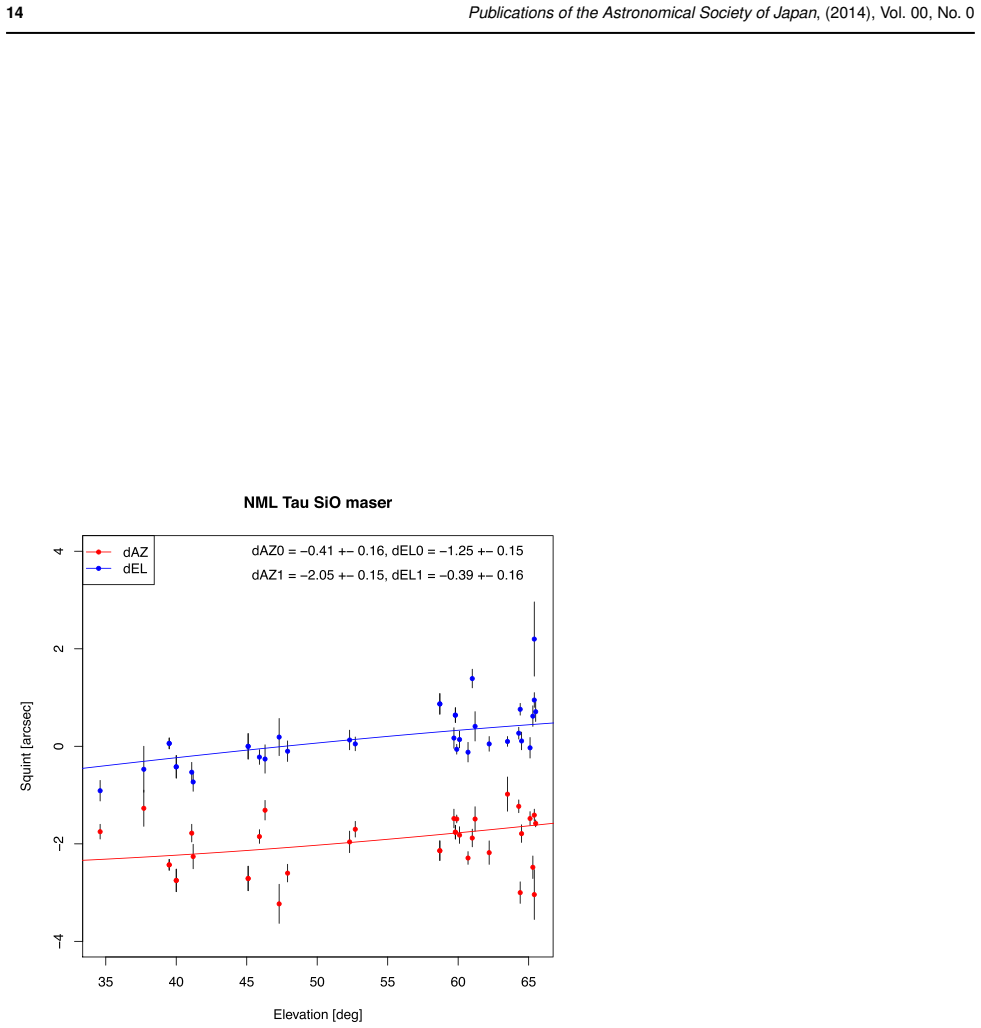
- [Section 3 and Appendix 4] The beam-squint correction uses a single mean velocity gradient for the CCS line, but the CCS profile consists of four velocity components (A–D) with different centroid velocities, optical depths, and velocity dispersions (Appendix 5, Table 2). If these components have different velocity gradients across the 40′′ beam, the residual after applying one mean correction produces a Stokes V pattern proportional to dI/dν for each component, which is exactly the Zeeman signature fitted by Eq. (1). The HC3N satellite control (F=4–4) is a single component and cannot test this multi-component differential beam-squint effect. The paper itself warns in Appendix 6 that for blended multi-component lines, such effects 'were likely to generate artificial patterns in the derived Stokes V profiles.' The authors should quantify the residual beam-squint Stokes V using component-resolved velocity gradients from their OTF maps, or otherwise show that differential beam squint among A–D is negligible compared to 75 Hz.
- [Section 3, Eq. (2)] The model V = a3 dI/dν assumes that all four CCS velocity components share the same line-of-sight magnetic field strength. Since the four components are treated as spatially distinct along the line of sight (Appendix 5), there is no physical justification for a single B_los. If the components have different B_los values, the fitted a3 is a composite and the quoted 117 ± 21 µG could be biased, as is the resulting λ≈2.2 in Section 4. The authors should either fit component-specific frequency shifts and report the scatter, or provide an independent argument for a common field strength.
- [Section 3, HC3N control] The HC3N satellite line yields a frequency shift of 61.1 ± 77.1 Hz with t=0.7, meaning the 1σ uncertainty is as large as the CCS shift itself (75.3 Hz). This non-detection therefore provides only a weak upper limit on calibration systematics and cannot independently certify the CCS detection at the claimed confidence. The abstract's statement that 'our detection of the CCS Zeeman splitting is robust' is not supported by the HC3N control alone. The paper should report the calibration uncertainty floor implied by the control (including the HC5N observation mentioned in Section 3) and show that it is small compared to the CCS shift.
- [Section 2.1 and Appendices 1–4] The key calibration steps—SBC bandpass calibration, XY phase and delay calibration, D-term correction, and the elevation-dependent beam-squint model—are summarized, but full details are deferred to a forthcoming paper. Given the small measured frequency shift (75 Hz at 45 GHz, i.e., Δν/ν ~ 1.7×10^-9), a reader cannot assess the systematic error budget without those details. The authors should include the calibration verification (for example, the Crab nebula Stokes V null test, maser Zeeman tests, and beam-squint stability) in the present paper or make the companion paper available at the time of submission.
minor comments (5)
- [Section 3 vs. Section 5] The numbers in the summary are inconsistent with the main text: Section 3 reports a shift of 75.3 ± 13.4 Hz and B_los = 117 ± 21 µG, while Section 5 reports 74.7 ± 13.0 Hz and 110 ± 21 µG. Please unify these values.
- [Appendix 6] The final sentence of Appendix 6 states that for measurements toward other positions, the multi-component beam-squint effect 'was likely to generate artificial patterns.' Since the observed CCS line at the target position also contains four components, the paper should state explicitly whether this concern applies to the present CCS data, and if not, why.
- [Typos and phrasing] There are several typographical errors: 'perfomed' in Section 5 item 2, 'velcoity' in Figure 5, 'Boltzman' in Appendix 2, and 'Yamatomo' in the references. These should be corrected.
- [Figure 3 caption] The caption of Figure 3 says the rest frequency of the HC3N F=5–4 line was adopted to measure the line-of-sight velocity, but the fitted component is F=4–4. Please clarify which rest frequency was used for the velocity scale.
- [Section 4] The normalized mass-to-flux ratio λ≈2.2 is presented without uncertainty, even though it depends on the adopted column density and inclination angle. A brief propagation of the statistical and systematic uncertainties would help assess the claimed supercriticality.
Circularity Check
No significant circularity: the Zeeman B_los is derived from an independent Landé factor and measured frequency shift, with external controls.
full rationale
The central result, Blos = 117 ± 21 µG, is obtained from a fitted Zeeman frequency shift a3 = +75.3 ± 13.4 Hz in the model V = a1 + a2 I + a3 dI/dν (Eq. 1), converted via the laboratory Landé factor of CCS (64 Hz / 100 µG) from Shinnaga & Yamamoto 2000. This conversion is an independent physical constant, not an input fitted to the TMC-1 data. The Stokes V detection is anchored to a simultaneous non-Zeeman HC3N control with a null result (61.1 ± 77.1 Hz, t = 0.7), plus an independent maser Zeeman check, and the beam-squint correction is based on measured squint and velocity gradients rather than on the target Stokes V. The mass-to-flux ratio λ ≈ 2.2 uses the Herschel column density (Malinen et al. 2012) and the Zeeman B_los; no fitted parameter is relabeled as a prediction. Self-citations to instrument papers (Nakamura et al. 2015; Mizuno et al. 2014) and to prior radiative-transfer work (Dobashi et al. 2018) are descriptive or contextual; the central detection does not reduce to any self-cited uniqueness theorem or ansatz. The explicit four-component common-B_los assumption (Eq. 2) and the multi-component beam-squint possibility noted in Appendices 4 and 6 are genuine systematic uncertainties, but they are not cases where a prediction is equivalent to an input by construction, so they do not constitute circularity.
Assumptions & free parameters
free parameters (2)
- Inclination angle θ =
45°
- Density scaling exponent =
0.5
assumptions (5)
- domain assumption The CCS J_N=4_3-3_2 line has a Landé factor of 64 Hz per 100 µG (Shinnaga & Yamamoto 2000).
- domain assumption The HC3N J=5-4 satellite hyperfine component (F=4-4) is a non-Zeeman line and is optically thin.
- ad hoc to paper All four CCS velocity components share the same line-of-sight magnetic field strength.
- domain assumption The beam squint is accurately described by the empirical model in Eqs. A5-A6 with the fitted coefficients.
- domain assumption The spatial configuration of the four components (A,B,C,D from back to front) inferred by Dobashi et al. (2018) is correct.
Cite this review
Pith. "Pith review of First clear detection of the CCS Zeeman splitting toward the pre-stellar core, Taurus Molecular Cloud-1." pith.science (2026). https://pith.science/paper/KT4AI6X3
@misc{pith2026190807708,
  author       = {Pith},
  title        = {Pith review of: First clear detection of the CCS Zeeman splitting toward the pre-stellar core, Taurus Molecular Cloud-1},
  year         = {2026},
  howpublished = {\url{https://pith.science/paper/KT4AI6X3}},
  note         = {Machine review of arXiv:1908.07708}
}
abstract
We report a first clear detection of the Zeeman splitting of a CCS emission line at 45 GHz toward a nearby prestellar dense filament, Taurus Molecular Cloud-1. We observed HC$_3$N non-Zeeman line simultaneously as the CCS line, and did not detect any significant splitting of HC$_3$N line. Thus, we conclude that our detection of the CCS Zeeman splitting is robust. The derived \textcolor{black}{line-of-sight} magnetic field strength is about 117 $\pm$ 21 $\mu$G, which corresponds to the normalized mass-to-magnetic flux ratio of 2.2 if we adopt the inclination angle of 45$^\circ$. Thus, we conclude that the TMC-1 filament is magnetically supercritical. Recent radiative transfer calculations of CCS and HC$_3$N lines along the line of sight suggest that the filament is collapsing with a speed of $\sim$ 0.6 km s$^{-1}$, which is comparable to three times the isothermal sound speed. This infall velocity appears to be consistent with the evolution of a gravitationally-infalling core.
Figures
Figures from the paper (5 more)
Reference graph
Works this paper leans on
-
[1]
\@bibitem \@bib@author\@prev@author \@set@biblabel \@lbibitem[#1] \@bib@parse#1()\@nil \@set@biblabel \@bib@parse#1(#2)#3\@nil \@bib@author #1 @edef\@bib@year @space#2 \@empty \@set@biblabel#1 \@bib@author\@empty \@latex@warning Author name should be given for reference entry ``#1'' \@bib@year\@empty \@latex@warning Publication year should be given for re...
2018
-
[2]
Aumont, J., Conversi, L., Thum, C., et al.\ 2010, A&A, 514, A70
work page 2010
-
[3]
Benson, P. J. & Myers, P. C. 1989, ApJS, 71, 89
work page 1989
- [4]
-
[5]
Cartwright, J. K., Pearson, T. J., Readhead, A. C. S., et al.\ 2005, ApJ, 623, 11
work page 2005
-
[6]
Chapman, N. L., Goldsmith, P. F., Pineda, J. L. et al. 2011, ApJ, 741, 21
work page 2011
-
[7]
Crutcher, R. M. 2012, ARAA, 50, 29
work page 2012
-
[8]
M., Troland, T., H., & Goodman, A
Crutcher, R. M., Troland, T., H., & Goodman, A. A., 1993, ApJ, 407, 175
work page 1993
Show all 47 references
-
[9]
et al., 2018, ApJ, 864, 82
Dobashi, K., Shimoikura, T., Nakamura, F. et al., 2018, ApJ, 864, 82
2018
-
[10]
et al., 2019, ApJ, 879, 88
Dobashi, K., Shimoikura, T., Ochiai, T., F. et al., 2019, ApJ, 879, 88
2019
-
[11]
Feh\'er, O., L. V. T\'oth, L. V., Ward-Thompson, D., et al. 2016, A&A, 590, A75
2016
-
[12]
& Guesten, R
Fiebig, D. & Guesten, R. 1989, A&A, 214, 333
1989
-
[13]
2001, PASP, 113, 1247
Heiles, C., Perillat, P., Nolan, M., et al. 2001, PASP, 113, 1247
2001
-
[14]
Kamazaki, T., et al., 2012, , 64, 29
2012
-
[15]
Lafferty, W. J. & Lovas, F. J., 1978, JPCRD, 7, L441
1978
-
[16]
1969, MNRAS, 145, 271
Larson, R. 1969, MNRAS, 145, 271
1969
-
[17]
M., Langer, W
Levin, S. M., Langer, W. D., Velusamy, T., et al. 2001, ApJ, 555, 850
2001
-
[18]
K., et al
Li, H.-B., Goodman, A., Sridharan, T. K., et al. 2014, Protostars and Planets VI, Henrik Beuther, Ralf S. Klessen, Cornelis P. Dullemond, and Thomas Henning (eds.), University of Arizona Press, Tucson, p. 101
2014
-
[19]
2004, , 609, L83
Li, Z.-Y., & Nakamura, F. 2004, , 609, L83
2004
-
[20]
Li, Z.-Y., Banerjee, R., Pudritz, R. E. et al. 2014, Protostars and Planets VI, Henrik Beuther, Ralf S. Klessen, Cornelis P. Dullemond, and Thomas Henning (eds.), University of Arizona Press, Tucson, p.173
2014
-
[21]
G., 2012, A&A, 544, A50
Malinen, J., Juvela, M., Rawlings, M. G., 2012, A&A, 544, A50
2012
-
[22]
A., Henning, Th
Marka, C., Schreyer, K., Launhardt, R., Semenov, D. A., Henning, Th. 2012, , 537, 4
2012
-
[23]
2014, JAI, 3, 1450010
Mizuno, I., Kameno, S., Kano, A. 2014, JAI, 3, 1450010
2014
-
[24]
P.\ 2012, , 144, 189
Momjian, E., & Sarma, A. P.\ 2012, , 144, 189
2012
-
[25]
& Tassis, K
Mouschovias, T. & Tassis, K. 2009, MNRAS, 400, 15
2009
-
[26]
& Nakamura, T
Nakano, T. & Nakamura, T. 1978, PASJ, 30, 681
1978
-
[27]
1998, ApJL, 507, L165
Nakamura, F. 1998, ApJL, 507, L165
1998
-
[28]
Nakamura, F. & Li. Z.-Y., 2008, ApJ, 687, 354
2008
-
[29]
Nakamura, F., Sugitani, K., Tanaka, T., et al., 2014, ApJ, 791, L23
2014
-
[30]
Nakamura, F., Ogawa, H., Yonekura, Y. et al. 2015, PASJ, 67, 117
2015
-
[31]
Nakatake, A., Kameno, S., & Takeda, K.\ 2010, PASJ, 62, 1361
2010
-
[32]
H., Brunt, C
Narayanan, G., Heyer, M. H., Brunt, C. et all, 2008, ApJ, 177, 341
2008
-
[33]
1999, PASJ, 51, 637
Ogino, S., Tomisaka, K., & Nakamura, F.. 1999, PASJ, 51, 637
1999
-
[34]
P., & Momjian, E
Sarma, A. P., & Momjian, E. 2011, ApJ, 730, L5
2011
-
[35]
2018, , 885, 45
Shimoikura, T., Dobashi, K., Nakamura, F., Matsumoto, T., Hirota, T. 2018, , 885, 45
2018
-
[36]
2019, , in press (arXiv:1809.09855)
Shimoikura, T., Dobashi, K., Nakamura, F., Shimajiri, Y., Sugitani, K. 2019, , in press (arXiv:1809.09855)
2019 arXiv
-
[37]
Shinnaga, H., & Yamatomo, S., 2000, ApJ, 544, 330
2000
-
[38]
1999, in Star Formation 1999, ed
Shinnaga, H., Tsuboi, M., Kasuga, T. 1999, in Star Formation 1999, ed. T. Nakamoto, Nobeyama Radio Observatory, p.175
1999
-
[39]
H., Adams, F
Shu, F. H., Adams, F. C., & Lizano, S. 1987, ARAA, 25, 23
1987
-
[40]
1992, ApJ, 392, 551
Suzuki, H., Yamatomo, S., Ohishi, M., et al. 1992, ApJ, 392, 551
1992
-
[41]
2018, , 866, 32
Taniguchi, K., et al. 2018, , 866, 32
2018
-
[42]
M., Loinard, L., Mioduszewski, A
Torres, R. M., Loinard, L., Mioduszewski, A. J., Rodr\' iguez, L. F., 2007, , 671, 1813
2007
-
[43]
H., & Crutcher, R
Troland, T. H., & Crutcher, R. M. 2008, ApJ, 680, 457
2008
-
[44]
E., & Heiles, C., 2006, , 162, 388
Turner, B. E., & Heiles, C., 2006, , 162, 388
2006
-
[45]
2012, PASJ, 64, 118
Yamaki, H., Kameno, S., Beppu, H., et al. 2012, PASJ, 64, 118
2012
-
[46]
1990, , 361, 318
Yamamoto, S., et al. 1990, , 361, 318
1990
-
[47]
2016, , 460, 2050
Zhao, B., et al. 2016, , 460, 2050
2016
Reviewed August 14, 2026 · model on record in the stance chip above.
Discussion (0). Continue with ORCID to comment.