REVIEW 2 major objections 4 minor 2 cited by
Quantifying the impact of variable BLR diffuse continuum contributions on measured continuum inter-band delays
T0 review · 2 major / 4 minor · reviewed 2026-08-14 · deepseek-v4-flash
Pith's one-line read Models that reproduce NGC 5548's strong UV lines also produce a diffuse continuum reaching about 40 percent of the light in some continuum bands, contaminating measured inter-band delays with a several-day, wavelength-dependent signature.
desk verdict BLR diffuse continuum contamination of inter-band delays is real and quantitatively modeled; the correction recipe assumes a lag-less disk, which fails for the source it targets. read the letter →
The pith
A machine-rendered reading of the paper's core claim, the machinery that carries it, and where it could break.
The reading
What carries the argument
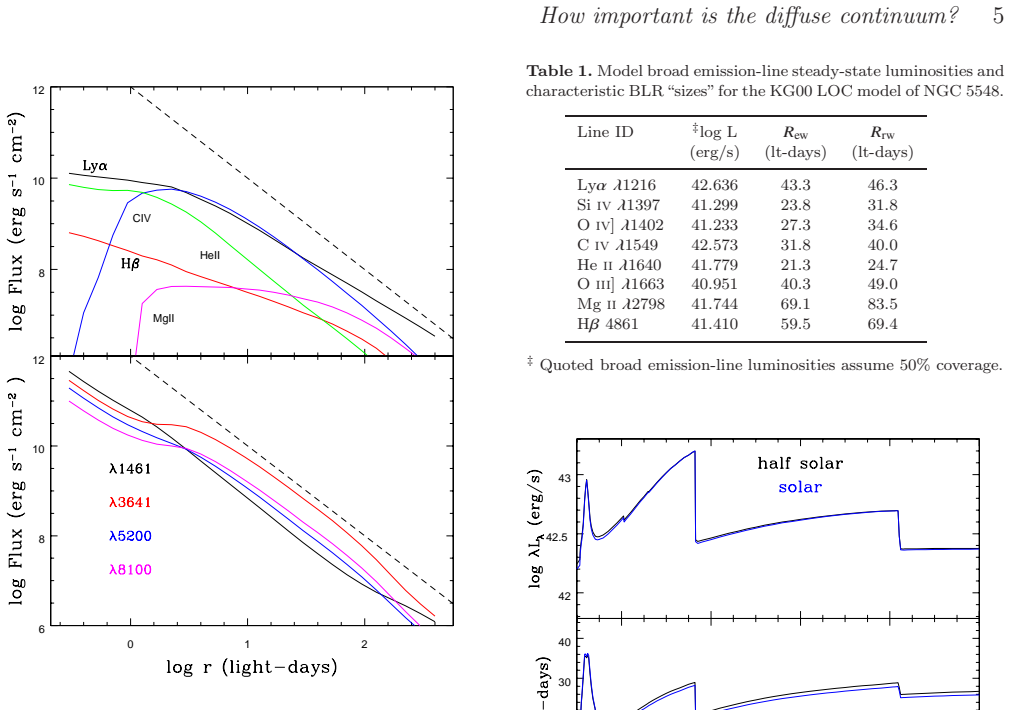
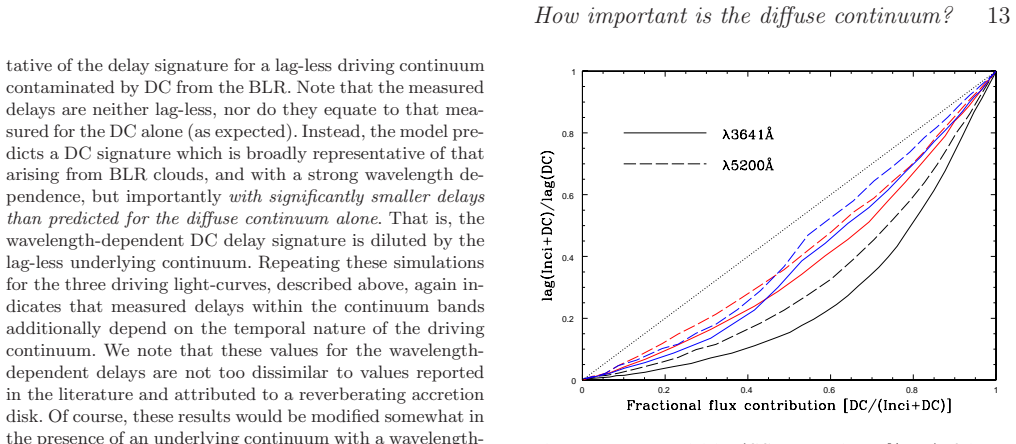
The central machinery is a locally optimally emitting cloud (LOC) model: a spherical ensemble of photoionized clouds spanning a range of hydrogen densities and column densities, whose summed emission is forced to match the observed Lyα and C IV strengths and lags in NGC 5548. Within this model, the diffuse-continuum bands have radial surface emissivity distributions $F(r)$ approximately proportional to $r^{-2}$, i.e. a responsivity $\eta(r)\approx1$, which makes their response to driving continuum variations simple and relatively insensitive to BLR geometry. The second load-bearing element is the dilution formula, Equation 3, $\tau_\lambda\approx\tau_\lambda^{\rm DC}(1-A)x/(1-Ax)$, which connects the measured delay in a band to the diffuse-continuum fraction $x$ and to $A$, a constant encoding how the cross-correlation centroid responds to a mixture of lag-less disk light and delayed diffuse-continuum light.
What would settle it
Compute the diffuse-continuum fraction $x$ in each continuum band from a high signal-to-noise spectrum of an AGN with a measured inter-band delay spectrum. Equation 3 predicts the delay should approach zero as $x\to0$ and follow $(1-A)x/(1-Ax)$ at intermediate $x$; observing multi-day, wavelength-dependent lags in the lowest-$x$ bands, or a delay-versus-$x$ curve that cannot be fitted with a single $A$, would falsify the lag-less disk assumption and demonstrate that the disk itself contributes wavelength-dependent delays.
Extended reading notes
Core claim
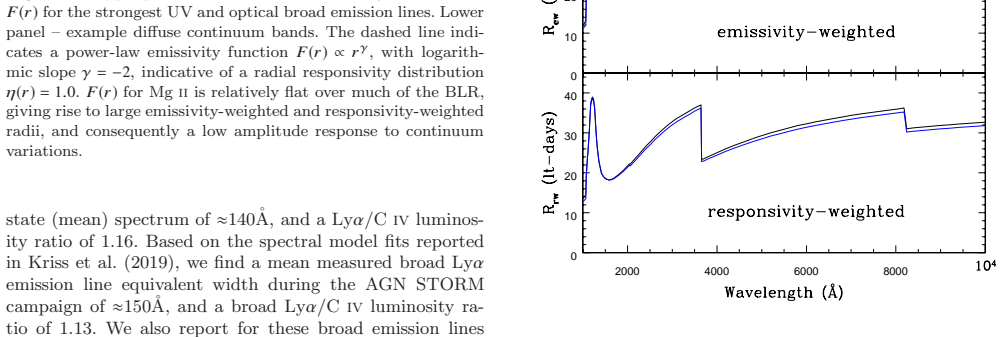
Using a spherical ensemble of photoionized clouds that reproduces the observed Lyα and C IV luminosities and time delays in NGC 5548, the paper shows that the same gas emits a diffuse continuum made of free-bound, free-free, and scattered light. In the steady-state model, the diffuse continuum reaches roughly 60 percent of the incident continuum at the Balmer jump (about 40 percent of total light), with emissivity-weighted radii of about 20 to 40 light-days across 1000 to 10000 Å. Driven by the 2014 monitoring light curve, the diffuse-continuum-only cross-correlation delays average about $6.5 \pm 1.7$ days over that range, with a strong wavelength dependence and abrupt changes at the Balmer and Paschen jumps. When a scaled, lag-less version of the 1157 Å driver is added to represent the underlying disk, the measured delay is a nonlinear function of the diffuse-continuum fraction $x$, approximately $\tau_\lambda \approx \tau_\lambda^{\rm DC}(1-A)x/(1-Ax)$ with $A\approx0.65$ to $0.76$ for the 2014 campaign. The paper provides a recipe for scaling these predictions to other AGN luminosities and for correcting observed delay spectra.
Load-bearing premise
The correction recipe assumes the underlying accretion-disk continuum in each longer-wavelength band is a scaled, lag-less replica of the 1157 Å driver; if the disk itself has wavelength-dependent delays of several days, comparable to the diffuse-continuum delays, the measured lags cannot be separated using Equation 3.
Editorial extensions
If this is right
- Uncorrected inter-band delays fitted with $\tau(\lambda)\propto\lambda^{4/3}$ will overestimate disk sizes and mass accretion rates, because each measured delay is a mixture of disk response and BLR diffuse-continuum response.
- The enhanced delays observed around the Balmer continuum can be reproduced by BLR diffuse continuum without requiring an anomalous disk temperature profile.
- Corrections that linearly scale measured lags by the diffuse-continuum fraction will overestimate the contamination for large $x$; Equation 3 with a fitted $A$ is needed.
- The Hβ lag is a poor proxy for the Balmer-continuum delay: the diffuse continuum responds from radii about a factor of two smaller, so its lag and variability amplitude differ from Hβ.
- The contamination, and hence the required correction, depends on the amplitude and characteristic timescale of the driving continuum, so campaign-specific light-curve properties enter the delay calibration.
Reading between the lines
- If the 1157 Å reference band itself contains diffuse continuum, all measured delays are relative to a contaminated zero point; switching the driver to a band closer to the ionizing continuum or to a high-ionization line should reveal a uniform shift in the recovered delay spectrum.
- Because the diffuse-continuum surface emissivity is nearly $r^{-2}$, its transfer function is a smoothed, almost linear mirror of the driver; lag spectra could be fit with a two-component model, a compact disk response plus an $r^{-2}$ BLR response, to estimate both the disk temperature profile and the BLR radius from the same data.
- Since AGN are bluer when brighter, the diffuse-continuum fraction $x$ changes with continuum state; Equation 3 then predicts that measured lags in a given band should vary as the source brightens, a testable prediction with simultaneous spectral and lag monitoring.
- Sources with stronger emission lines relative to the underlying continuum should show systematically larger diffuse-continuum fractions; the Lyα equivalent width could serve as a cheap predictor of the expected contamination level.
Signed reviews
Editorial analysis
A structured set of objections, weighed in public.
Referee Report
Summary. The paper uses Cloudy v17.00 photoionization models in a LOC framework to compute the broad-line-region diffuse continuum (DC) flux and delay spectra for NGC 5548, spanning 1000–10000 Å. The model is calibrated by matching the observed Lyα and C IV equivalent widths and line ratios, and the predicted line lags are compared against the 1989 IUE, 1993 HST, and 2014 AGN STORM campaigns. The authors find that models matching the strong UV lines also produce a significant DC component, reaching roughly 40% of the total light near the Balmer jump, and that this component contributes wavelength-dependent delays of order a few days to the measured continuum inter-band delays. They explore how the DC luminosity and delays depend on gas density, column density, driving-continuum amplitude, and variability timescale, and they provide a recipe (Eq. 3) for estimating and correcting the DC contribution in disk reverberation mapping experiments.
Significance. If the central result holds, the paper establishes that BLR diffuse continuum emission is a non-negligible contaminant in UV-optical disk reverberation mapping, potentially biasing measured disk sizes and time lags. The strengths of the paper are its use of a public, well-documented photoionization code; the explicit calibration against observed line strengths and line lags from three campaigns (Table 2); and the falsifiable, quantitative predictions for the wavelength dependence of DC delays and flux fractions. The finding that the DC delay spectrum is much shorter than the Hβ lag, and that Hβ is a poor proxy for Balmer-continuum delays, is a useful and nontrivial result. The paper also makes a clear case that the DC contribution can partly explain the 'bluer-when-brighter' behavior. However, the quantitative correction recipe and the reported diluted-delay amplitudes depend on an assumption about the underlying disk lags that is not satisfied for the target source, as detailed in the major comments.
major comments (2)
- [§2.5, Fig. 10, Eq. (3)] The quantitative analysis that produces the diluted delays and the correction recipe assumes the underlying disk continuum in each band is a scaled, lag-less replica of the λ1157 Å driver ('we here assume to be lag-less with respect to the driver'). This assumption is not satisfied for NGC 5548, the source to which the model is applied: observed UV-optical inter-band lags relative to a UV reference are of order 1–3 days, while the diluted DC delays in Fig. 10 are ~0.5–3 days (and the undiluted DC delays in Fig. 6 are ~2–10 days). With two comparable delay scales, the CCF centroid of the summed light is a nonlinear mixture of the disk lag spectrum and the BLR DC lag spectrum, so Eq. (3), which interpolates between τ=0 and τ=τ_DC at fixed DC fraction, cannot by construction recover either the DC fraction or the clean disk lag. Section 3.3 limits the recipe to cases where disk lags are 'much shorter' than the DC delays, which excludes the NGC 5548 case for which the numbers are computed. The quantitative contamination amplitudes in Fig. 10 and the proposed correction are therefore not uniquely determined from this model. I recommend the authors either forward-model a wavelength-dependent disk lag spectrum and recompute the dilution, or explicitly reframe the recipe and the quoted amplitudes as upper limits applicable only when the disk lag spectrum is known to be sub-dominant.
- [§2.4.2, footnote 6, and §2.7] The driving continuum proxy is the λ1157 Å band, and the paper acknowledges in a footnote that the UV-optical continuum may be a poor proxy for the driving EUV continuum during the anomalous 2014 state. Because all predicted delays in Figs. 6, 10, and 11 are correlations with this proxy, a mismatch between the proxy and the true ionizing continuum would shift the DC delay spectra and also change the fractional DC contributions used in the dilution simulations. The paper's sensitivity analysis in §2.7.1 scales the amplitude of the driver, but the full simulations in §2.4–2.6 are not rerun with the EUV-scaled driver, so the impact on the reported delay spectra and on Eq. (3) is not quantified. Please provide a quantitative sensitivity test (e.g., rerun the dilution simulations with the α=1.5 driver and report the resulting changes in Figs. 10 and 11) or state a conservative uncertainty on the absolute delays due to the driver-proxy ambiguity.
minor comments (4)
- [§2.4.1, Fig. 5] The text says the extended light curve includes a significant continuum event 'starting ≈200 days prior to the start of the HST campaign,' while the lower-panel caption of Fig. 5 says the event is '≈140 days prior.' Please reconcile the numbers.
- [Table 2] The observed line lags are quoted without uncertainties, which makes it difficult to judge the quality of the model match. Adding the published measurement uncertainties (e.g., from De Rosa et al. 2015 and Pei et al. 2017) would strengthen the calibration claim.
- [§2.2] There is a typo in 'NGGC 5548' (extra G). Also, the abundance description '0.5× solar metallicity, except solar values in C/H and N/H' would benefit from a brief reminder that this is the same abundance set as KG00, to avoid forcing the reader to look up the reference.
- [§3.2] The discussion of open vs. closed geometries and the missing Lyman continuum is interesting but is not directly connected to the quantitative results in §2.5–2.6; consider condensing it or adding a sentence that states its implications for the DC delay predictions.
Circularity Check
No significant circularity: DC delays are forward-model outputs from a Cloudy LOC model calibrated to observed line strengths, not to the measured inter-band continuum delays being predicted.
full rationale
The central derivation is a forward photoionization calculation. The paper adopts the KG00/KG01 LOC BLR model, but this is not the result being predicted: the model is anchored to independent measured line luminosities and lags (Table 2 vs. De Rosa et al. 2015 and Pei et al. 2017), and the DC flux/delay spectra are then computed with Cloudy using the same gas distribution. The claim that DC is a significant contaminant is therefore not equivalent to any fitted input; the model could have failed to reproduce the observed Ly-alpha/C IV strengths or the line lags. The dilution calculation in Sec. 2.5 ('a scaled (in flux) version of the driver, which we here assume to be lag-less') is a stated modeling assumption, not a hidden redefinition of the measured delay. Sec. 3.3 explicitly limits the correction recipe to cases where disk lags are 'much shorter' than BLR DC delays, and the Sec. 2.4.2 footnote concedes that the UV-optical continuum may be a poor proxy for the EUV driver during the anomalous 2014 state. These are honest limitations on identifiability, not circular reductions: the predicted DC delays in Fig. 6 and the mixed delays in Fig. 10 are outputs of convolving the driver with the model transfer function, not inputs. Equation 3 is an empirical fit to those simulations, and the suggested use is to fit x and A to data, i.e., a standard inverse/recipe step, not a 'prediction' of the measured delay from the same delay. No step in the paper defines the predicted quantity in terms of itself, and no load-bearing result is justified solely by an author self-citation.
Assumptions & free parameters
free parameters (8)
- BLR inner radius =
1 light day
- BLR outer radius =
140 light days
- Covering fraction power-law index c =
-1.2
- Cloud hydrogen column density log NH =
23 cm^-2
- Hydrogen density range log nH =
8-12 cm^-3
- Metallicity =
0.5 solar, solar C/H and N/H
- Driving continuum amplitude scaling exponent alpha =
1.5 and 2.0
- Recipe constant A in Equation 3 =
0.763 (3641 A), 0.6485 (5200 A) for AGN STORM
assumptions (5)
- domain assumption Cloudy v17.00 photoionization calculations with large H and He atoms correctly predict line and continuum emission from BLR clouds.
- domain assumption The BLR can be represented as a spherical distribution of constant-density, constant-column clouds illuminated by a central point source, with the KG00 LOC weighting.
- domain assumption The lambda-1157-Angstrom continuum light curve is a suitable proxy for the driving EUV ionising continuum.
- ad hoc to paper In the dilution simulations, the underlying continuum in each band is a scaled, lag-less version of the lambda-1157-Angstrom driver.
- domain assumption The radial responsivity of DC bands is approximately 1, giving F(r) proportional to r^-2, so response is linear in driving flux.
Cite this review
Pith. "Pith review of Quantifying the impact of variable BLR diffuse continuum contributions on measured continuum inter-band delays." pith.science (2026). https://pith.science/paper/VWGPU6JE
@misc{pith2026190807757,
  author       = {Pith},
  title        = {Pith review of: Quantifying the impact of variable BLR diffuse continuum contributions on measured continuum inter-band delays},
  year         = {2026},
  howpublished = {\url{https://pith.science/paper/VWGPU6JE}},
  note         = {Machine review of arXiv:1908.07757}
}
read the original abstract
We investigate the contribution of reprocessed continuum emission (1000A - 10,000A) originating in broad line region (BLR) gas, the diffuse continuum (DC), to the wavelength-dependent continuum delays measured in AGN disk reverberation mapping experiments. Assuming a spherical BLR geometry, we adopt a Local Optimally-emitting Cloud (LOC) model for the BLR that approximately reproduces the broad emission-line strengths of the strongest UV lines (Ly-alpha and C IV) in NGC 5548. Within this LOC framework, we explore how assumptions about the gas hydrogen density and column density distributions influence flux and delay spectra of the DC. We find that: (i) models which match well measured emission line luminosities and time delays also produce a significant DC component, (ii) increased nH and/or NH, particularly at smaller BLR radii, result in larger DC luminosities and reduced DC delays, (iii) in a given continuum band the relative importance of the DC component to the measured inter-band delays is proportional (though not 1:1) to its fractional contribution to the total light in that band, (iv) the measured DC delays and DC variability amplitude depends also on the variability amplitude and characteristic variability timescale of the driving continuum, (v) the DC radial surface emissivity distributions F(r) approximate power-laws in radius with indices close to -2 (approximately 1:1 response to variations in the driving continuum flux), thus their physics is relatively simple and less sensitive to the unknown geometry and uncertainties in radiative transfer. Finally, we provide a simple recipe for estimating the DC contribution in disk reverberation mapping experiments.
Figures

Figures from the paper (11 more)




Forward citations
Cited by 2 Pith papers
-
Physically motivated AGN emissivity profiles and their effects on quasar microlensing signatures. 1. Multi-epoch accretion disc size inference
Interpreting composite disc-plus-BLR emission as a single compact disc systematically overestimates microlensing half-light radii, with the bias set mainly by the BLR flux fraction and the compact-disc emissivity shape.
-
Continuum optical-UV and X-ray variability of AGN: current results and future challenges
A comprehensive review of AGN continuum variability from optical/UV to X-rays, with no new data.
Reference graph
Works this paper leans on
-
[1]
Arav, N., Chamberlain, C., Kriss, G.A., Kaastra, G.A., Cappi, M., et al.\ 2015, A&A 577, 37
2015
-
[2]
Baldwin, J., Ferland, G., Korista, K., & Verner, D.\ 1995, \ 445, L119
work page 1995
-
[3]
Baskin, A., Laor, A., & Stern, J.\ 2014, \ 438, 604
work page 2014
-
[4]
Baskin, A., Laor, A.\ 2018, \ 474, 1970
work page 2018
-
[5]
Bentz, M. C., Horne, K.D., Barth, A. J., et al.\ 2010, \ 720, 46
work page 2010
-
[6]
Bottorff, M., Korista, K.T., Schlosman, I., & Blandford, R.\ 1997, \ 479, 200
work page 1997
-
[7]
Bottorff, M., Baldwin, J.A., Ferland, G.J., Ferguson, J.W., & Korista, K.T.\ 2002, \ 581, 932
work page 2002
-
[8]
Cackett, E.M., Horne, K.D., & Winkler, H.\ 2007, \ 380, 669
work page 2007
Show all 81 references
-
[9]
et al.\ 2018, \ 857, 53
Cackett, E.M., Chiang, C-Y., McHardy, I. et al.\ 2018, \ 857, 53
2018
-
[10]
Carswell, R., & Ferland, G.J.\ 1998, \ 235, 1121
1998
-
[11]
Chelouche, D., Pozo Nunez, F., & Kaspi, S.\ 2019, Nature Astronomy, 3, 251
2019
-
[12]
Chiang, J., & Murray, N.\ 1996, \ 466, 704
1996
-
[13]
Clavel, J., Reichert, G.A., Alloin, D., et al.\ 1991, \ 366, 64
1991
-
[14]
2001, \ 325, 1527
Collier, S. 2001, \ 325, 1527
2001
-
[15]
Dexter, J., & Agol, E.\ 2011, \ 727, 24
2011
-
[16]
De Rosa, G., Peterson, B.M., Ely, J., et al.\ 2015, \ 806, 128, (Paper i )
2015
-
[17]
Edelson, R., Gelbord, J.M., Horne, K.D., et al.\ 2015, \ 806, 129, (Paper ii )
2015
-
[18]
Edelson, R., Gelbord, J., Cackett, E., Connolly, S., Done, C., et al.\ 2017, \ 840, 41
2017
-
[19]
et al.\ 2019, \ 870, 123
Edelson, R., Gelbord, J., Cackett, E., Peterson, B.M., Horne, K. et al.\ 2019, \ 870, 123
2019
-
[20]
et al.\ 2016, \ 821, 56, ( Paper iii )
Fausnaugh, M.M., Denney, K.D., Barth, A.J., Bentz, M.C., Bottorff, M.C. et al.\ 2016, \ 821, 56, ( Paper iii )
2016
-
[21]
et al.\ 2017, RMxAA 53, 385
Ferland, G.J., Chatzikos, M., Guzm\'an, F., Lykins, M.L., van Hoof, P.A.M. et al.\ 2017, RMxAA 53, 385
2017
-
[22]
Fitzpatrick, E.L.\ 1999, PASP 111, 63
1999
-
[23]
Gardner, E., & Done, C.\ 2017, \ 470, 3591
2017
-
[24]
Goad, M.R., O'Brien, P.T., & Gondhalekar, P.M.\ 1993, \ 263, 149
1993
-
[25]
Goad, M.R., Korista, K.T., & Ruff, A.J.\ 2012, \ 426, 3088
2012
-
[26]
Goad, M.R., & Korista, K.T.\ 2014, \ 444, 43
2014
-
[27]
Goad, M.R., & Korista, K.T.\ 2015, \ 453, 3662
2015
-
[28]
Goad, M.R., Korista, K.T., De Rosa, G., Kriss, G.A., Edelson, R., et al.\ 2016, \ 824, 11, (Paper iv )
2016
-
[29]
Grier, C.J., Peterson, B.M., Pogge, R.W., et al.\ 2012, \ 755, 60
2012
-
[30]
et al.\ 2013, \ 764, 47
Grier, C.J., Peterson, B.M., Horne, K., Bentz, M.C., Pogge, R.W. et al.\ 2013, \ 764, 47
2013
-
[31]
et al.\ 2017, \ 849, 146
Grier, C.J., Pancoast, A., Barth, A.J., Fausnaugh, M.M., Brewer, B.J. et al.\ 2017, \ 849, 146
2017
-
[32]
Hall, P.B., Sarrouh, G.T., & Horne, K.D.\ 2018, \ 854, 93
2018
-
[33]
Horne, K.D., Welsh, W.F., & Peterson, B.M.\ 1991, \ 367, 5
1991
-
[34]
Horne, K., De Rosa, G., Peterson, B.M., Barth, A.J., Ely, J., et al.\ 2019, \ in prep., paper ix
2019
-
[35]
Kaspi, S., & Netzer, H.\ 1999, \ 524, 71
1999
-
[36]
Kaastra, J.S., Kriss, G.A., Cappi, M., Mehdipour, M., Petrucci, P.-O., et al.\ 2014, Sci 345, 64
2014
-
[37]
Kelly, B.C., Bechtold, J, & Siemiginowska, A.\ 2009, \ 698, 895
2009
-
[38]
Korista, K.T., Alloin, D., Barr, P., Clavel, J., Cohen, R.D., et al.\ 1995, \ 97, 285
1995
-
[39]
Korista, K.T., & Ferland, G.J.\ 1998, \ 495, 672
1998
-
[40]
Korista, K.T., & Goad, M.R.\ 2000, \ 536, 284 (KG00)
2000
-
[41]
Korista, K.T., & Goad, M.R.\ 2001, \ 553, 695 (KG01)
2001
-
[42]
Korista, K.T., & Goad, M.R.\ 2004, \ 606, 749
2004
-
[43]
Koshida, S., Minezaki, T., Yoshii, Y., Kobayashi, Y., Sakata, Y., et al.\ 2014, \ 788, 159
2014
-
[44]
Crenshaw, D
Kraemer, S.B. Crenshaw, D. Michael; Filippenko, Alexei V.; Peterson, Bradley M.\ 1998, \ 499, 719
1998
-
[45]
Kriss, G.A., De Rosa, G., Peterson, B.M., et al.\ 2019, \ in press, AGN STORM paper viii
2019
-
[46]
Lawther, D., Goad, M.R., Korista, K.T., Ulrich, O., & Vestergaard, M.\ 2018, \ 481, 533
2018
-
[47]
Landt, H., et al.\ 2019, \ in press
2019
-
[48]
Magdziarz, P., Blaes, O.M., Zdziarski, A.A., Johnson, W.N., and Smith, D.A.\ 1998, \ 301, 179
1998
-
[49]
Mannucci, F., Salvati, M., & Stanga, R.M.\ 1992, \ 394, 98
1992
-
[50]
Marshall, H.L., Carone, T.E., Peterson, B.M., Clavel, J., Crenshaw, D.M., et al.\ 1997, \ 479, 222
1997
-
[51]
Mathur, S., Gupta, A., Page, K., et al.\ 2017, \ 846, 55
2017
-
[52]
McHardy, I.M., Connolly, S.D., Horne, K.D., Cackett, E.M., Gelbord, J., et al.\ 2018, \ 480, 2881
2018
-
[53]
Mehdipour, M., Kaastra, J.S, Kriss, G.A., Cappi, M., Petrucci, P.-O., et al.\ 2015, A&A 575, 22
2015
-
[54]
Mehdipour, M., Kaastra, J.S, Kriss, G.A., Cappi, M., Petrucci, P.-O., et al.\ 2015, A&A 588, 139
2015
-
[55]
and Shull, J.M.\ 2014, \ 793, 100
Moloney, J. and Shull, J.M.\ 2014, \ 793, 100
2014
-
[56]
Mor, R., & Trakhtenbrot, B.\ 2011, \ 737, L36
2011
-
[57]
& Netzer, H.\ 2012, \ 420, 526
Mor, R. & Netzer, H.\ 2012, \ 420, 526
2012
-
[58]
and Elitzur, M.\ 2009, \ 705, 298
Mor, R., Netzer, H. and Elitzur, M.\ 2009, \ 705, 298
2009
-
[59]
Morgan, C.W., Kochanek, C.S., Morgan, N.D., & Falco, E.E.\ 2010, \ 712, 1129
2010
-
[60]
Mosquera, A.M., Kochanek, C.S., Chen, B., et al.\ 2013, \ 769, 53
2013
-
[61]
Narayan, R.\ 1996, \ 462, 136
1996
-
[62]
Netzer, H., & Laor, A.\ 1993, \ 404, L51
1993
-
[63]
Netzer, H.\ 2015, ARA&A, 53, 365
2015
-
[64]
Pancoast, A., Brewer, B.J., Treu, T., et al.\ 2012, \ 754, 49
2012
-
[65]
Pancoast, A., Brewer, B.J., & Treu, T.\ 2014a, \ 455, 3055
-
[66]
Pancoast, A., et al.\ 2014b, \ 445, 3073
-
[67]
Pancoast, A., Barth, A., Horne, K., Treu, T., Brewer, B.J., et al.\ 2018, \ 856, 108
2018
-
[68]
Pei, L., Fausnaugh, M.M., Barth, A.J., Peterson, B.M., Bentz, M., et al.\ 2017, \ 837, 131, (Paper v )
2017
-
[69]
Peterson, B.M., Balonek, T.J., Barker, E.S., et al.\ 1991, \ 368, 119
1991
-
[70]
et al.\ 2013, \ 779, 109
Peterson, B.M., Denney, K.D., De Rosa, G., Grier, C.J., Pogge, R. et al.\ 2013, \ 779, 109
2013
-
[71]
Poindexter, S., Morgan, N., & Kochanek, C.S.\ 2008, \ 673, 34
2008
-
[72]
Ramolla, M., Haas, M., Westhues, C., et al.\ 2018, A&A 620, 137
2018
-
[73]
Rees, M.J., Netzer, H., & Ferland, G.J.\ 1989, \ 347, 640
1989
-
[74]
Schlafly, E.F., & Finkbeiner, D.P.\ 2011, \ 737, 103
2011
-
[75]
Shull, J.M., Stevans, M., & Danforth, C.W.\ 2012, \ 752, 162
2012
-
[76]
A.J., et al.\ 2015, \ 454, 144
Skielboe, A., Pancoast, A., Treu, T., Park, D., Barth. A.J., et al.\ 2015, \ 454, 144
2015
-
[77]
Starkey, D., Horne, K.D., Fausnaugh, M.M., Peterson, B.M., Bentz, M.C., et al.\ 2017, \ 835, 65, (Paper vi )
2017
-
[78]
et al.\ 2006, \ 639, 46
Suganuma, M., Yoshii, Y., Kobayashi, Y., Minezaki, T., Enya, K. et al.\ 2006, \ 639, 46
2006
-
[79]
Walter, R., Orr, A., Courvoisier, T.J.-L., Fink, H.H., Makino, F., Otani, C., & Wamsteker, W.\ 1994, A&A 285, 119
1994
-
[80]
Wamsteker, W., Rodriguez-Pascual, P., Wills, B.J., Netzer, H., Wills, D., et al.\ 1990, \ 354, 446
1990
-
[81]
White, R.J., and Peterson, B.M.\ 1994, PASP, 106, 879
1994
Reviewed August 14, 2026 · model on record in the stance chip above.
Discussion (0). Continue with ORCID to comment.