REVIEW 3 major objections 6 minor 26 references
Detection of symmetry using a crystallographic image processing algorithm
T0 review · 3 major / 6 minor · reviewed 2026-08-14 · deepseek-v4-flash
Pith's one-line read The paper claims that lower phase residuals in a crystallographic image processing search identify the correct plane symmetry group of a periodic 2D image, and that phase origin maps reveal hidden and broken symmetry elements.
desk verdict A solid teaching-oriented demonstration of known CIP methods on Escher woodcuts, with an overstated headline claim about automated symmetry detection that the paper itself partially contradicts. read the letter →
The pith
A machine-rendered reading of the paper's core claim, the machinery that carries it, and where it could break.
The reading
What carries the argument
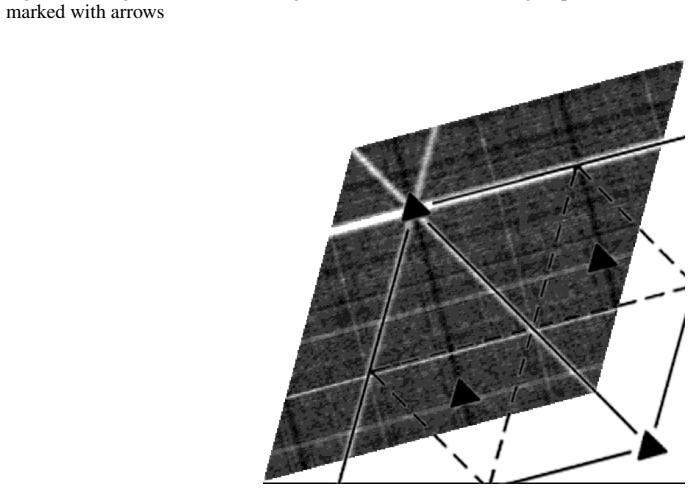
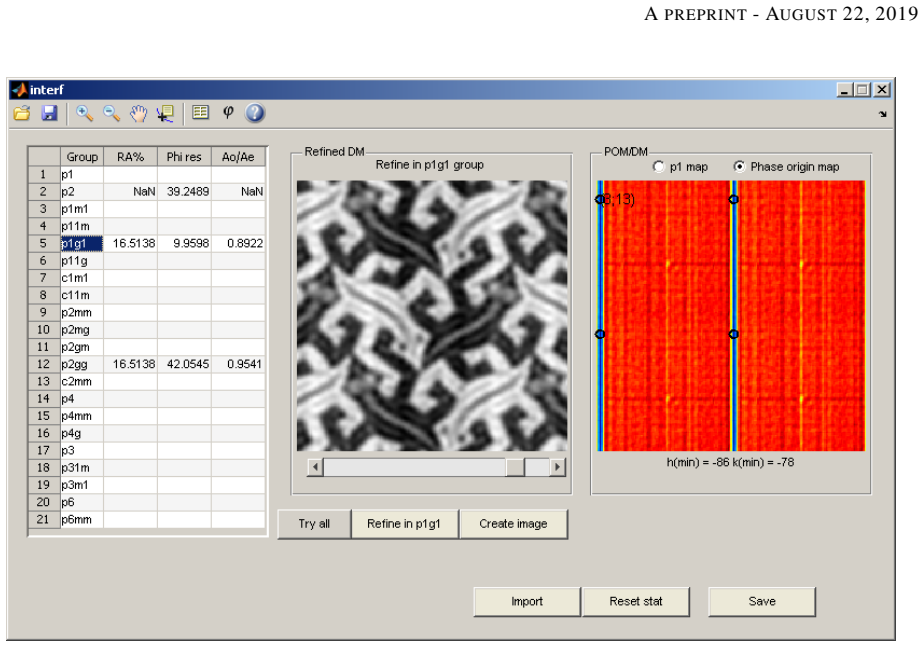
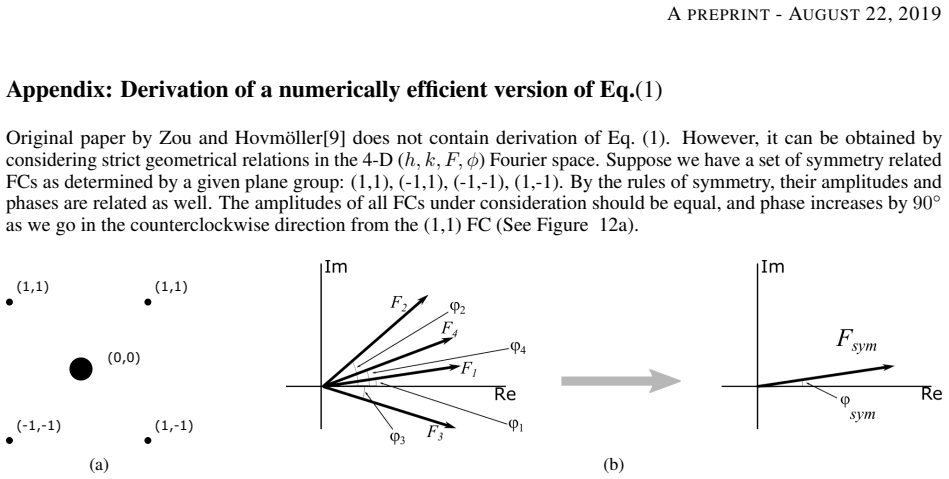
The central machinery is the phase residual functional and its visualization as a phase origin map (POM). For a candidate plane group, each observed Fourier component is compared with a 'symmetrized phase' obtained by averaging all symmetry-related components; the amplitude-weighted sum of phase differences yields a residual. Shifting the assumed origin by $(\varphi_x,\varphi_y)$ phases each component by $\varphi_x h + \varphi_y k$, and plotting the residual over all shifts produces the POM. In the paper's interpretation, deep minima mark rotation axes and dark lines mark mirror or glide lines, so the map serves both as an origin refiner and as a symmetry detector.
What would settle it
Take a synthetic image with an exactly known plane group, origin, and a single known mirror line; run the same pipeline; if another plane group scores a lower phase residual, or the phase origin map's dark line is displaced from the known mirror position (or absent), the central claim is refuted. Repeat over all 17 plane groups with controlled noise.
Extended reading notes
Core claim
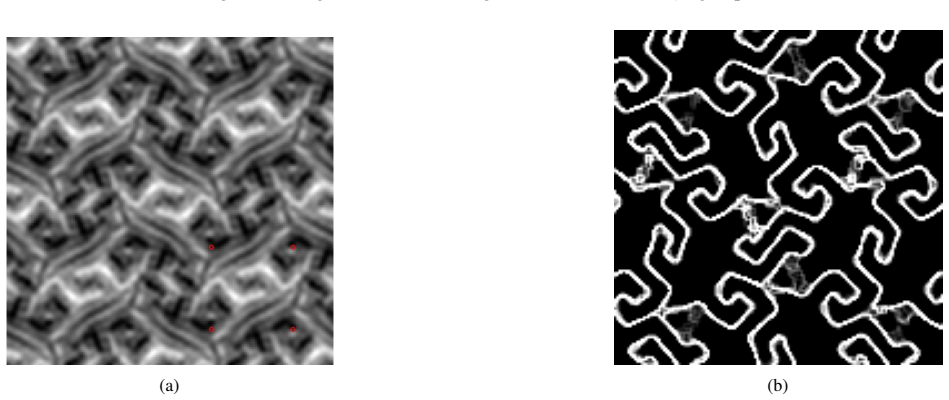
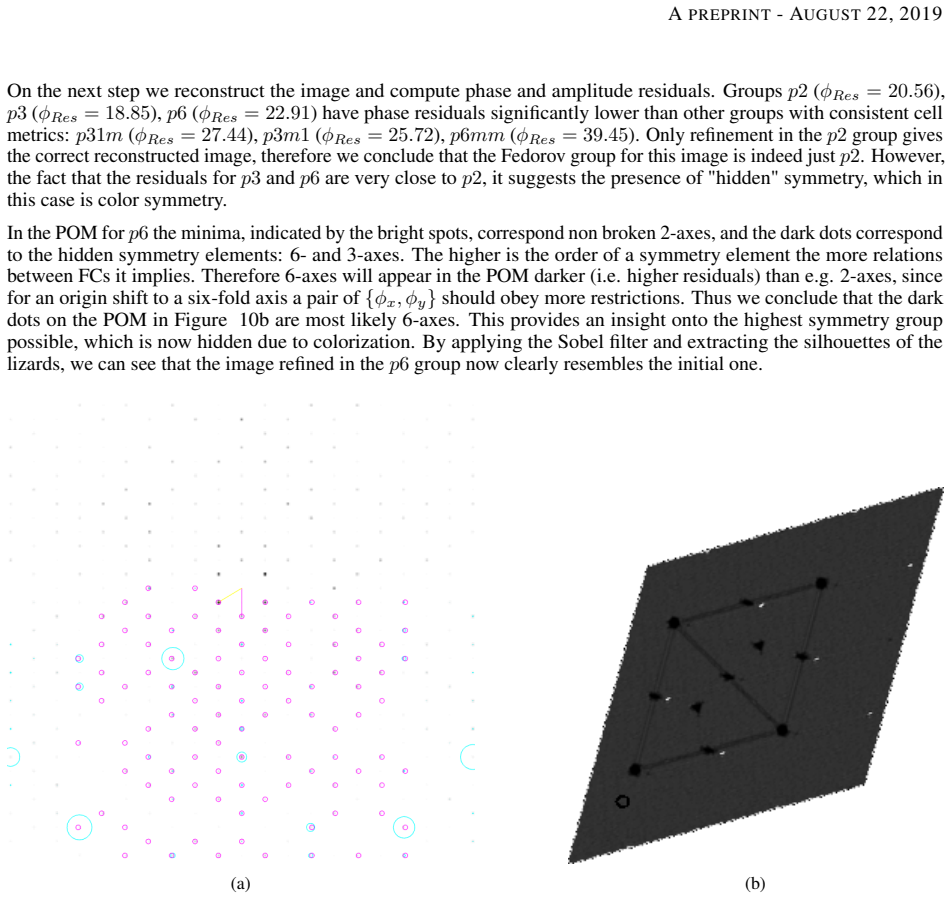
On its own terms, the paper discovers that the phase statistics of a periodic image's Fourier components carry enough symmetry information to classify its plane group and to localize symmetry elements. The symmetrized phase formula averages symmetry-related Fourier components, and the phase residual measures how far observed phases deviate from the relations imposed by each of the 17 plane groups; the lower the residual, the more likely the group. The phase origin map, built by plotting the residual as a function of origin shifts, shows dark lines and minima at positions corresponding to mirror/glide lines and rotation axes. By inspecting these maps, the author claims to detect symmetry elements that are not apparent in real space: a broken mirror in an 'impossible' tessellation, black-and-white glide symmetries, and color-hidden 6-fold axes.
Load-bearing premise
The method assumes that lower phase residuals directly indicate the correct plane group and that dark lines and minima in the phase origin map are faithful tracings of mirror, glide, and rotation elements in real space; the paper supports this only by visual comparison on four selected images rather than an independent ground-truth test.
Editorial extensions
If this is right
- Automated screening can rank the 17 plane groups for a periodic 2D image, with the lowest phase residual indicating the most probable group.
- Phase origin maps can reveal 'broken' symmetry elements—mirror lines that almost hold—and 'hidden' symmetry elements such as color-changing glide lines.
- Applying an edge-detection filter to a colored periodic pattern strips color and lets the same algorithm detect the color-blind supergroup.
- Systematically absent reflections, quantified by the Fo/Fe ratio, help distinguish plane groups that share phase relations and signal imperfect group membership.
Reading between the lines
- A natural next test would be a ground-truth benchmark: generate synthetic periodic images in each of the 17 plane groups with known origins and controlled noise, then measure how often the lowest phase residual identifies the correct group and how accurately POM minima locate symmetry elements.
- The same scoring could be applied to other 'structured' images—quasicrystal tilings, moiré patterns, or biological tissue sections—where local periodic order is suspected but a human eye cannot decide the symmetry group.
- Because the residual is amplitude-weighted, the method's sensitivity to broken symmetry is likely dominated by strong low-order Fourier components; small but symmetry-breaking details with weak high-frequency content may be systematically under-weighted.
- Comparing residuals between a group and its subgroups, as the paper does, could be formalized into a statistical model-selection criterion rather than a heuristic ranking.
Signed reviews
Editorial analysis
A structured set of objections, weighed in public.
Referee Report
Summary. The paper applies crystallographic image processing (CIP), originally developed for HRTEM, to digitized 2D images such as Escher woodcuts. It computes phase and amplitude residuals for candidate plane groups, uses the phase origin map (POM) to locate symmetry elements, and enforces or refines symmetry to reconstruct images. Four examples are used to argue that residuals rank candidate plane groups, that the POM reveals hidden or broken symmetry elements, and that Sobel-filtered colorblind versions of images expose supergroups. The central claims are that lower phase residuals indicate higher likelihood of the correct plane group (Section 2.2) and that POM features such as dark lines and minima correspond to mirror/glide lines and rotation axes (Section 3.4 and Section 4).
Significance. If fully supported, the method would provide an automated, quantitative way to assign plane groups to periodic 2D patterns and to identify symmetry elements that are not obvious in real space, with didactic value for crystallography teaching. The mathematical basis in Zou and Hovmöller's residual formulas is standard, and the four worked examples are internally consistent with visual inspection of the figures. However, the advertised residual-based classifier is contradicted by the paper's own tables, and the POM interpretation is not validated against a ground truth or synthetic artifact control. The absence of code, data, and error bars prevents independent verification of the quantitative residuals. These issues make the central claims currently unsupported as stated, though the underlying idea may be salvageable with a revised decision rule and validation.
major comments (3)
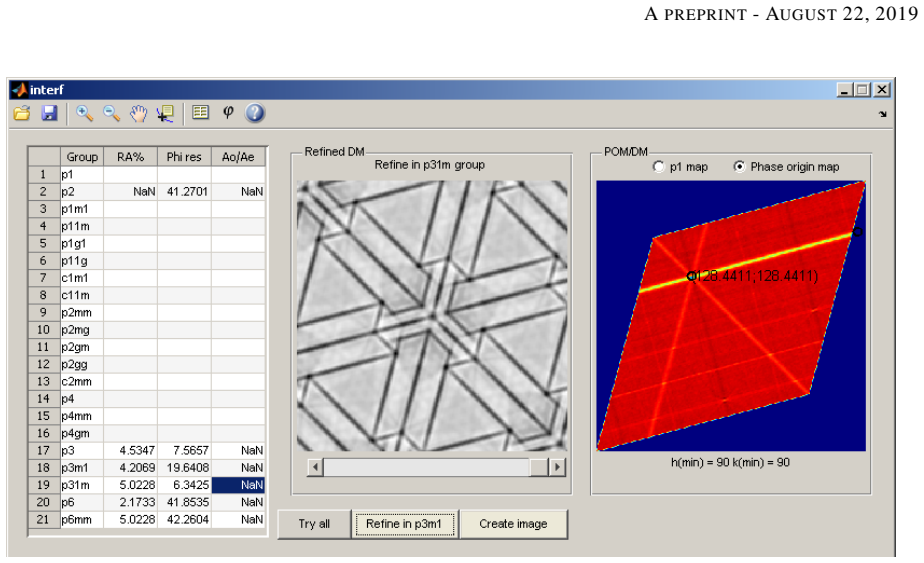
- [Section 2.2, Eq. (2) and Table 1, Section 4.4] The claim that 'the lower the residuals are for a given plane symmetry group, the higher is the likelihood that this group is the right one' is directly contradicted by the paper's own data. In Table 1, the image is assigned to p4gm, but p4gm has phase residual 46.5, while the subgroups p2 (24.2) and p1g1/p11g (24.1) have much lower residuals. In Section 4.4, the correct group p2 has residual 20.56, but p3 has 18.85. The author's recourse to 'look for the highest symmetry possible' and to compare refined images (Section 4.1) is an additional criterion that is not derived from Eq. (2) and is not formalized. As written, the residual ranking therefore does not provide an automated symmetry classifier; it must be replaced or supplemented by a clear rule that accounts for subgroup/supergroup relations, for example by comparing residuals only among groups that are not related by subgroup inclusion or by adding a penalty for additional symmetry relations.
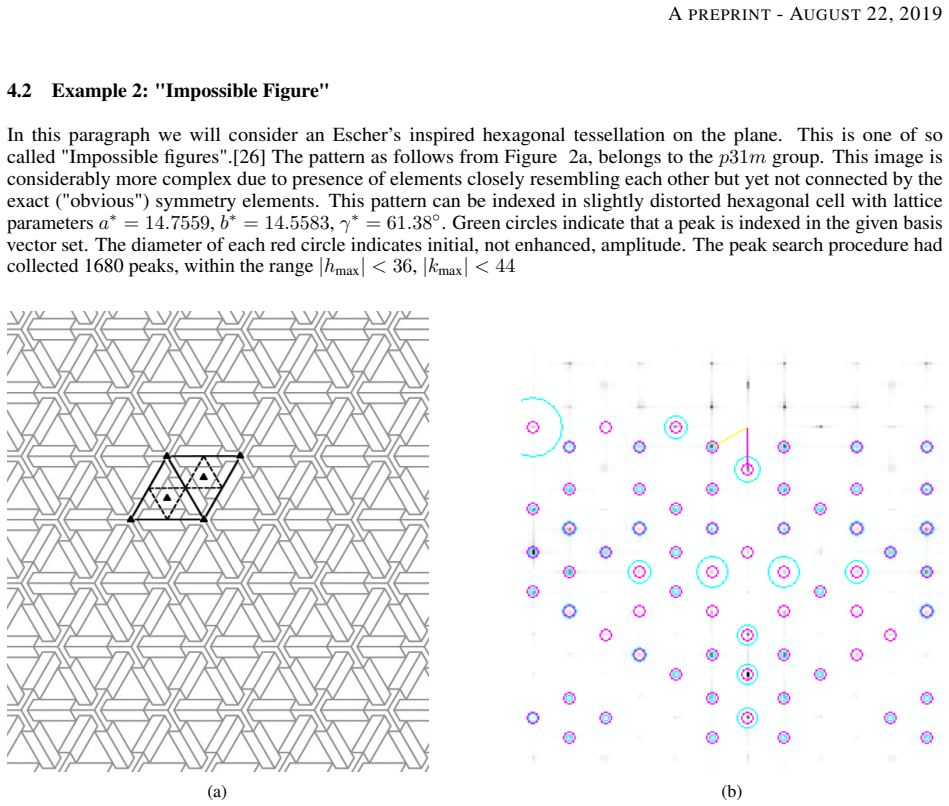
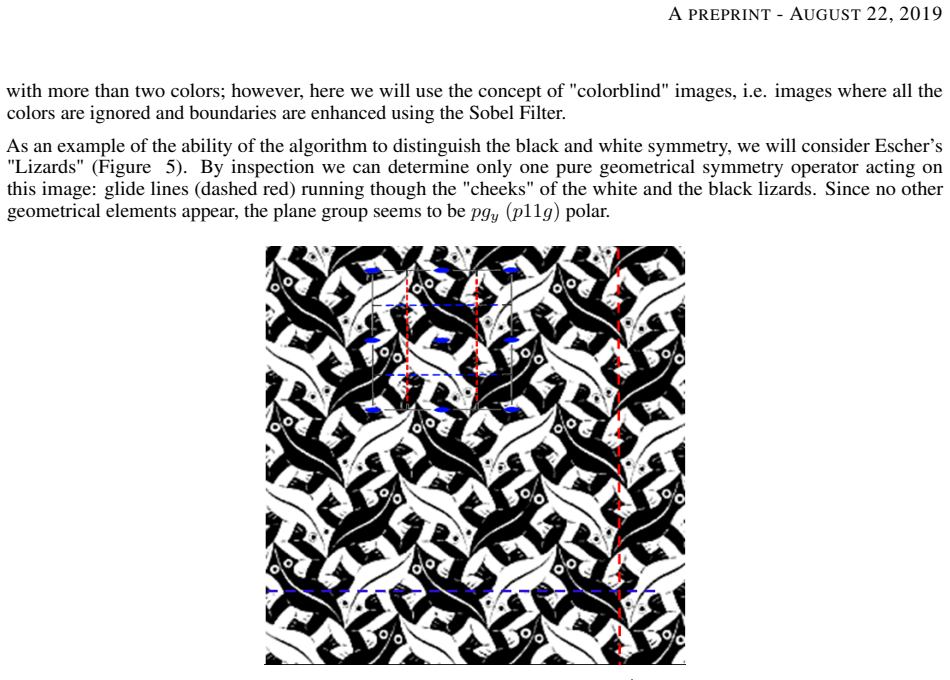
- [Section 3.4 and Sections 4.2-4.4] The interpretation of phase origin map features as 'hidden' or 'broken' symmetry elements is not validated by any independent ground-truth test. The paper asserts, for instance, that dark lines in the POM correspond to mirror lines, dimmer lines to glide lines, and dark dots to rotation axes, but the only support is visual alignment on four selected images. No synthetic images with known symmetry and controlled noise, no comparison with a full 17-plane-group benchmark, and no test of whether windowing, finite image size, or peak-search truncation can generate similar POM features are provided. Without such a control, the central inference that POM features directly encode real-space symmetry is an unsupported premise, and the conclusions about broken symmetry in Example 4.2 and hidden color symmetry in Examples 4.3 and 4.4 do not follow.
- [Section 3.1 and Tables 1-4] The paper provides no code, data, or detailed numerical output beyond a few residual values, so the residual tables cannot be independently reproduced or checked. Given that the central claim is quantitative and that the residual differences between groups can be small (for example, 20.56 vs. 18.85 in Section 4.4), error bars or a reproducibility statement are necessary. The reader cannot tell whether the reported residuals are stable under changes in windowing, peak search, and basis selection, which are all described as involving user choices (Section 3.1 and 3.2).
minor comments (6)
- [Abstract and Section 1] The abstract says 'an automated method to quantify and detect symmetry elements,' but the final decision in each example relies on visual comparison of refined images with the original; the criterion should be clarified in the abstract.
- [Section 2.2] The definition of the R-factor in ALLSPACE appears as an inline formula without equation numbering; renumbering or referencing it would improve readability.
- [Section 3.1] The sentence about the auto cross-correlation of the power spectrum reveals 'previously invisible' peaks, but the mechanism is not explained; a brief mathematical description would help.
- [Section 3.2, Eq. (5)] The notation in Eq. (5) is hard to parse because the rounding operator and the summation limits are not defined consistently; please define the index set over which the sum runs.
- [Section 4.3] The phrase 'pgy (p11g)' uses a nonstandard symbol 'pgy'; the full standard symbol p1g1 is introduced later, so the notation should be made consistent.
- [Section 4.4] The statement 'p3 and p6 are very close to p2' is ambiguous; please give the exact residual differences and a statistical or heuristic threshold for 'close'.
Circularity Check
Partial circularity: the residual-based likelihood ranking is a self-consistency fit that favors less constrained groups; the paper's own tables contradict it, and the final group selection depends on an extra 'highest symmetry' rule.
-
self definitional
[Section 2.2, Eqs. (1)-(2); Section 4.1, Table 1]
"If a FC is not related to any other FC by the symmetry (except by the Friedel’s law), then: φsym(hk) = φobs(hk). ... The lower the residuals φRes are for a given plane symmetry group, the higher is the likelihood that this group is the right one for the pattern under investigation."
Eq. (1) defines the symmetrized phase as a weighted average of the observed phases, so for any group with no symmetry relations φsym equals φobs and the phase residual (2) is identically zero by construction. The residual therefore measures self-consistency of the data with their own average, not agreement with an externally derived group model; fewer relations always make the fit trivially easier. The paper's own Table 1 confirms this: the correct p4gm has residual 46.5 while its subgroups p2 and p1g1/p11g have about 24.1-24.2, and Section 4.1 then adds an extra 'we look for the highest symmetry possible' criterion, which is not contained in Eq. (2).
full rationale
The main derivation chain—Fourier transform, peak search, symmetrized-phase residual, and phase origin map—is a direct numerical transform of the image data, and the POM interpretation is not definitionally circular. However, the methodological core in Section 2.2 is partially circular: φsym is a weighted average of the observed phases, and the paper explicitly sets φsym=φobs for unconstrained reflections, so Eq. (2) is minimized by construction for groups with fewer symmetry relations (identically zero for p1). Calling the resulting residual a 'likelihood' that the tested group is correct is therefore a fitted-input-as-prediction: the residual is a self-consistency score, not an independent test. The paper's own Table 1 and Section 4.4 admit that subgroups/supergroups have lower/higher residuals, and Section 4.1 introduces the additional 'highest symmetry possible' and refined-image comparison to escape the tautology. That extra criterion is not derived from Eqs. (1)-(2), so the central automated-classification claim is partially reduced by construction. The self-citations [20]-[22] are to the author's software implementation, not to a load-bearing theorem; the underlying CIP algorithm is externally attributed to [9] and [19]. The POM hidden/broken-symmetry readings are interpretive and are supported only by visual alignment on four selected images, which is a validation weakness rather than a circular step. Overall score 6 because one central predictive claim reduces by construction, while the broader method retains independent content.
Assumptions & free parameters
free parameters (2)
- Basis-selection weighting factors =
not quantified in the paper
- Peak-search and Fourier-component cutoff =
not specified; examples use 8264, 1680, 562 components
assumptions (6)
- standard math The Fourier transform of a periodic image is a discrete set of Fourier components, and plane-group symmetry imposes exact relationships between amplitudes and phases of symmetry-related components.
- domain assumption The symmetrized phase formula (Eq. 1) and phase residual functional (Eq. 2) from Zou and Hovmoller correctly measure how well an image conforms to a candidate plane group.
- standard math Plane-group phase relations tabulated in International Tables for Crystallography Vol. B are complete and correct for all wallpaper groups considered.
- ad hoc to paper Lower phase residuals correspond to higher likelihood of the correct plane group, and, among low-residual groups, the one with highest symmetry that reproduces the image upon refinement is the true group.
- domain assumption The phase origin map, computed as phase residual over shifts of the origin, has minima and extended features that correspond to real-space positions of symmetry elements.
- domain assumption Applying a Sobel edge filter yields a colorblind image whose plane group is the grey supergroup of the colored pattern.
Cite this review
Pith. "Pith review of Detection of symmetry using a crystallographic image processing algorithm." pith.science (2026). https://pith.science/paper/2JB4LGFF
@misc{pith2026190807932,
  author       = {Pith},
  title        = {Pith review of: Detection of symmetry using a crystallographic image processing algorithm},
  year         = {2026},
  howpublished = {\url{https://pith.science/paper/2JB4LGFF}},
  note         = {Machine review of arXiv:1908.07932}
}
read the original abstract
This article presents an automated method to quantify and detect symmetry elements in 2D patterns by means of image processing. Escher's woodcuts, a widely recognized didactic tool for crystallographic education of students, were used to demonstrate this approach. We also discuss peculiarities in the detection of black and white symmetry, color symmetry, and detection of the "hidden" and "broken" symmetry elements by means of the phase origin map approach.
Figures

Figures from the paper (9 more)



Reference graph
Works this paper leans on
- [1]
-
[2]
R.O. Gould and W. Massa. Crystal Structure Determination. Springer Berlin Heidelberg, 2013
work page 2013
-
[3]
A.V . Shubnikov and V .A. Koptsik.Symmetry in Science and Art . Plenum Press, 1974
work page 1974
- [4]
-
[5]
The mystery of the fifteenth bravais lattice
Allen Nussbaum. The mystery of the fifteenth bravais lattice. American Journal of Physics , 68(10):950–954, 2000
work page 2000
-
[6]
J. Amezcua-López and A. E. Cordero-Borboa. A mechanical lattice aid for crystallography teaching. The Physics Teacher, 26(6):384–389, 1988
work page 1988
-
[7]
Visual discrimination of the 17 plane symmetry groups
Klaus Landwehr. Visual discrimination of the 17 plane symmetry groups. Symmetry, 3(2):207 – 219, 01 2011
work page 2011
-
[8]
L. Koren. Wabi-sabi for Artists, Designers, Poets & Philosophers . Wabi-sabi for Artists, Designers, Poets & Philosophers. Imperfect Publishing, 2008
work page 2008
Show all 26 references
-
[9]
Structure Determination from HREM by Crystallographic Image Processing , pages 275–300
Xiaodong Zou and Sven Hovmöller. Structure Determination from HREM by Crystallographic Image Processing , pages 275–300. Springer Netherlands, Dordrecht, 2006
2006
-
[10]
From virus structure to chromatin: X-ray diffraction to three-dimensional electron microscopy
Aaron Klug. From virus structure to chromatin: X-ray diffraction to three-dimensional electron microscopy. Annual Review of Biochemistry, 79(1):1–35, 2010. PMID: 20192760
2010
-
[11]
Electron crystallography: Electron microscopy and electron diffraction
Xiaodong Zou, Sven Hovmöller, and Peter Oleynikov. Electron crystallography: Electron microscopy and electron diffraction. Electron Crystallography: Electron Microscopy and Electron Diffraction, pages 1–344, 01 2012
2012
-
[12]
P. Moeck. Systems for assessing and enhancing the performance of scanning probe microscopes by quantifying and enforcing symmetries and periodicities in two dimensions, jun " 5" 2012. US Patent 8,196,216
2012
-
[13]
Straton, Bill Moon, Taylor T
Jack C. Straton, Bill Moon, Taylor T. Bilyeu, and Peter Moeck. Removal of multiple-tip artifacts from scanning tunneling microscope images by crystallographic averaging. Advanced Structural and Chemical Imaging , 1(1):14, Nov 2015
2015
-
[14]
International Tables for Crystallography, V olume A: Space Group Symmetry
Theo Hahn, editor. International Tables for Crystallography, V olume A: Space Group Symmetry. International Tables for Crystallography. Kluwer Academic Publishers, Dordrecht, Boston, London, 5. revised edition edition, 2002
2002
-
[15]
Shmueli, editor
U. Shmueli, editor. International Tables for Crystallography, V olume B: Reciprocal Space. International Tables for Crystallography. Springer Netherlands, 2008
2008
-
[16]
X. Zou. Electron Crystallography of Inorganic Structures: Theory and Practice . Chemical Communications. Stockholm University, 1997
1997
-
[17]
Symmetry-adapted fourier series for the wallpaper groups
Bart Verberck. Symmetry-adapted fourier series for the wallpaper groups. Symmetry, 4(3):379–426, 2012
2012
-
[18]
A. V . Oppenheim and J. S. Lim. The importance of phase in signals.Proceedings of the IEEE, 69(5):529–541, May 1981
1981
-
[19]
Crisp: crystallographic image processing on a personal computer
Sven Hovmöller. Crisp: crystallographic image processing on a personal computer. Ultramicroscopy, 41(1):121 – 135, 1992
1992
-
[20]
Crystallographic processing of scanning probe microscopy images on the example of 2d periodic molecular monolayer arrays
P Moeck, J Straton, B Moon, P Plachinda, M Hietschold, H Glowatzki, N Koch, and JP Rabe. Crystallographic processing of scanning probe microscopy images on the example of 2d periodic molecular monolayer arrays. Microscopy and Microanalysis, 16(S2):456–457, 2010
2010
-
[21]
Moeck, P
P. Moeck, P. Plachinda, B. Moon, J. Straton, S. Rouvimov, M. Toader, M. Abdel-Hafiez, and M. Hietschold. Quantifying and enforcing two-dimensional symmetries in scanning probe microscopy images of periodic objects. In 2009 International Semiconductor Device Research Symposium ,...
2009
-
[22]
Crystallographic image processing software for scanning probe microscopists
Pavel Plachinda, Bill Moon, and Peter Moeck. Crystallographic image processing software for scanning probe microscopists. APS March Meeting, 2010
2010
-
[23]
Automatic lattice determination for two-dimensional crystal images
Xiangyan Zeng, Bryant Gipson, Zi Yan Zheng, Ludovic Renault, and Henning Stahlberg. Automatic lattice determination for two-dimensional crystal images. Journal of Structural Biology, 160(3):353 – 361, 2007. Electron Crystallography of Membrane Proteins
2007
-
[24]
Towards generalized noise-level dependent crystallographic symmetry classifications of more or less periodic crystal patterns
Peter Moeck. Towards generalized noise-level dependent crystallographic symmetry classifications of more or less periodic crystal patterns. Symmetry, 10(5), 2018
2018
-
[25]
Gramlich and H
V . Gramlich and H. Wondratschek.Graphs for klassengleiche subgroups, pages 415–425. Springer Netherlands, Dordrecht, 2004
2004
-
[26]
Selection is Distortion, pages 5–16
Bruno Ernst and Hans de Rijk. Selection is Distortion, pages 5–16. Springer Berlin Heidelberg, 2007. 16
2007
Reviewed August 14, 2026 · model on record in the stance chip above.
Discussion (0). Continue with ORCID to comment.