REVIEW 3 major objections 3 minor 30 references
Spitzer catalog of Herschel-selected ultrared dusty, star-forming galaxies
T0 review · 3 major / 3 minor · reviewed 2026-08-14 · deepseek-v4-flash
Pith's one-line read Herschel 'ultrared' dusty galaxies are extreme, rare starbursts at median redshift 3.3 that cannot be the main progenitors of massive quiescent galaxies.
desk verdict Useful Spitzer catalog and first consistent mass estimates for 500-um risers, but the progenitor claim rests on an assumed duty cycle and a thin spec-z calibration; worth refereeing. read the letter →
The pith
A machine-rendered reading of the paper's core claim, the machinery that carries it, and where it could break.
The reading
What carries the argument
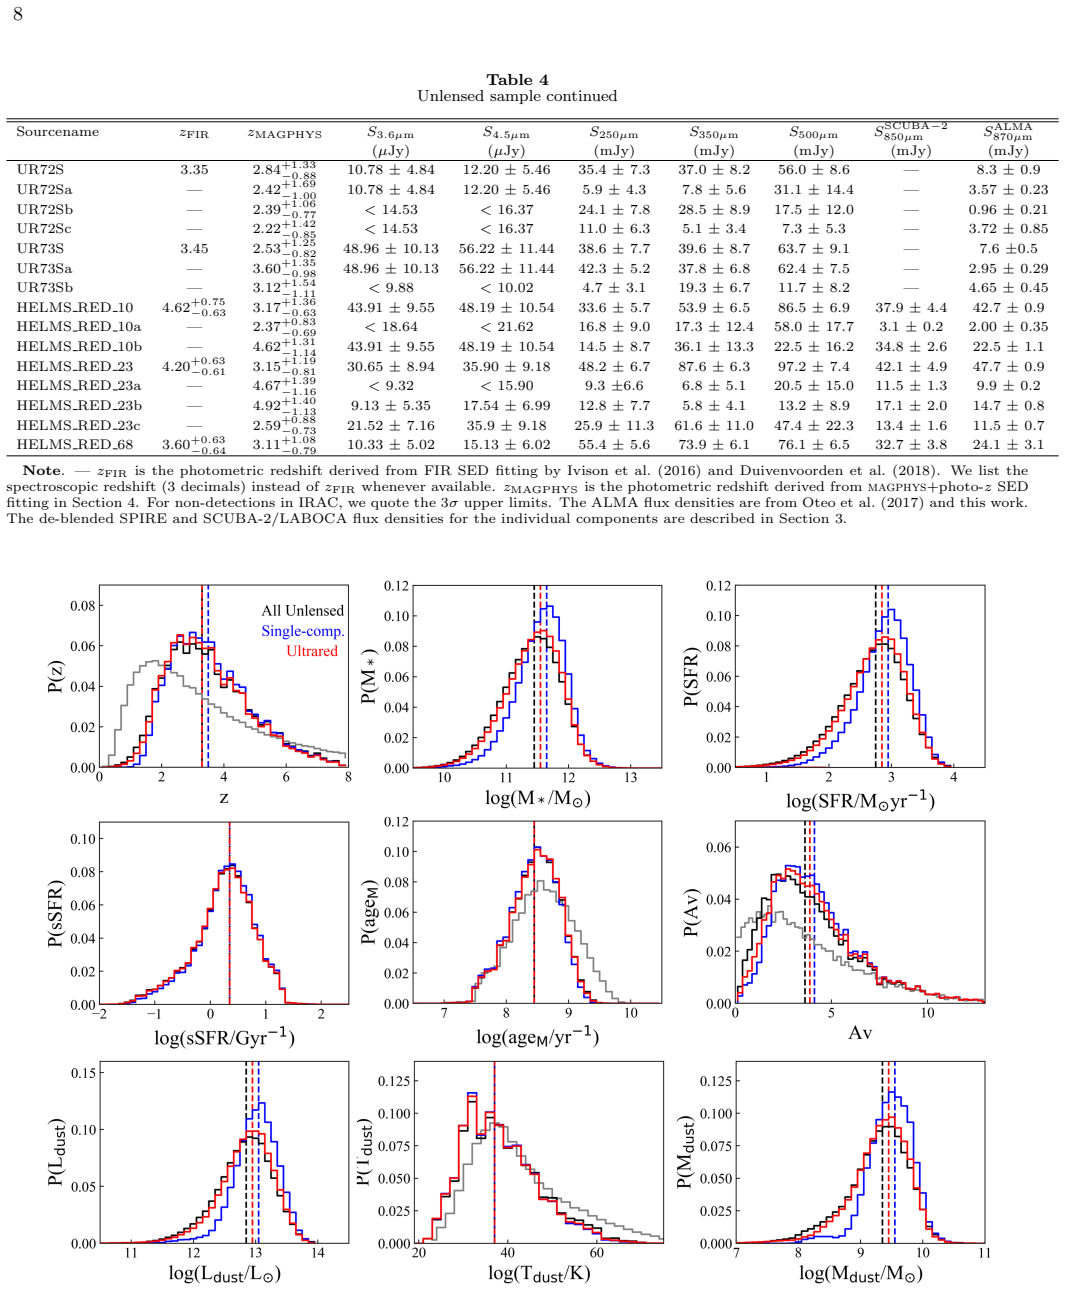
The machinery has two parts. The selector is the ultrared color criterion S500>S350>S250, the '500 micron-riser' cut, which uses the rising SPIRE spectrum to pick out distant, dusty, star-forming galaxies beyond the typical z~2 DSFG peak; the classifier is high-resolution interferometry from ALMA, NOEMA, and SMA, which pinpoints counterparts and splits the sample into lensed, unlensed, and multiple-component systems. The property extractor is magphys+photo-z, an energy-balance SED model that combines stellar and dust emission and runs on IRAC 3.6/4.5 micron plus SPIRE, SCUBA-2/LABOCA, and ALMA photometry; it turns the photometry into redshifts, stellar masses, SFRs, dust luminosities, dust masses, and extinctions, and its stacked posterior distributions carry the demographic comparison.
What would settle it
Measure spectroscopic redshifts and interferometric sizes for a complete, flux-limited sample of 500 micron-risers over a large area, and independently determine the starburst duty cycle from the fraction of ultrared galaxies caught in merger-induced starburst phases; if the corrected ultrared space density at z~5 approaches the roughly 2 x $10^{-5}$ $Mpc^{-3}$ density of massive quiescent galaxies at z~3, or if the duty cycle turns out to be about 1 Gyr rather than 100 Myr, the paper's central demographic conclusion would fail.
Extended reading notes
Core claim
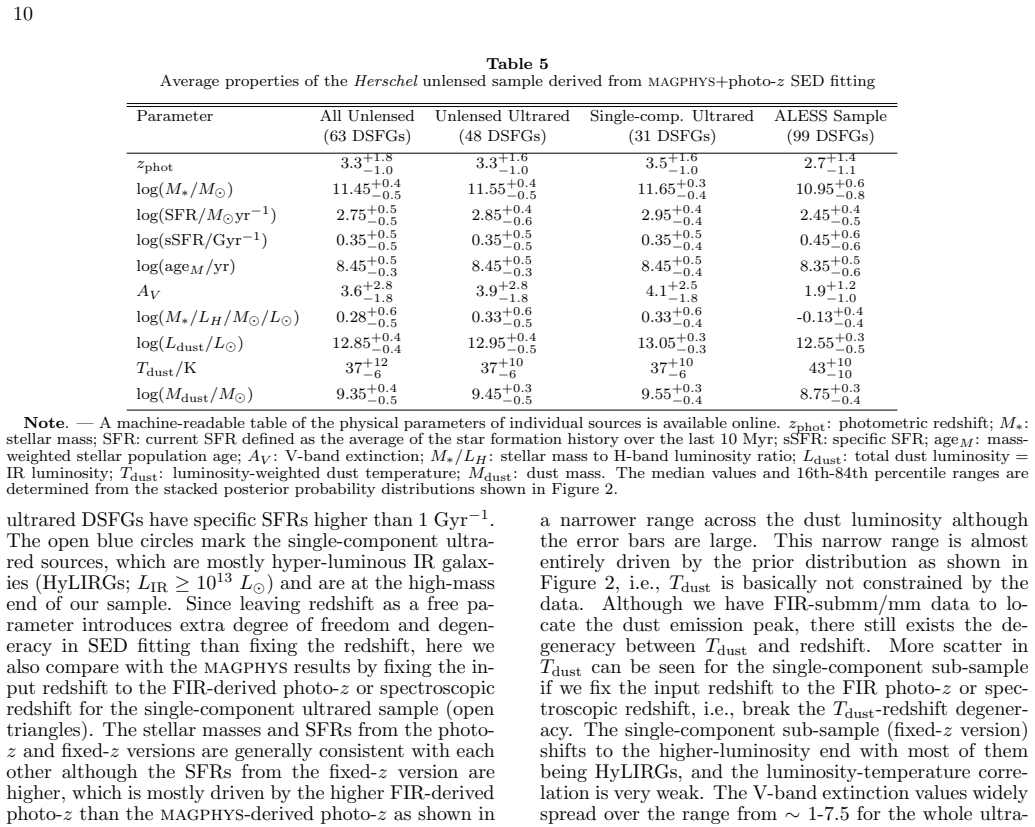
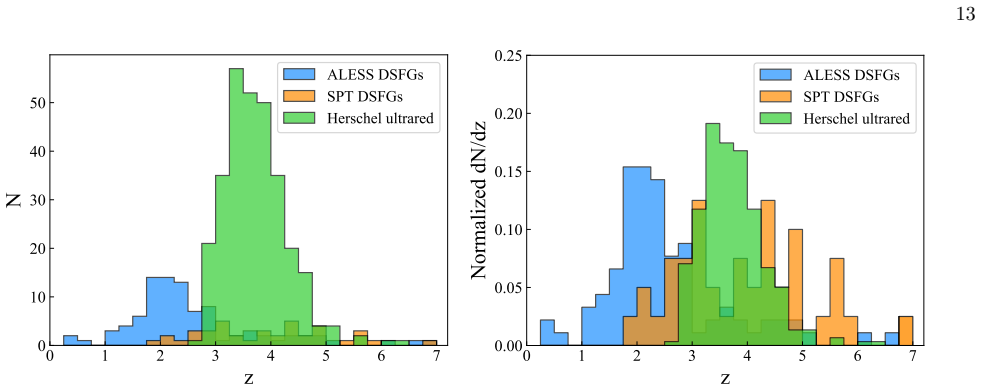
On the paper's own terms, the discovery is a demographic one: the 500 micron-riser selection, S500>S350>S250, efficiently finds a tail of DSFGs at z>4, but when followed up at high resolution and modeled with magphys, the unlensed subset turns out to be a rare population of intrinsically hyper-luminous, massive, heavily obscured starbursts (median z=3.3, M*=3.7 x $10^{11}$ Msun, SFR=730 Msun/yr, Ldust=9.0 x $10^{12}$ Lsun, Mdust=2.8 x $10^{9}$ Msun, Av=4.0). Comparing space density, SFR density, and stellar mass density against the massive quiescent galaxies at z~3 from near-infrared surveys, the paper concludes that these ultrared DSFGs contribute at most about 1.7 percent of the total stellar mass density at z~3.25 and cannot supply the majority of the progenitors of massive quiescent galaxies; instead they are the rarer, intrinsically most extreme systems in the early universe.
Load-bearing premise
The load-bearing premise is that, after the completeness corrections of Ivison et al. (2016) and an assumed starburst duty cycle of about 100 Myr, the H-ATLAS unlensed ultrared sample traces the true space density of the ultrared population; if the duty cycle is wrong, the stellar-mass-density comparison and the 'cannot account for progenitors' conclusion lose quantitative support.
Editorial extensions
If this is right
- The unlensed ultrared sample, with median redshift 3.3 and extreme properties, is a set of intrinsic hyper-luminous infrared galaxies that can be studied without lens-model uncertainties.
- After completeness and duty-cycle corrections, the ultrared population contributes at most about 1.7 percent of the total stellar mass density at z~3.25, so searches for massive-quiescent-galaxy progenitors should target other selections such as fainter submillimeter-selected DSFGs.
- About 27 percent of Herschel ultrared sources break into multiple components at high resolution and roughly 20 percent would fail the 500 micron-riser cut without blending, so flux-boosting by blending must be folded into counts of high-redshift DSFGs.
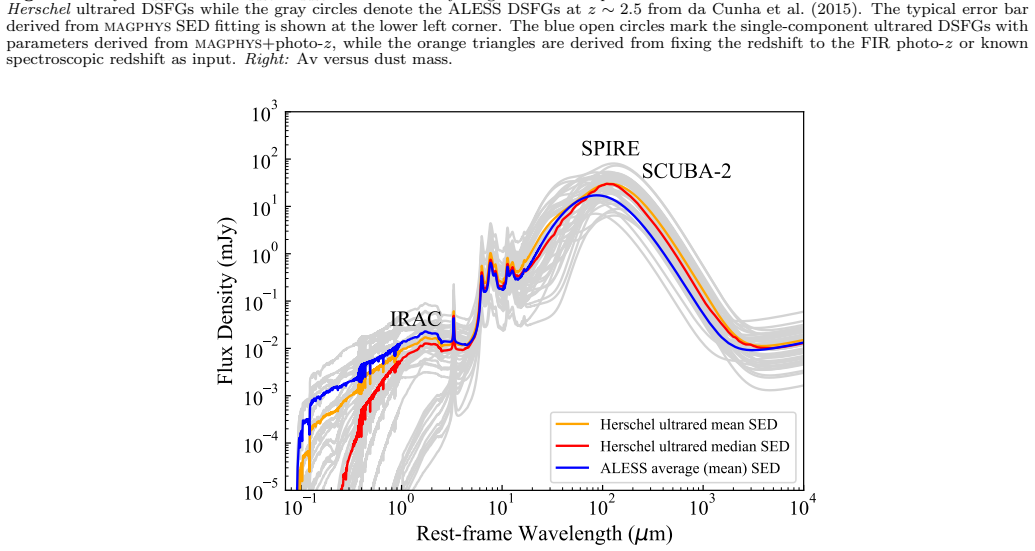
- The stacked SEDs show the ultrared population peaks at longer wavelengths and is more dust-obscured than ALESS DSFGs, implying that longer-wavelength selection reaches intrinsically more extreme galaxies.
Reading between the lines
- If the assumed ~100 Myr starburst duty cycle is an overestimate, the corrected space density and stellar mass density would rise, potentially bringing the ultrared population closer to the required progenitor densities; the duty cycle is assumed, not measured, in this paper.
- A direct test would be to measure the prevalence and timescales of merger-induced starburst phases among ultrared galaxies, since the demographic comparison assumes all of them are caught in a single short-lived phase; rest-frame optical spectroscopy could tie stellar ages to the duty cycle.
- The paper's conclusion is framed for the Herschel flux-limited sample; deeper 500 micron surveys or longer-wavelength selections could uncover a more numerous fainter ultrared population that may dominate the progenitor budget.
Signed reviews
Editorial analysis
A structured set of objections, weighed in public.
Referee Report
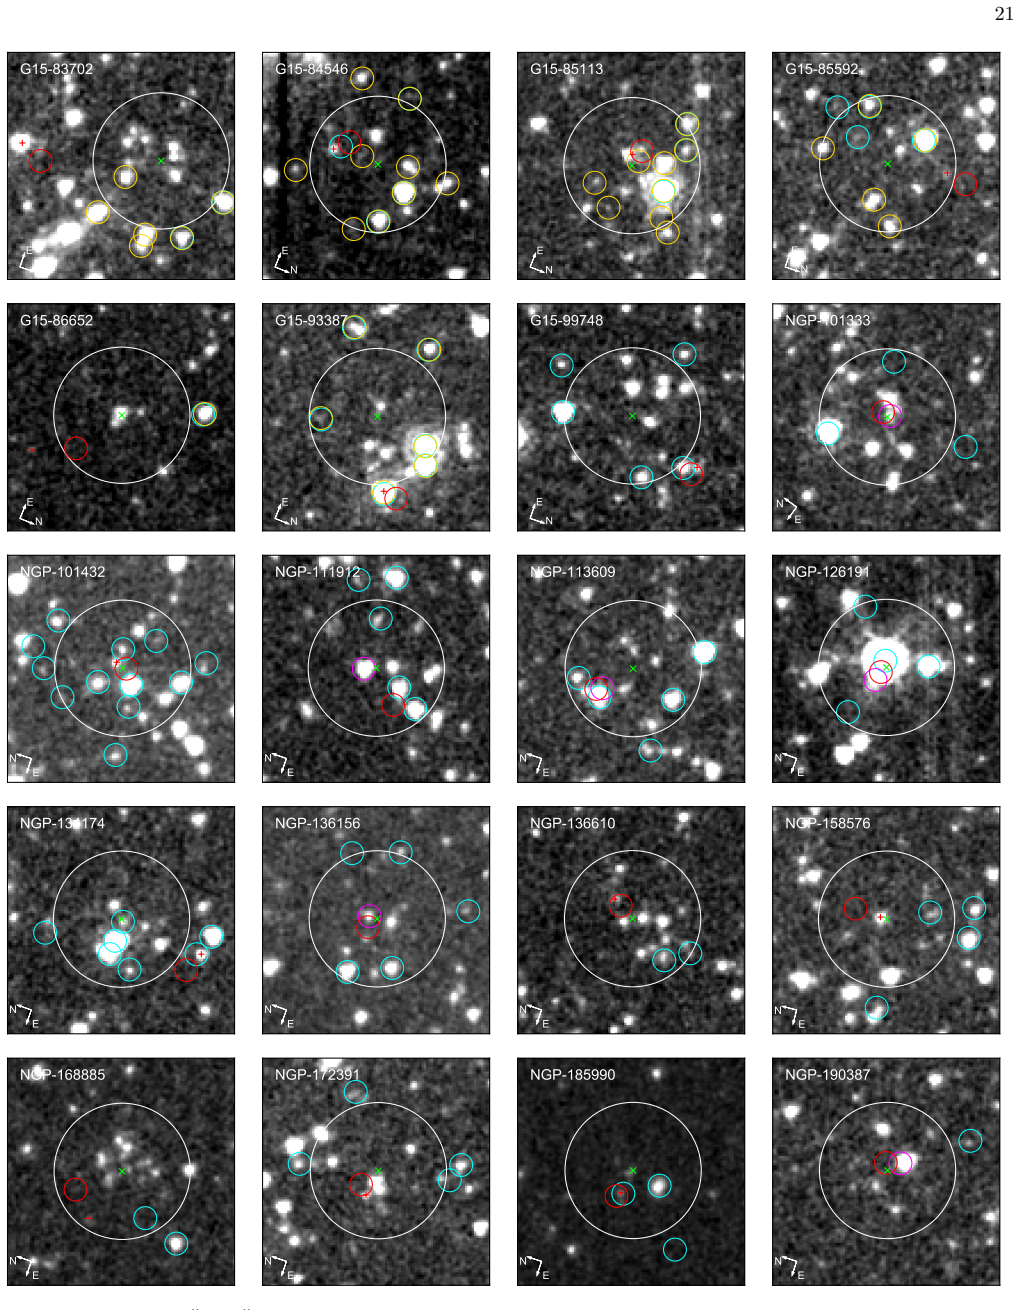
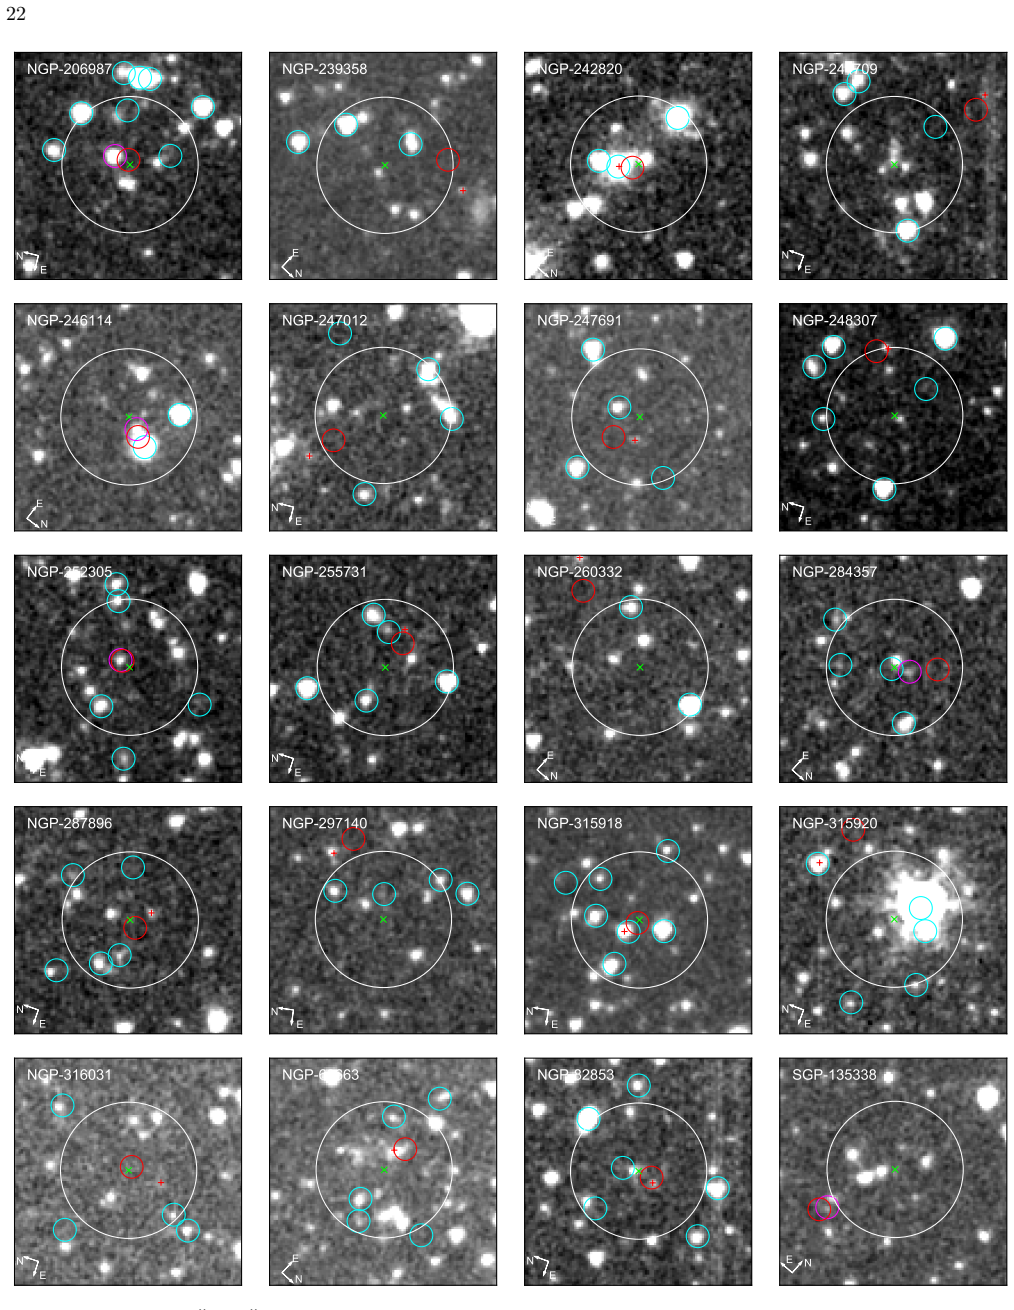
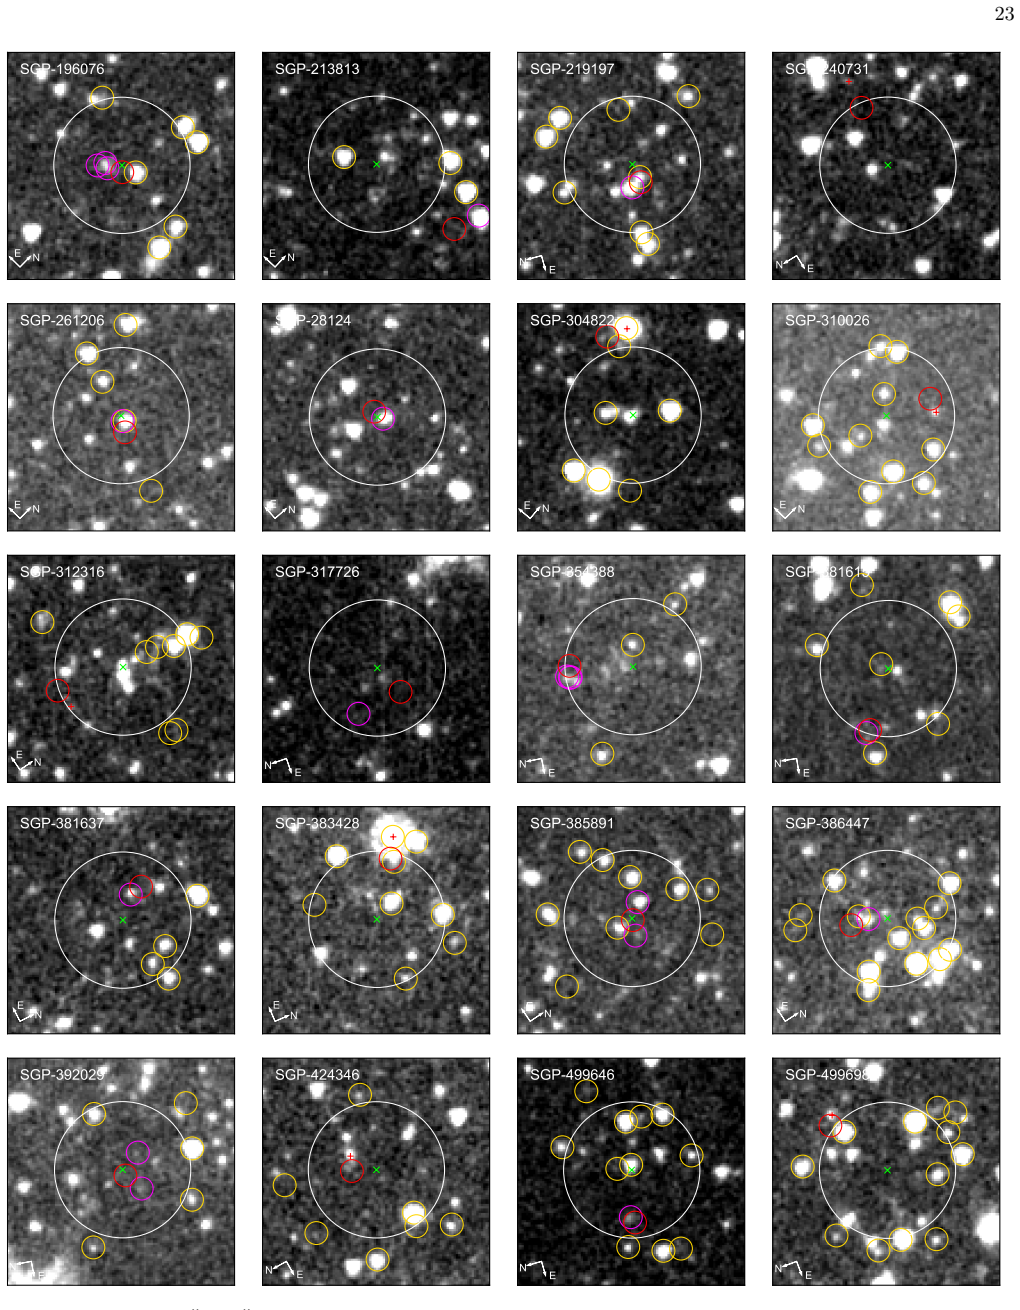
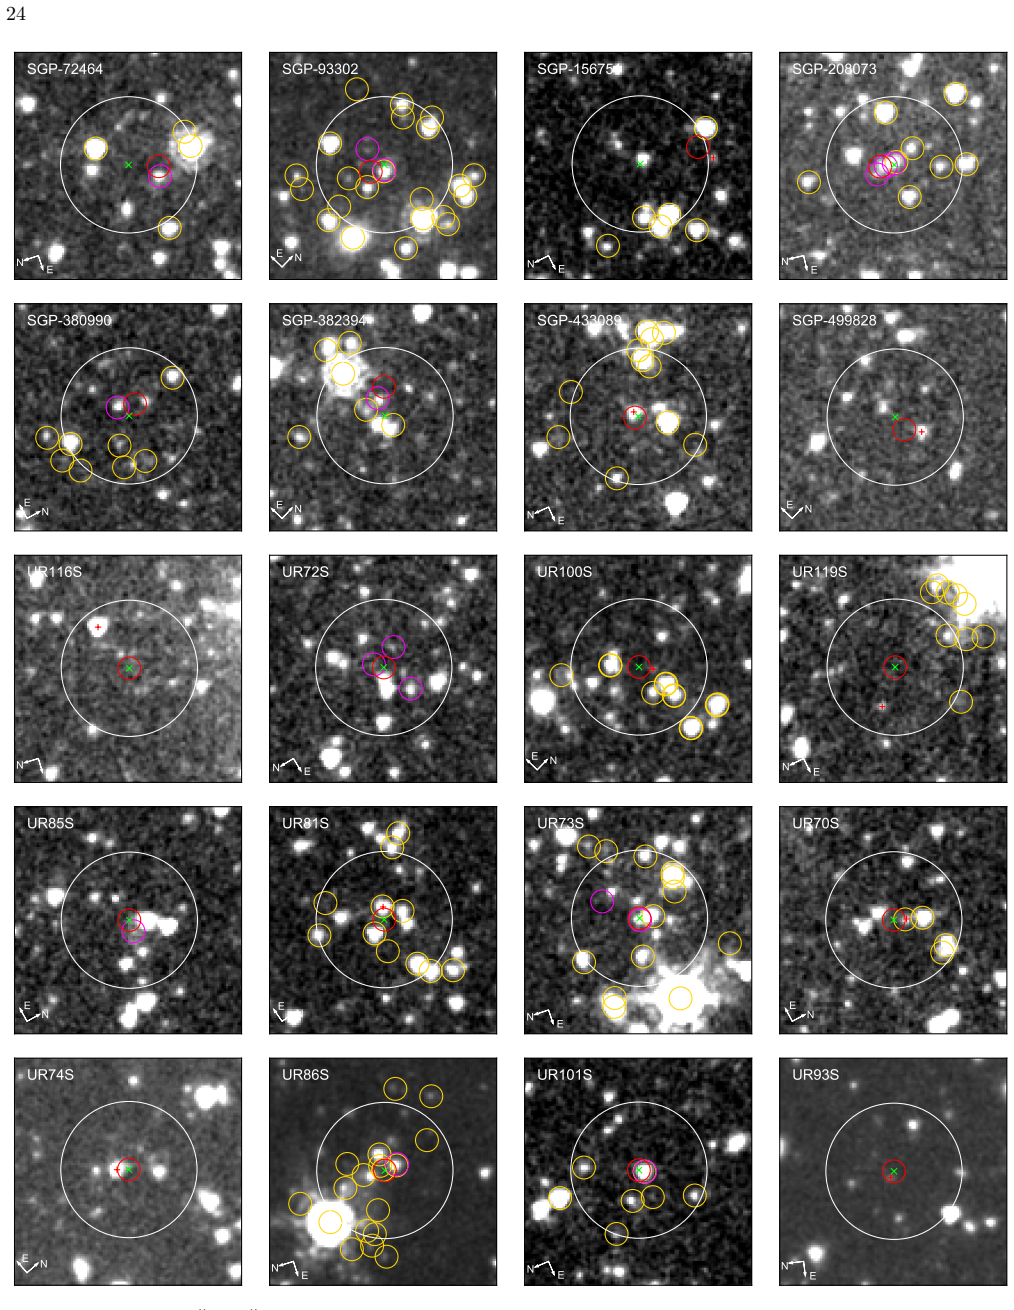
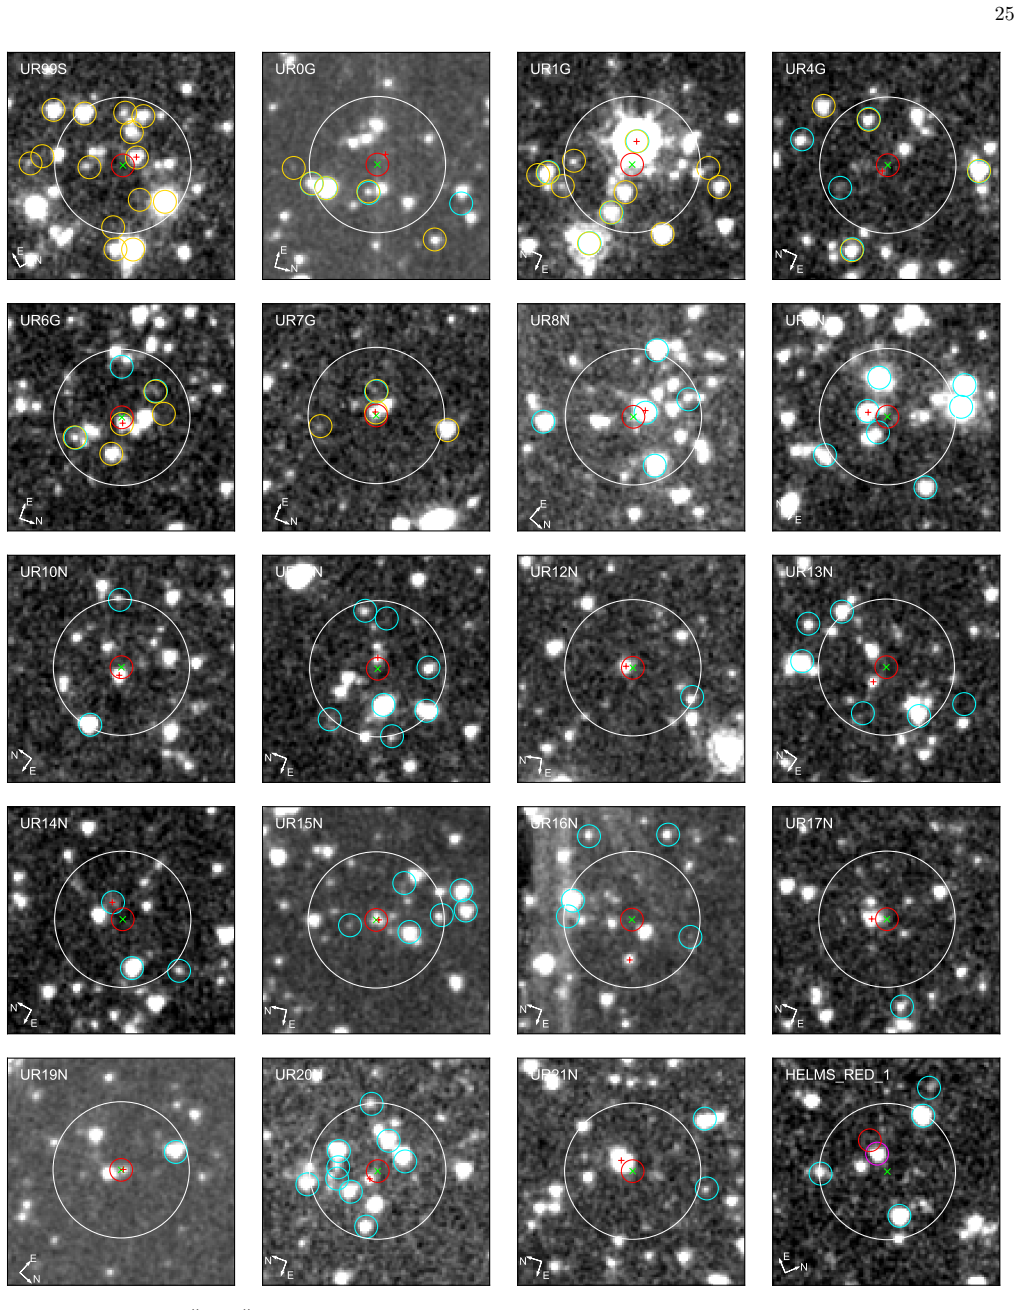
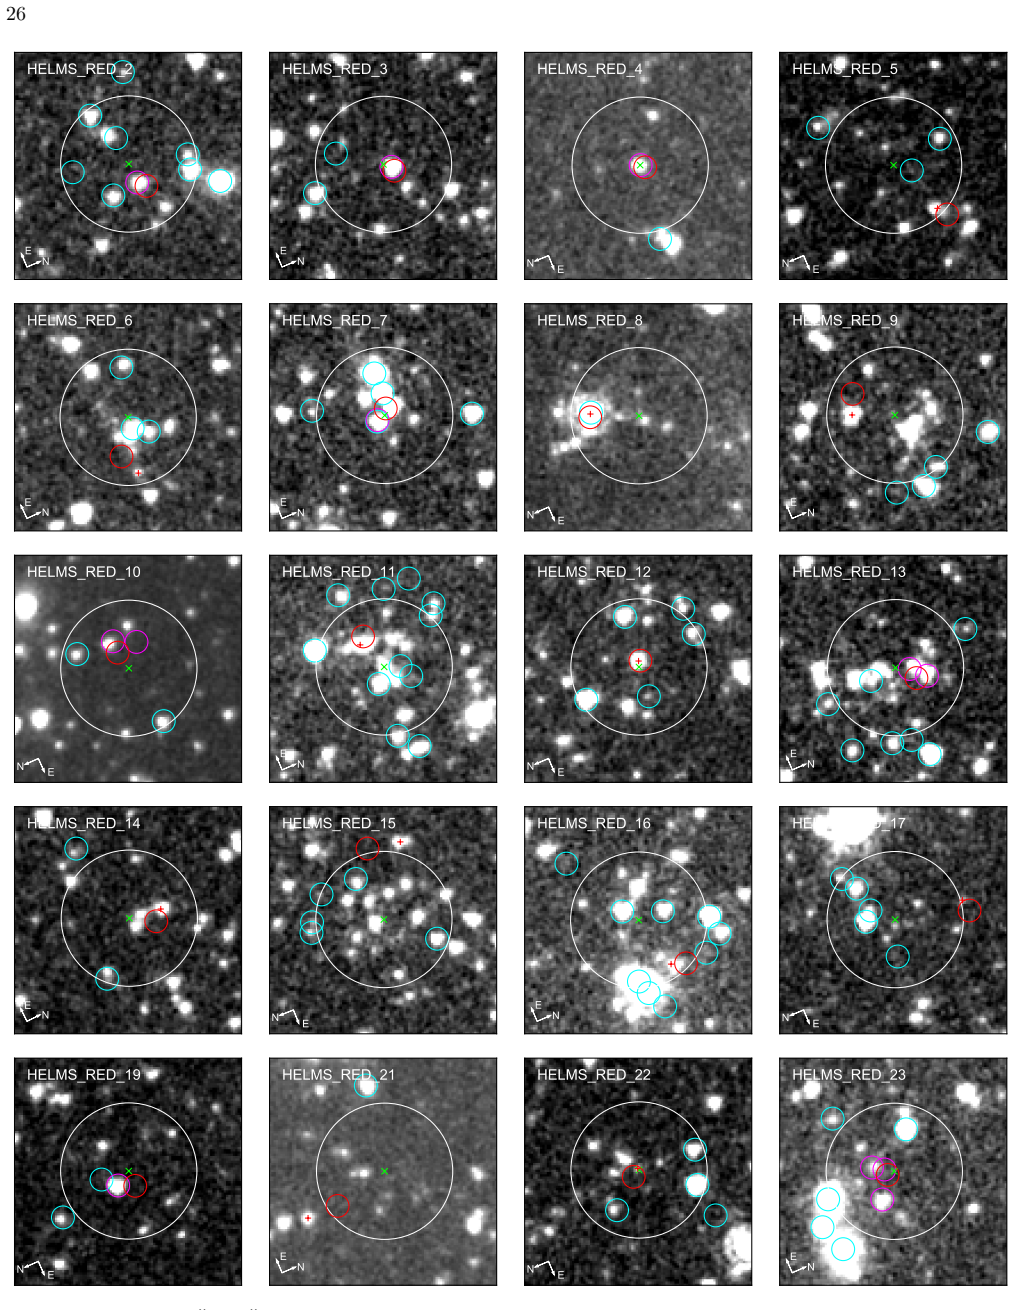
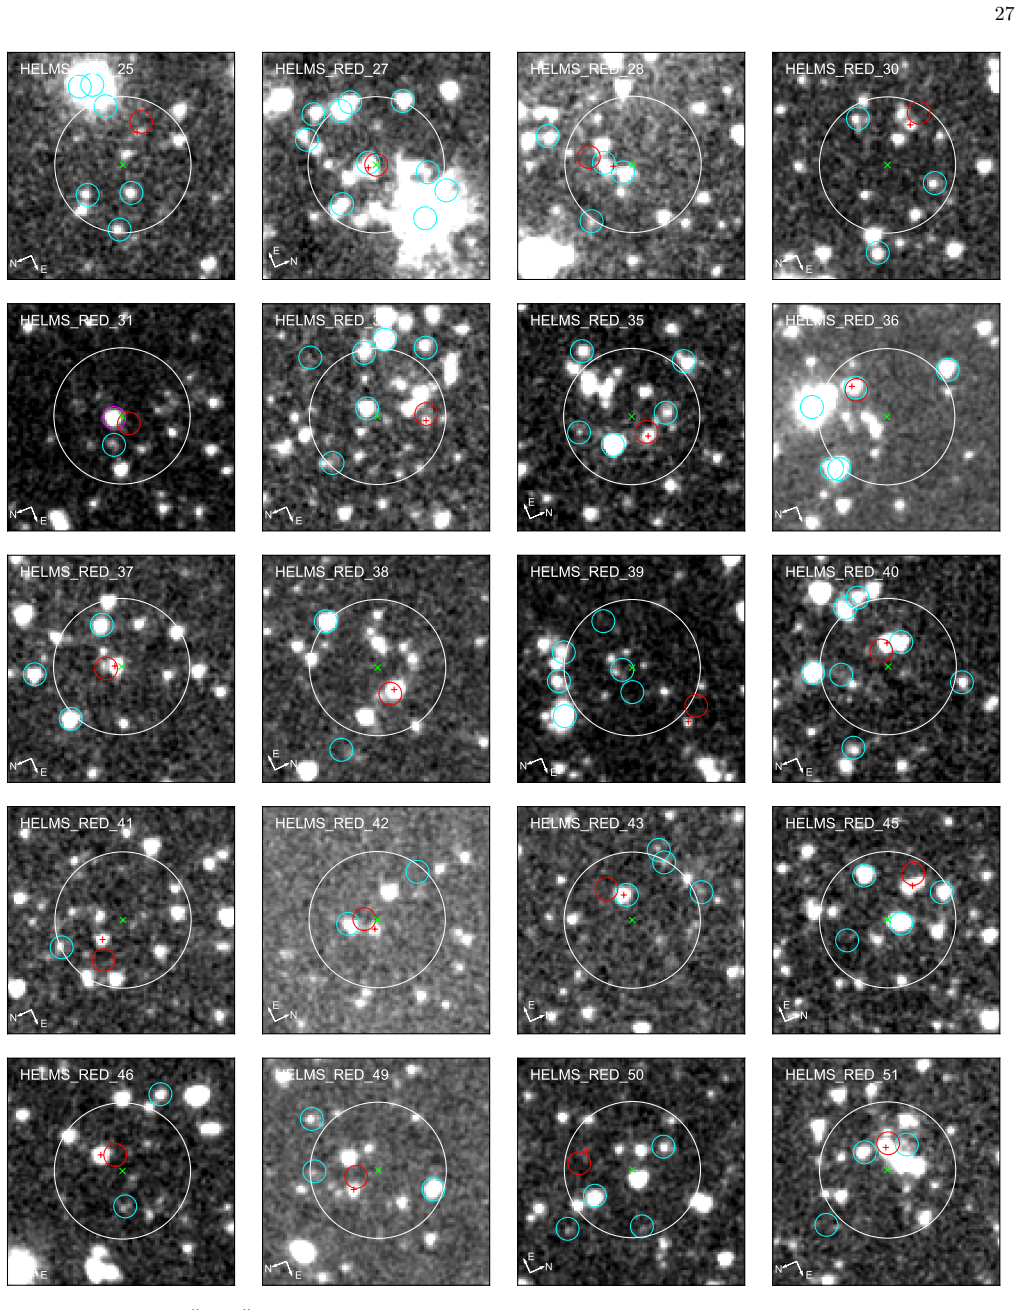
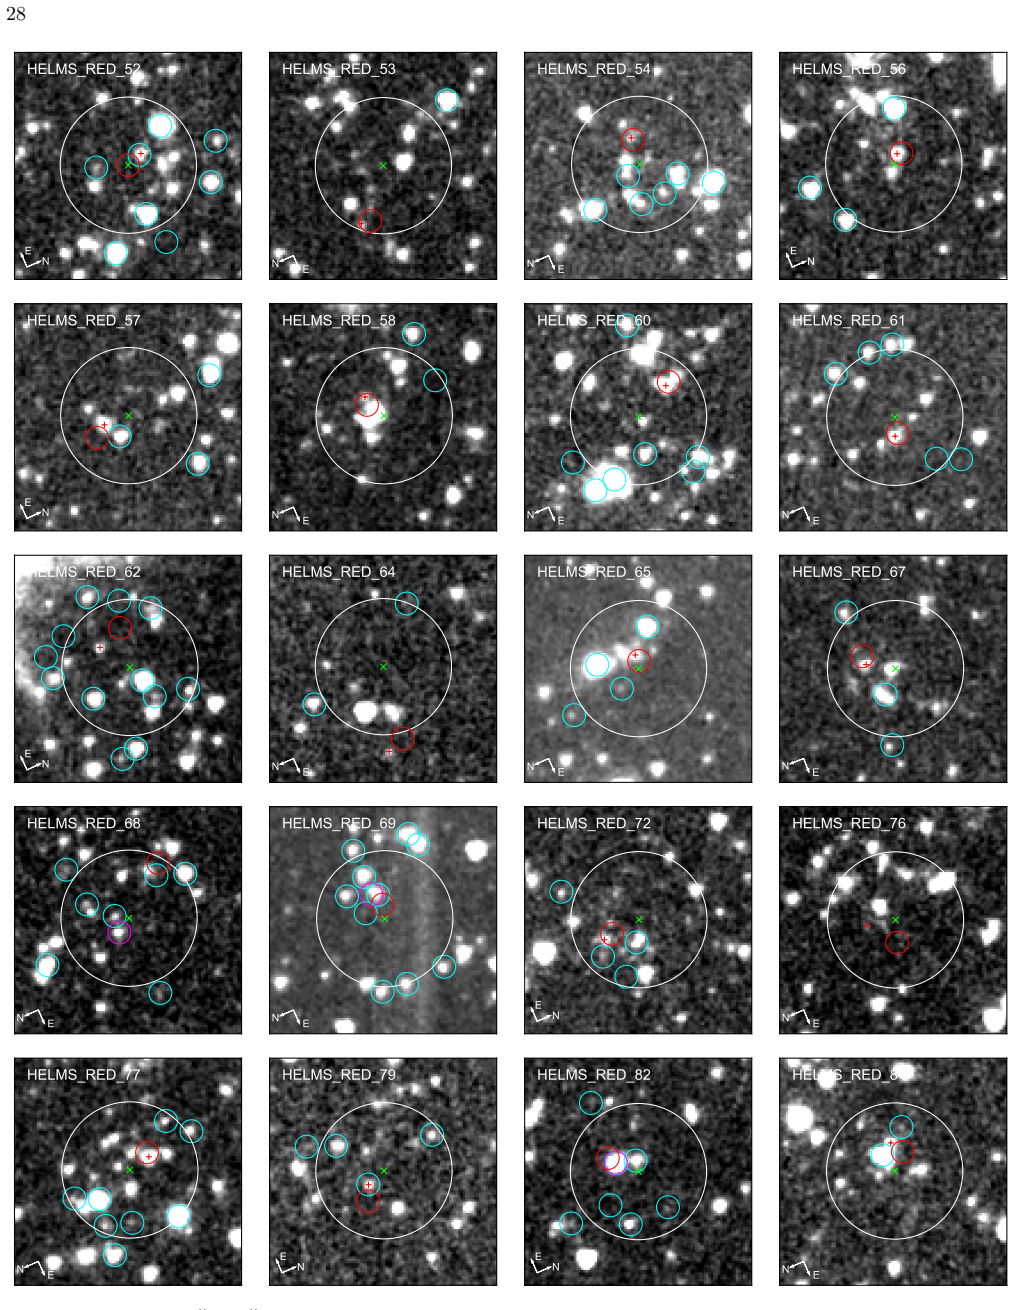
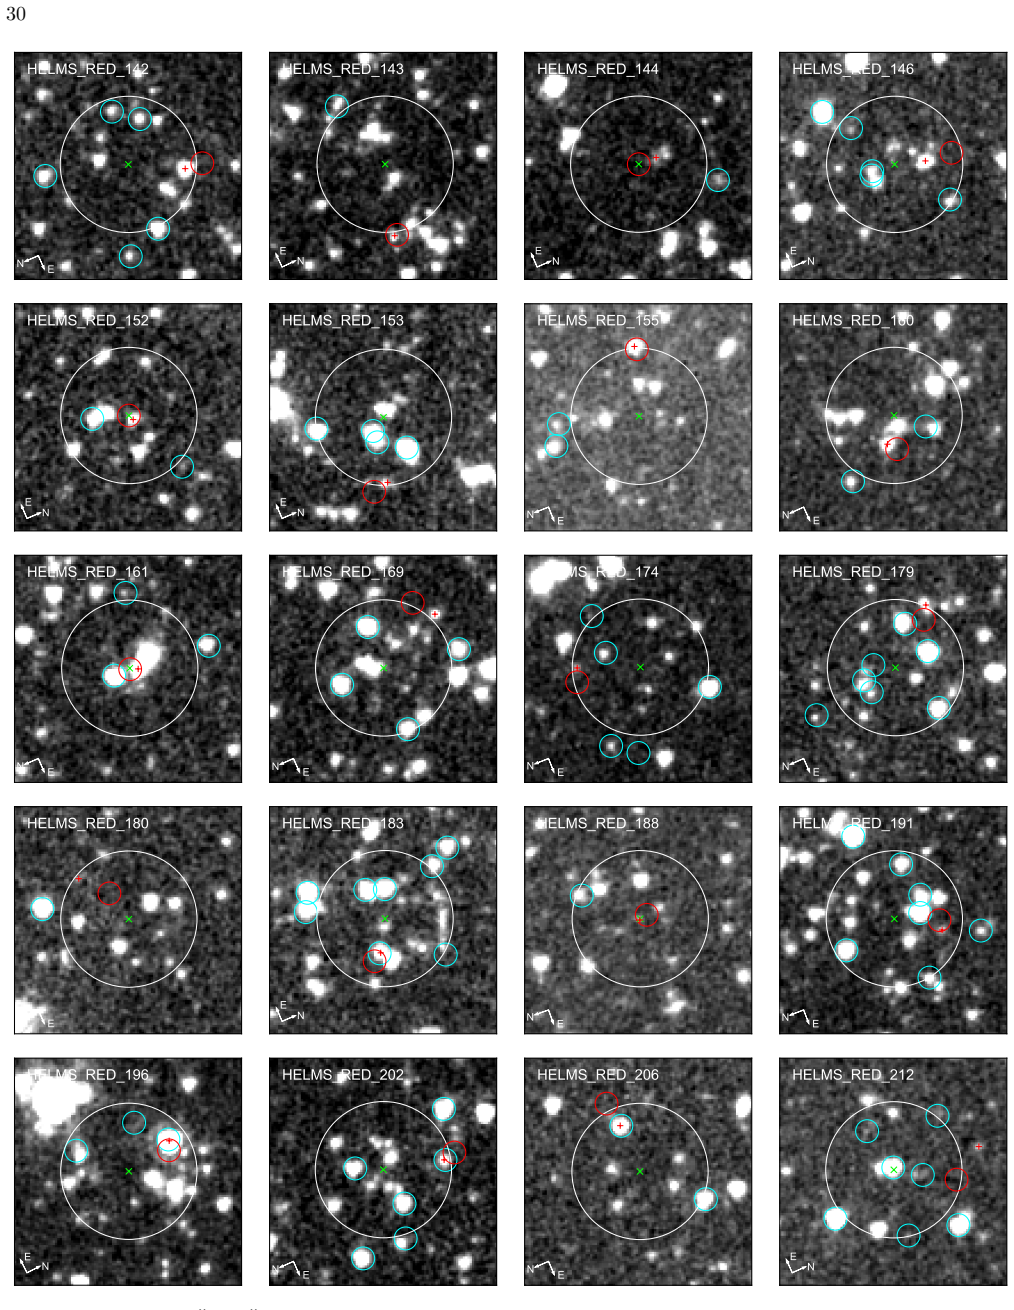
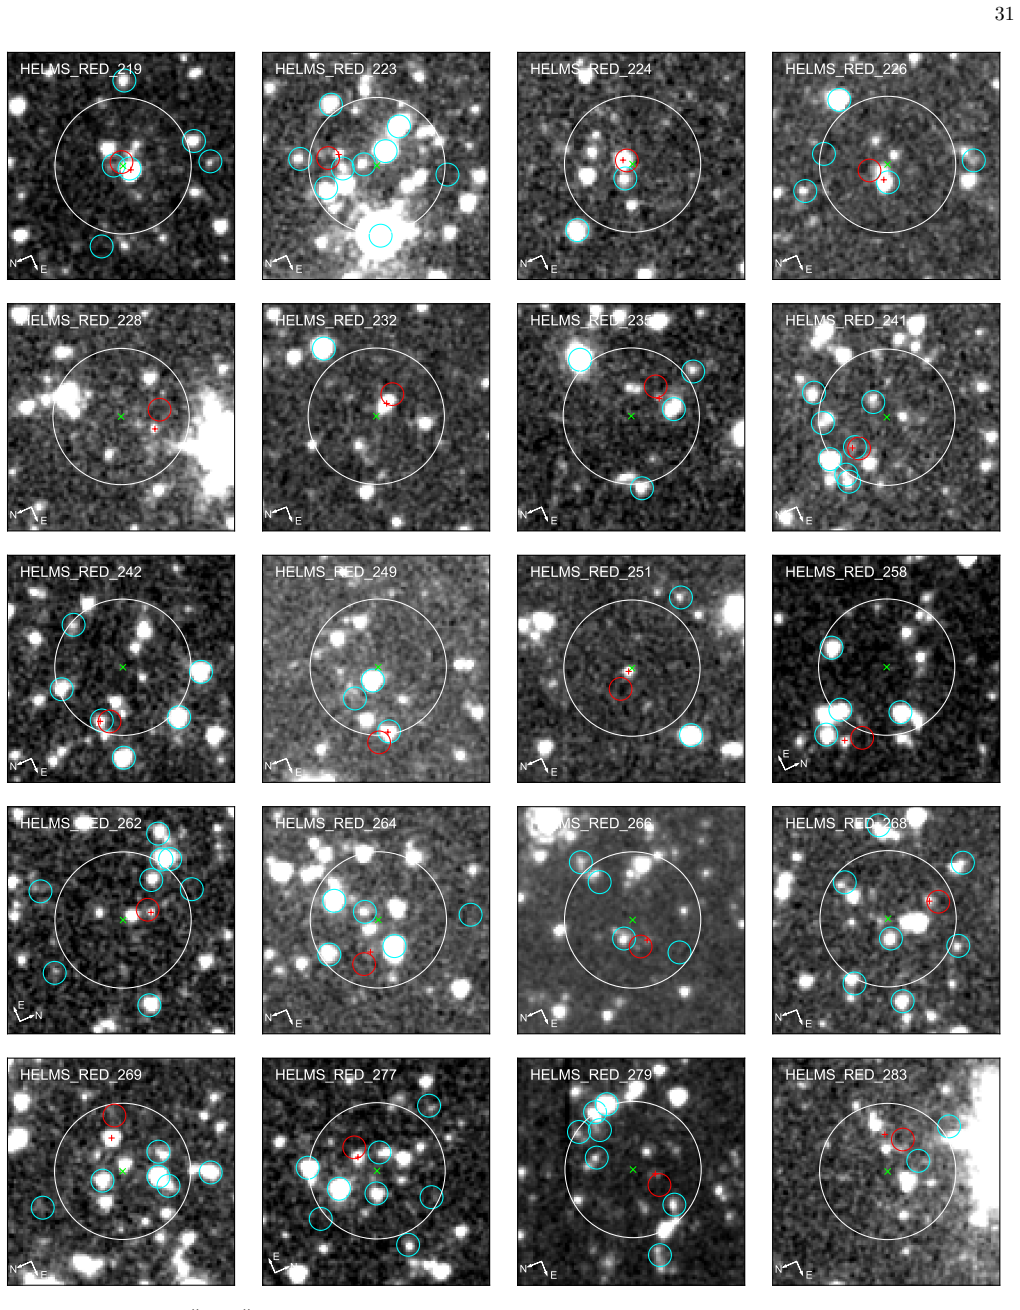
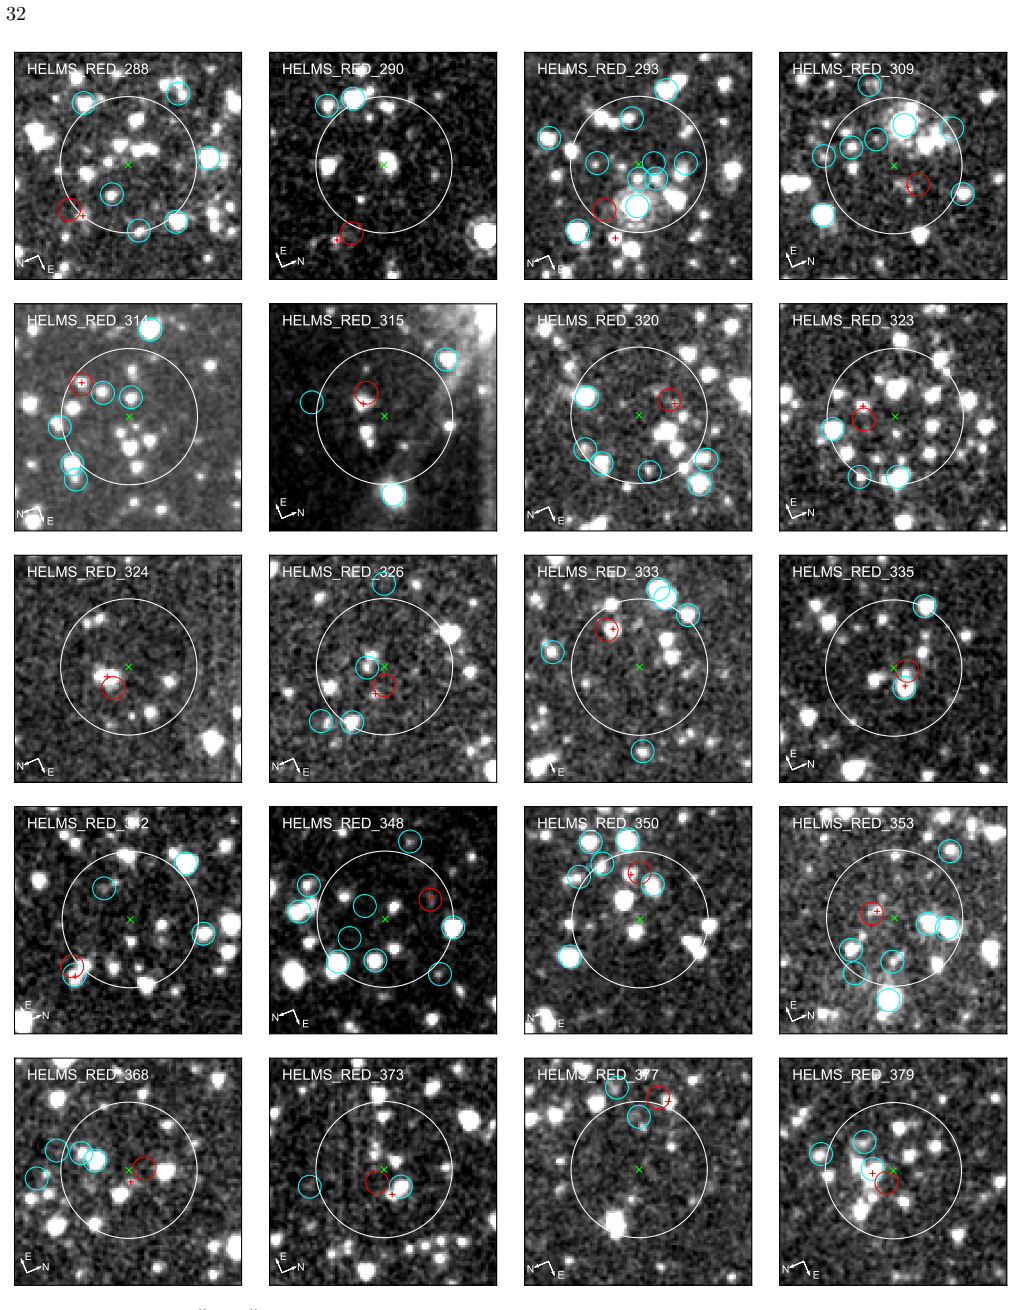
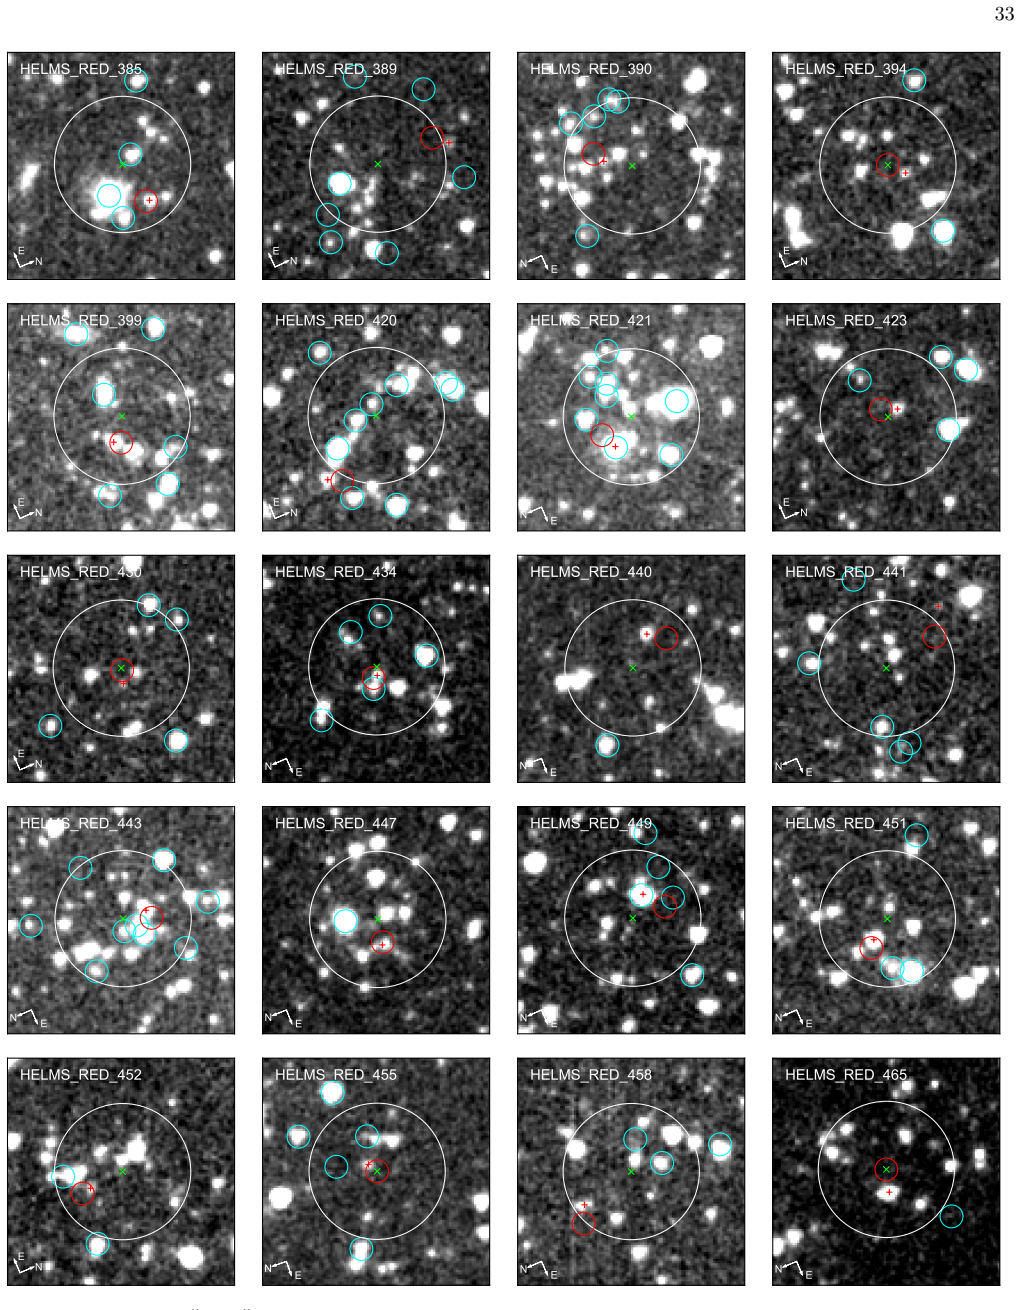
Summary. This paper presents Spitzer/IRAC 3.6 and 4.5 micron observations of 300 Herschel-selected ultrared (500 micron-riser) dusty star-forming galaxies, together with high-resolution ALMA/NOEMA/SMA imaging for 63 of them. The authors use the high-resolution data to identify IRAC counterparts, classify sources as lensed, unlensed, or multiple-component, and de-blend the SPIRE/SCUBA-2 photometry with XID+. They focus on 41 unlensed systems (63 individual components) and run magphys+photo-z SED fitting to derive photometric redshifts, stellar masses, SFRs, dust luminosities, dust temperatures, and extinctions, comparing them with ALESS DSFGs. They then estimate the space density, SFR density, and stellar mass density of the ultrared population and conclude that the Herschel ultrared sample cannot account for the majority of the star-forming progenitors of massive quiescent galaxies at z ~ 3.
Significance. The catalog is a valuable resource: it provides the first large Spitzer/IRAC sample of the rare, luminous 500 micron-riser population, with a clear lensed/unlensed classification from high-resolution interferometry and a consistent SED-fitting framework (same magphys code as the ALESS comparison) that avoids many code-to-code systematics. The paper is also transparent: it explicitly notes the prior-dominated dust temperature, the limited rest-frame UV coverage, and the lack of selection corrections in Section 5.1. The central conclusion about progenitor accounting is, however, contingent on external completeness and duty-cycle corrections that are not quantified in this work.
major comments (3)
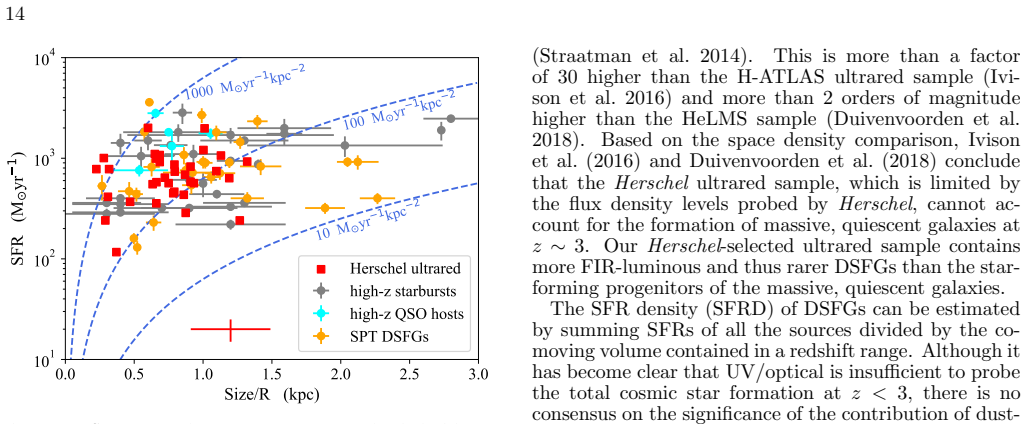
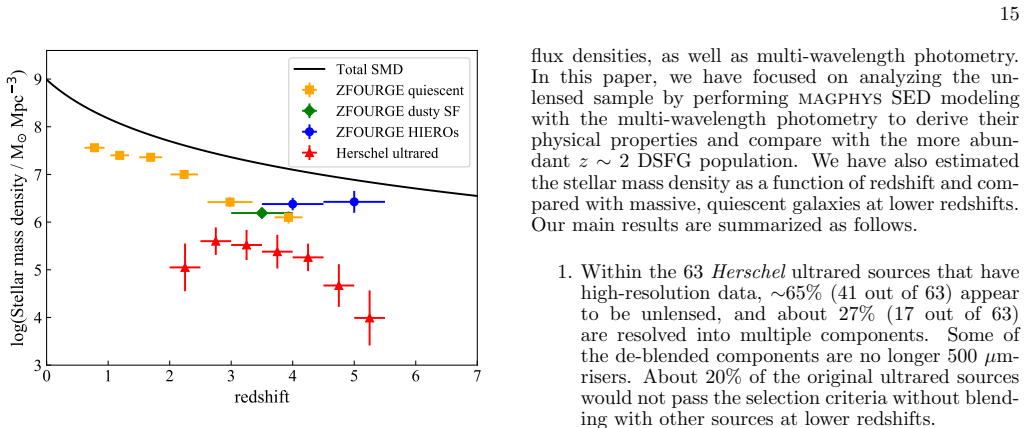
- [Section 5.5] The central conclusion that the ultrared sample 'cannot account for the majority of the star-forming progenitors' rests on the comparison of the H-ATLAS space density of ~6e-7 Mpc^-3 (4<z<6, from Ivison et al. 2016) and the SMD shown in Figure 9 with the ZFOURGE quiescent galaxy density of ~2e-5 Mpc^-3. Both the space density and the SMD are corrected assuming a starburst duty cycle of ~100 Myr. This duty cycle is not measured or justified in the present paper, and it enters the correction linearly: a duty cycle of 10 Myr would increase the corrected space density and SMD by an order of magnitude, reducing the SMD gap from ~100x to ~10x and the space-density gap from >30x to ~3x. The authors should provide a sensitivity analysis over plausible duty cycles (and completeness corrections) and either soften the conclusion or justify the adopted value.
- [Section 5.5 and Section 5.1] The SMD estimate in Figure 9 is built from only 41 unlensed H-ATLAS sources (63 individual components) drawn from the 63 sources with high-resolution data, which in turn are a subset of the 300 Spitzer targets. As stated in Section 5.1, the authors do not attempt to correct for selection effects due to the complicated selection functions. Applying the Ivison et al. (2016) whole-sample completeness and duty-cycle correction to this small, selection-unquantified subsample may introduce a bias that is not addressed. At minimum, the number of sources per redshift bin and the selection function of the high-resolution subsample should be discussed, so the reader can judge the SMD normalization.
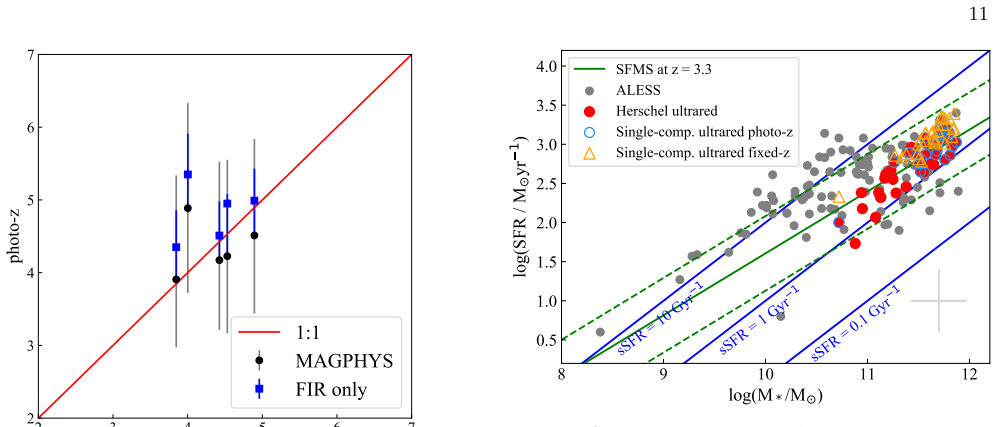
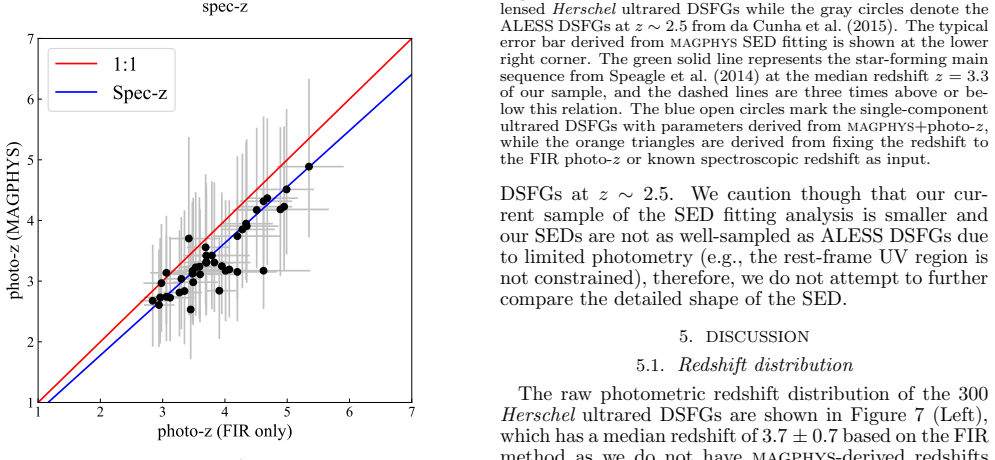
- [Section 4.1 and Figure 3] The validation of magphys+photo-z against spectroscopic redshifts is based on only 5 sources. The mean and median relative offsets differ by ~0.1 between the FIR and magphys methods, but with n=5 the comparison has very low statistical power. Given that the magphys-derived redshifts are systematically lower than the FIR photo-z's (median 3.3 vs 3.7) and the physical property medians (M*, SFR, SMD) all depend on redshift, the paper should either expand the spec-z validation (e.g., by including more published redshifts from Table 3) or explicitly propagate the photo-z systematic uncertainty into the derived medians and SMD.
minor comments (3)
- [Section 5.5 and Figure 9 caption] The acronym is given as 'HIREOs' in the Figure 9 caption and in Section 6, while Section 5.5 uses 'HIEROs'; please standardize the spelling.
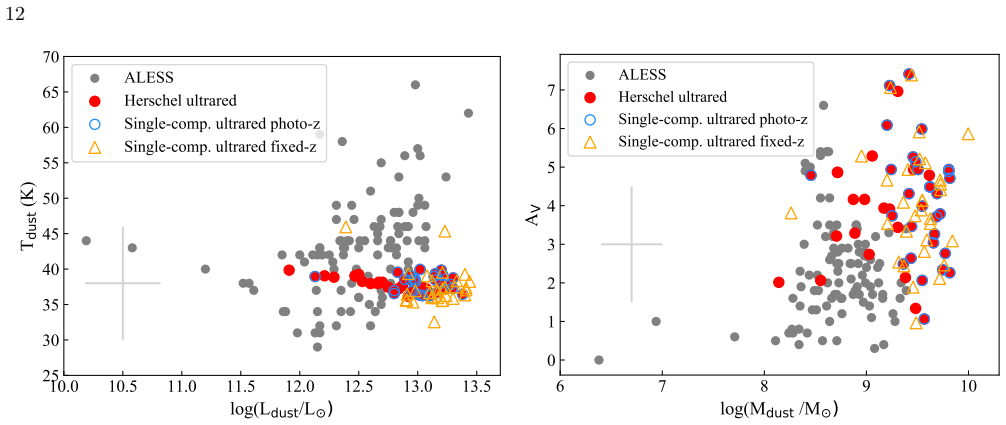
- [Section 4.3] The text reports a median dust temperature of 38 +/- 2 K but immediately acknowledges that Tdust is not constrained by the data and is prior-dominated. Consider removing or clearly flagging this value in the summary of results so it is not read as a measurement.
- [Figure 3 bottom panel] The blue line showing the expected spectroscopic redshift inferred from the median FIR offset is difficult to interpret; adding the 5 spec-z sources with their magphys photo-z points would make the validation and the claimed systematic offset more transparent.
Circularity Check
No significant circularity: the physical-property derivation is self-contained and externally benchmarked, with the duty-cycle correction an explicit input assumption rather than a disguised prediction.
full rationale
The paper does not disguise any fitted parameter as a prediction, and its central physical-property estimates are not defined in terms of the conclusion. The SED fitting uses the externally validated magphys/magphys+photo-z code (da Cunha et al. 2015; Battisti et al. 2019), with a direct photo-z comparison against five spectroscopic redshifts and a consistent re-analysis of ALESS DSFGs with the same code to avoid systematic offsets. The space density, SFR density, and stellar mass density comparisons that drive the 'cannot account for the majority of progenitors' conclusion rely on the H-ATLAS/HeLMS completeness and duty-cycle corrections of Ivison et al. (2016) and Duivenvoorden et al. (2018); these are antecedent observational inputs rather than outputs of this paper. The assumed ~100 Myr starburst duty cycle is explicitly stated in Section 5.5 and scales the corrected densities, so it is a limitation or robustness caveat, but it is not an equation that reduces a prediction to an input. Self-citations supply sample selection, interferometric positions, and photometric redshifts, all of which are external data products; none of these is a definition of the conclusion. No step exhibits the pattern of a fitted parameter renamed as a prediction or a uniqueness theorem imported to force a choice.
Assumptions & free parameters
free parameters (1)
- Starburst duty cycle =
~100 Myr (assumed)
assumptions (7)
- domain assumption Concordance LCDM cosmology with H0 = 70 km/s/Mpc, Omega_m = 0.3, Omega_Lambda = 0.7.
- domain assumption Chabrier (2003) initial mass function.
- domain assumption magphys SED model family (Bruzual & Charlot 2003 stellar populations, delayed-tau SFHs, Charlot & Fall dust attenuation, energy balance).
- domain assumption magphys+photo-z priors do not bias derived redshifts and physical properties for this sample.
- domain assumption SCUBA-2/LABOCA flux can be apportioned among ALMA/NOEMA components using ALMA flux ratios.
- domain assumption Completeness and duty-cycle corrections from Ivison et al. (2016) apply to the unlensed H-ATLAS subsample.
- domain assumption Applying the same SED code to ALESS and ultrared samples removes systematic differences between the two populations.
Cite this review
Pith. "Pith review of Spitzer catalog of Herschel-selected ultrared dusty, star-forming galaxies." pith.science (2026). https://pith.science/paper/JAAPHGP3
@misc{pith2026190808043,
  author       = {Pith},
  title        = {Pith review of: Spitzer catalog of Herschel-selected ultrared dusty, star-forming galaxies},
  year         = {2026},
  howpublished = {\url{https://pith.science/paper/JAAPHGP3}},
  note         = {Machine review of arXiv:1908.08043}
}
abstract
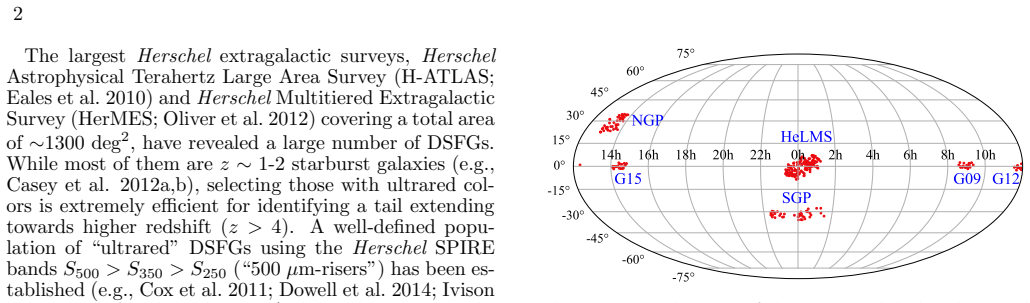
The largest Herschel extragalactic surveys, H-ATLAS and HerMES, have selected a sample of "ultrared" dusty, star-forming galaxies (DSFGs) with rising SPIRE flux densities ($S_{500} > S_{350} > S_{250}$; so-called "500 $\mu$m-risers") as an efficient way for identifying DSFGs at higher redshift ($z > 4$). In this paper, we present a large Spitzer follow-up program of 300 Herschel ultrared DSFGs. We have obtained high-resolution ALMA, NOEMA, and SMA data for 63 of them, which allow us to securely identify the Spitzer/IRAC counterparts and classify them as gravitationally lensed or unlensed. Within the 63 ultrared sources with high-resolution data, $\sim$65% appear to be unlensed, and $\sim$27% are resolved into multiple components. We focus on analyzing the unlensed sample by directly performing multi-wavelength spectral energy distribution (SED) modeling to derive their physical properties and compare with the more numerous $z \sim 2$ DSFG population. The ultrared sample has a median redshift of 3.3, stellar mass of 3.7 $\times$ 10$^{11}$ $M_{\odot}$, star formation rate (SFR) of 730 $M_{\odot}$yr$^{-1}$, total dust luminosity of 9.0 $\times$ 10$^{12}$ $L_{\odot}$, dust mass of 2.8 $\times$ 10$^9$ $M_{\odot}$, and V-band extinction of 4.0, which are all higher than those of the ALESS DSFGs. Based on the space density, SFR density, and stellar mass density estimates, we conclude that our ultrared sample cannot account for the majority of the star-forming progenitors of the massive, quiescent galaxies found in infrared surveys. Our sample contains the rarer, intrinsically most dusty, luminous and massive galaxies in the early universe that will help us understand the physical drivers of extreme star formation.
Figures
Figures from the paper (22 more)

Reference graph
Works this paper leans on
-
[1]
Alam, S., Albareti, F. D., Allende Prieto, C., et al. 2015, ApJS, 219,
work page 2015
-
[12]
2016, MNRAS, 462, 1989 Ashby, M
Asboth, V., Conley, A., Sayers, J., et al. 2016, MNRAS, 462, 1989 Ashby, M. L. N., Stanford, S. A., Brodwin, M., et al. 2013, ApJS, 209, 22 Battisti, A., da Cunha, E., Grasha, K., et al. 2019, ApJ, submitted B´ ethermin, M., De Breuck, C., Sargent, M., et al. 2015, A&A, 576, L9 B´ ethermin, M., Wu, H.-Y., Lagache, G., et al. 2017, A&A, 607, A89 Baugh, C. ...
work page 2016
-
[18]
Narayanan, D., Hayward, C. C., Cox, T. J., et al. 2010, MNRAS, 401, 1613 Nayyeri, H., Mobasher, B., Hemmati, S., et al. 2014, ApJ, 794,
work page 2010
-
[27]
Swinbank, A. M., Simpson, J. M., Smail, I., et al. 2014, MNRAS, 438, 1267 Valiante, E., Smith, M. W. L., Eales, S., et al. 2016, MNRAS, 462, 3146 Vieira, J. D., Crawford, T. M., Switzer, E. R., et al. 2010, ApJ, 719,
work page 2014
-
[30]
E., Rigopoulou, D., Huang, J.-S., et al
Magdis, G. E., Rigopoulou, D., Huang, J.-S., et al. 2010, MNRAS, 401,
work page 2010
-
[34]
Gralla, M. B., Marriage, T. A., Addison, G., et al. 2019, arXiv e-prints , arXiv:1905.04592. Griffin, M. J., Abergel, A., Abreu, A., et al. 2010, A&A, 518, L3 Gruppioni, C., Pozzi, F., Rodighiero, G., et al. 2013, MNRAS, 432, 23 Gruppioni, C., Ciesla, L., Hatziminaoglou, E., et al. 2017, PASA, 34, e055. Hayward, C. C., Jonsson, P., Kereˇ s, D., et al. 2012,...
work page Pith review arXiv 2019
-
[36]
Oteo, I., Ivison, R. J., Negrello, M., et al. 2017, arXiv:1709.04191 Pavesi, R., Riechers, D. A., Sharon, C. E., et al. 2018, ApJ, 861,
work page Pith review arXiv 2017
-
[43]
Pilbratt, G. L., Riedinger, J. R., Passvogel, T., et al. 2010, A&A, 518, L1 Planck Collaboration, Ade, P. A. R., Aghanim, N., et al. 2011, A&A, 536, A7. Planck Collaboration, Ade, P. A. R., Aghanim, N., et al. 2014, A&A, 571, A28. Planck Collaboration, Ade, P. A. R., Aghanim, N., et al. 2016, A&A, 594, A26. Poglitsch, A., Waelkens, C., Geis, N., et al. 20...
work page 2010
Show all 30 references
-
[61]
2013, ApJ, 777,
Muzzin, A., Marchesini, D., Stefanon, M., et al. 2013, ApJ, 777,
2013
-
[66]
G., Franx, M., et al
Leja, J., van Dokkum, P. G., Franx, M., et al. 2015, ApJ, 798, 115 Ma, J., Gonzalez, A. H., Spilker, J. S., et al. 2015, ApJ, 812,
2015
-
[68]
J., Bock, J., Altieri, B., et al
Oliver, S. J., Bock, J., Altieri, B., et al. 2012, MNRAS, 424, 1614 Oteo, I., Ivison, R. J., Dunne, L., et al. 2018, ApJ, 856, 72 Oteo, I., Ivison, R. J., Dunne, L., et al. 2016a, ApJ, 827, 34 Oteo, I., Zwaan, M. A., Ivison, R. J., et al. 2016b, ApJ, 822,
2012
-
[84]
L., Smail, I., Wilson, G
Wardlow, J. L., Smail, I., Wilson, G. W., et al. 2010, MNRAS, 401, 2299 Weinmann, S. M., Neistein, E., & Dekel, A. 2011, MNRAS, 417,
2010
-
[88]
H., Vieira, J
Ma, J., Gonzalez, A. H., Vieira, J. D., et al. 2016, ApJ, 832, 114 Madau, P., & Dickinson, M. 2014, ARA&A, 52,
2016
-
[100]
P., Spilker, J
Marrone, D. P., Spilker, J. S., Hayward, C. C., et al. 2018, Nature, 553, 51 Marsden, D., Gralla, M., Marriage, T. A., et al. 2014, MNRAS, 439,
2018
-
[156]
Danielson, A. L. R., Swinbank, A. M., Smail, I., et al. 2017, ApJ, 840, 78 Davidzon, I., Ilbert, O., Laigle, C., et al. 2017, A&A, 605, A70. De Breuck, C., Williams, R. J., Swinbank, M., et al. 2014, A&A, 565, A59 Diamond-Stanic, A. M., Moustakas, J., Tremonti, C. A., et al. 2...
2017
-
[227]
C., & Hernquist, L
Mihos, J. C., & Hernquist, L. 1996, ApJ, 464,
1996
-
[415]
J., Valiante, E., Cigan, P., et al
Maddox, S. J., Valiante, E., Cigan, P., et al. 2018, ApJS, 236,
2018
-
[492]
M., Crawford, T
Mocanu, L. M., Crawford, T. M., Vieira, J. D., et al. 2013, ApJ, 779,
2013
-
[641]
J., Dunlop, J
Micha lowski, M. J., Dunlop, J. S., Koprowski, M. P., et al. 2017, MNRAS, 469,
2017
-
[763]
D., Marrone, D
Vieira, J. D., Marrone, D. P., Chapman, S. C., et al. 2013, Nature, 495, 344 Walter, F., Decarli, R., Carilli, C., et al. 2012, Nature, 486, 233 Walter, F., Riechers, D., Cox, P., et al. 2009, Nature, 457, 699 Wang, R., Wagg, J., Carilli, C. L., et al. 2013, ApJ, 773, 44 Wang,...
2013
-
[945]
F., Cutri, R
Skrutskie, M. F., Cutri, R. M., Stiening, R., et al. 2006, AJ, 131, 1163 Speagle, J. S., Steinhardt, C. L., Capak, P. L., & Silverman, J. D. 2014, ApJS, 214, 15 Spilker, J. S., Marrone, D. P., Aravena, M., et al. 2016, ApJ, 826, 112 Spilker, J. S., Aravena, M., B´ ethermin, M....
2006
-
[951]
C., Narayanan, D., Kereˇ s, D., et al
Hayward, C. C., Narayanan, D., Kereˇ s, D., et al. 2013, MNRAS, 428, 2529 Hodge, J. A., Karim, A., Smail, I., et al. 2013, ApJ, 768, 91 Holland, W. S., Bintley, D., Chapin, E. L., et al. 2013, MNRAS, 430, 2513 Hopwood, R., Wardlow, J., Cooray, A., et al. 2011, ApJ, 728, L4. Hu...
2013
-
[1016]
R., Straatman, C
Spitler, L. R., Straatman, C. M. S., Labb´ e, I., et al. 2014, ApJ, 787, L36. Stark, D. P., Ellis, R. S., Bunker, A., et al. 2009, ApJ, 697,
2014
-
[1100]
2014, Proc
Sayers, J., Bockstiegel, C., Brugger, S., et al. 2014, Proc. SPIE, 9153, 915304 Scudder, J. M., Oliver, S., Hurley, P. D., et al. 2016, MNRAS, 460, 1119 Simpson, J. M., Smail, I., Swinbank, A. M., et al. 2015, ApJ, 807, 128 Simpson, J. M., Swinbank, A. M., Smail, I., et al. 20...
2014
-
[1360]
B., van Dokkum, P
Brammer, G. B., van Dokkum, P. G., & Coppi, P. 2008, ApJ, 686,
2008
-
[1493]
Straatman, C. M. S., Labb´ e, I., Spitler, L. R., et al. 2014, ApJ, 783, L14. Strandet, M. L., Weiss, A., De Breuck, C., et al. 2017, ApJ, 842, L15 Strandet, M. L., Weiss, A., Vieira, J. D., et al. 2016, ApJ, 822, 80 Su, T., Marriage, T. A., Asboth, V., et al. 2017, MNRAS, 464...
2014
-
[1503]
2003, MNRAS, 344, 1000 Bussmann, R
Bruzual, G., & Charlot, S. 2003, MNRAS, 344, 1000 Bussmann, R. S., P´ erez-Fournon, I., Amber, S., et al. 2013, ApJ, 779, 25 Ca˜ nameras, R., Nesvadba, N. P. H., Guery, D., et al. 2015, A&A, 581, A105. Carlstrom, J. E., Ade, P. A. R., Aird, K. A., et al. 2011, PASP, 123, 568 C...
2003
-
[1521]
E., Daddi, E., Elbaz, D., et al
Magdis, G. E., Daddi, E., Elbaz, D., et al. 2011, ApJ, 740, L15 Magnelli, B., Lutz, D., Santini, P., et al. 2012, A&A, 539, A155 Makovoz, D., Roby, T., Khan, I., & Booth, H. 2006, Proc. SPIE, 6274, 62740C Marriage, T. A., Baptiste Juin, J., Lin, Y.-T., et al. 2011, ApJ, 731,
2011
-
[1556]
Martin, C. L. 2005, ApJ, 621,
2005
-
[2737]
P., et al
Weiß, A., De Breuck, C., Marrone, D. P., et al. 2013, ApJ, 767, 88 Whitaker, K. E., Franx, M., Leja, J., et al. 2014, ApJ, 795, 104 York, D. G., Adelman, J., Anderson, J. E., Jr., et al. 2000, AJ, 120, 1579 Younger, J. D., Fazio, G. G., Wilner, D. J., et al. 2008, ApJ, 688, 59...
2013
Reviewed August 14, 2026 · model on record in the stance chip above.
Discussion (0). Continue with ORCID to comment.