REVIEW 2 major objections 6 minor 21 references
An Email Experiment to Identify the Effect of Racial Discrimination on Access to Lawyers: A Statistical Approach
T0 review · 2 major / 6 minor · reviewed 2026-08-14 · deepseek-v4-flash
Pith's one-line read An email audit with six graded name levels can estimate the full response curve of lawyer bias, not just a black-white gap.
desk verdict A genuine statistical template for graded audit studies, with a known-but-unaddressed measurement error problem in the race levels and a Section 5 inconsistency that should be fixed before publication. read the letter →
The pith
A machine-rendered reading of the paper's core claim, the machinery that carries it, and where it could break.
The reading
What carries the argument
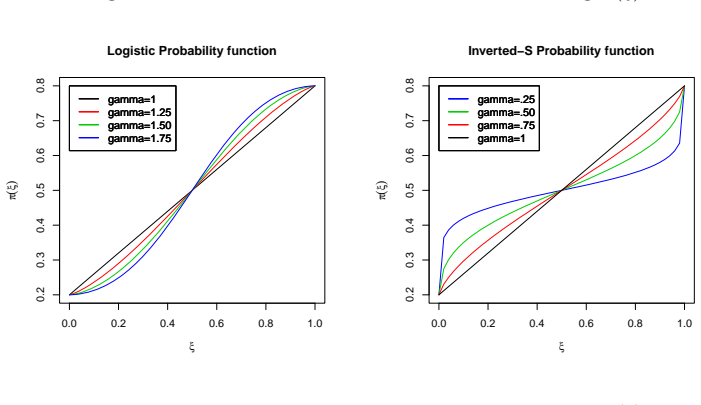
The load-bearing object is the probability-weighting function $g(\gamma,\xi)=\xi^{\gamma}/(\xi^{\gamma}+(1-\xi)^{\gamma})$, taken from the psychology literature on how people weight probabilities. It converts the shape of the race-response curve into a single scalar: $\gamma=1$ recovers a straight line between the boundary rates, $\gamma>1$ produces the steep-midrange curve the paper calls logistic, and $\gamma<1$ produces the extreme-sensitive inverted-S curve. The function enters the likelihood through the reparameterization $\pi(\xi)=(a+g)/(a+b)$ or $(b-g)/(a+b)$, where $a$ and $b$ are deterministic functions of the boundary rates $\alpha$ and $\beta$, and it is the derivative $g'(\gamma,\xi)$ that appears in the score equations and the Fisher information matrix. All of the paper's inference results, including the MLE algorithm, Proposition 1, the delta-method corollaries, and the D-optimality simulations, flow from this single parametric family.
What would settle it
Run the six-level design with a total sample of at least 2000 units in a market where a prior binary-name audit already shows a large black-white response gap, and estimate $\alpha$, $\beta$, and $\gamma$; if the fitted 95% confidence interval for $\alpha-\beta$ still contains zero, the design fails to recover a known effect. Separately, ask the lawyers themselves to rate the six sender names on the same black-white scale used to fix $\xi$; if their average ratings deviate from the assigned levels by more than sampling error, the fixed-$\xi$ assumption is violated.
Extended reading notes
Core claim
On the paper's own terms, the core discovery is that a graded-treatment email audit can be designed and analyzed so that the qualitative question "is lawyer discrimination linear or concentrated at extreme names?" becomes a parameter-estimation problem. Using the odds-ratio function $g(\gamma,\xi)=\xi^{\gamma}/(\xi^{\gamma}+(1-\xi)^{\gamma})$ inside a likelihood for binary responses, the paper shows that the boundary response probabilities $\alpha$ and $\beta$ and the shape parameter $\gamma$ are identifiable, gives their asymptotic normal approximation, and derives a delta-method covariance for $\alpha$ and $\beta$ and a prediction variance for $\pi(\xi)$ at any new level. Design simulations then show that six equally spaced levels of $\xi$ keep the determinant of the Fisher information high over a wide grid of $(\alpha,\beta,\gamma)$, making the design a near-optimal default. The pilot application, using 899 lawyers, six names per gender, and blocking on lawyer race, gender, and practice area, yields point estimates $\hat{\alpha}=0.3687$, $\hat{\beta}=0.2118$, and $\hat{\gamma}=0.688$, with a 95% confidence interval for $\beta-\alpha$ that contains zero, so the pilot cannot reject a null treatment effect but does demonstrate the intended analysis.
Load-bearing premise
The load-bearing premise, flagged by the authors themselves, is that the race level $\xi$ assigned to each sender name, meaning the proportion of a survey panel who read the name as black, is an exact and noise-free constant describing how lawyers perceive that name; if lawyers' perceptions differ systematically, every estimated response curve, standard error, and design choice is miscalibrated.
Editorial extensions
If this is right
- The distinction between linear and nonlinear discrimination becomes a Wald test of $\gamma=1$, so an adequately powered audit can say whether bias is a smooth gradient or switches on only for very distinctive names.
- With six equally spaced levels and equal allocation, the design is near-D-optimal across a wide grid of $\alpha$, $\beta$, and $\gamma$, meaning future audits can adopt it without running bespoke optimal-design calculations for each new market.
- The iterative MLE and asymptotic standard errors apply to any binary-outcome correspondence audit with a continuous treatment, so the method generalizes beyond legal services to rental, employment, and other service-provision contexts.
- Power simulations show that resolving shape requires large samples, with $\gamma$ far from 1 and large $|\beta-\alpha|$ most favorable; the 899-lawyer pilot is underpowered for small effects, and its non-significant result should not be read as evidence against discrimination.
- The design is presented as ready for use where discrimination has already been established; in undiagnosed markets, the sample sizes needed for shape inference are prohibitive.
Reading between the lines
- Editorial inference: the same shape parameter $\gamma$ could be exported to other continuous signals, such as accent strength, neighborhood cues, or credit-score proxies, so that a single number characterizes whether any service market discriminates in a threshold or gradient fashion; this is a direct generalization the paper does not spell out.
- Editorial inference: the fixed-$\xi$ assumption could be tested by collecting race ratings of the actual sender names from a sample of the same profession being audited; if lawyer ratings differ systematically from the survey panel's proportions, the model would need a measurement-error layer for $\xi$, which the authors flag as future work.
- Editorial inference: an adaptive design, with a first wave to localize the response curve and a second wave concentrating treatment levels there, could recover shape information at lower total sample cost than the fixed equally spaced design, an extension suggested by the paper's own power constraints.
- Editorial inference: the pilot's wide confidence interval, combined with the paper's power analysis, implies that conclusions of "no discrimination" from small correspondence audits should be treated cautiously; failure to reject could simply reflect sample size rather than the absence of bias.
Signed reviews
Editorial analysis
A structured set of objections, weighed in public.
Referee Report
Summary. The paper develops a design-of-experiments and maximum-likelihood framework for email audit studies that measure racial discrimination in access to lawyers using more than two race-signal levels. It defines a race level ξ∈(0,1) as the probability that a receiver identifies a sender's name as black, models the response probability π(ξ) with a parametric family (2)-(5) indexed by boundary probabilities α, β and shape parameter γ, and derives an iterative MLE, the asymptotic normal distribution of the estimator (Proposition 1), and delta-method covariance results for α, β and predictions (Corollaries 1-2). The design section uses D-optimality simulations over k levels to recommend six equally spaced treatment levels, describes name selection using Florida voter-file data and MTurk perception surveys, and presents a blocked randomization of 899 Florida lawyers. The empirical analysis finds no statistically significant treatment effect, and the authors are explicit that resource constraints prevented a definitive test. The paper closes by acknowledging that the treatment level is assumed known without noise.
Significance. If the statistical claims hold, the paper makes a useful methodological contribution to correspondence audit design: it replaces the common binary black/white name manipulation with a multi-level perceived-race treatment and provides a coherent likelihood-based estimation and power-analysis workflow. The derivations are standard but carefully executed, the design simulations are honest about the large sample sizes required, and the paper explicitly flags the fixed-ξ assumption and the pilot nature of the empirical application. The main value is as a template for planning multi-level audit experiments rather than as a source of substantive estimates, since the Florida pilot lacks power.
major comments (2)
- [Section 3 (Eqs. (6), (10)), Section 4.2, Section 6] The inference and design results treat each ξ_i as a fixed, exactly known treatment level, but in the implemented experiment ξ_i is not controlled; it is a point estimate (an MTurk proportion or an objective Bayes probability) of the perception probability for a selected name. Measurement error in a nonlinear covariate generally biases the MLE of (α, β, γ) and makes the plug-in covariance matrix from Proposition 1 inconsistent, so the nominal 95% intervals and the power curves in Appendix B are not calibrated to the actual randomized treatment. The acknowledgment in Section 6 ("we have assumed that the input level ξ is a constant and can be chosen without noise") states the problem but does not quantify its effect on the central claims. I ask the authors to add a sensitivity analysis (e.g., simulation under plausible true ξ values and MTurk sample sizes) or an errors-in-variables formulation, and to state explicitly which ξ values (objective, subjective, or a combination) were used in the Section 5 analysis.
- [Section 5 and Table 2] The text says the preliminary proportions showed a lower response at the lowest race level (very likely black) than at the highest (very likely white), and that the model was therefore fit under α<β; however, all three rows of Table 2 report α̂>β̂, which is the decreasing-branch case, and the reported intervals are centered at α̂−β̂ rather than β̂−α̂ (e.g., overall midpoint 0.1569 equals 0.3687−0.2118). The heading "95% CI for ˆβ−ˆα" is therefore inconsistent with the entries, and the description of which model branch was fitted is internally contradictory. This must be corrected and reconciled because it determines the sign convention for the estimated response curve and the interpretation of the confidence interval for the treatment effect.
minor comments (6)
- [Section 3, Algorithm Step 7] The equation for updating b is said to be solved "for a"; it should be solved for b.
- [Section 4.1] In "det(IN(θ) = ∑Ni=1 Ii(θ))" a closing parenthesis is missing, and the cross-reference to "Ii(θ) is given by (1)" should point to Eq. (10), not Eq. (1).
- [Figure 5] The y-axis label "Estimated subjective probability" does not say whether the probability is of identifying the name as black or as white; since ξ is defined as black-identification probability, this needs to be stated.
- [Appendix B, Figure 7 caption] The clause "when there is a large treatment effect (α−β = 0.6, the asymptotic intervals..." is missing a closing parenthesis.
- [References] The Wald (1943) entry ("Transactions of the American Mathematical Society. Health Educ. Res. 54, 426–482") and the Pager et al. (2006) entry (whose title appears to belong to a different paper) need to be corrected.
- [Sections 1 and 4.2] Minor typographical errors include "adu it studies" in Section 1 and "nave Bayesian" in Section 4.2.
Circularity Check
No significant circularity: the likelihood inference and design simulations are self-contained under an explicitly assumed parametric model; the only self-citation is contextual and the fixed-ξ caveat is an acknowledged measurement-error limitation, not a circular reduction.
full rationale
The paper's derivation chain is not circular. Section 3 develops standard maximum-likelihood inference for independent Bernoulli outcomes under the explicitly assumed response family (2)-(5); the asymptotic results (Proposition 1, Corollaries 1 and 2) follow from textbook likelihood theory and the delta method, not from the experimental data. The functional form of g(γ, ξ) is imported from the probability-weighting literature (Goldstein and Einhorn 1987; Gonzalez and Wu 1997), and the parameters α, β, γ are free unknowns estimated from data, so the model is not defined in terms of the quantities it is used to infer. The design recommendation k = 6 in Section 4.1 is obtained by evaluating the D-optimality criterion across a grid of assumed true parameters and is explicitly framed as a robustness check under the model family, not as an out-of-sample prediction. Section 5's fitted response curve is a standard plug-in prediction from the estimated model, not a separate empirical claim. The only self-citation, Libgober (2020), is used as background evidence that market conditions may violate blocking assumptions; it does not carry the statistical derivation. The acknowledged fixed-ξ assumption in Section 6 is a measurement-error and identification limitation, not a case of a result reducing to its own input. Accordingly, no circular step is present.
Assumptions & free parameters
free parameters (4)
- α (boundary response probability at ξ→0+) =
0.3687 (overall fit, Table 2)
- β (boundary response probability at ξ→1−) =
0.2118 (overall fit, Table 2)
- γ (shape parameter) =
0.688 (overall fit, Table 2)
- Number of treatment levels k =
6
assumptions (5)
- domain assumption The response function π(ξ) is monotone in ξ and belongs to the parametric family defined in Eqs. (2)-(5).
- domain assumption The race level ξ of each sender name is a known constant, equal to the measured subjective probability of being identified as black.
- domain assumption First and last names combine independently in the naive Bayes calculation of race level (Eq. 12).
- domain assumption Responses Y_i are independent Bernoulli given ξ_i.
- standard math Standard asymptotic MLE regularity conditions hold so that Proposition 1 applies.
Cite this review
Pith. "Pith review of An Email Experiment to Identify the Effect of Racial Discrimination on Access to Lawyers: A Statistical Approach." pith.science (2026). https://pith.science/paper/H24D2NMO
@misc{pith2026190808116,
  author       = {Pith},
  title        = {Pith review of: An Email Experiment to Identify the Effect of Racial Discrimination on Access to Lawyers: A Statistical Approach},
  year         = {2026},
  howpublished = {\url{https://pith.science/paper/H24D2NMO}},
  note         = {Machine review of arXiv:1908.08116}
}
read the original abstract
We consider the problem of conducting an experiment to study the prevalence of racial bias against individuals seeking legal assistance, in particular whether lawyers use clues about a potential client's race in deciding whether to reply to e-mail requests for representations. The problem of discriminating between potential linear and non-linear effects of a racial signal is formulated as a statistical inference problem, whose objective is to infer a parameter determining the shape of a specific function. Various complexities associated with the design and analysis of this experiment are handled by applying a novel combination of rigorous, semi-rigorous and rudimentary statistical techniques. The actual experiment was attempted with a population of lawyers in Florida, but could not be performed with the desired sample size due to resource limitations. Nonetheless, it provides a nice demonstration of the proposed steps involved in conducting such a study.
Figures


Figures from the paper (1 more)

Reference graph
Works this paper leans on
-
[1]
Atkinson, A., A. Donev, and R. Tobias (2007). Optimum Experimental Designs, With SAS . Oxford: Oxford University Press
work page 2007
-
[2]
Bertrand, M. and E. Duflo (2017). Field Experiments on Discrimination . North Holland
work page 2017
-
[3]
Bertrand, M. and S. Mullainathan (2004). Are emily and greg more employable than lakisha and jamal? a field experiment on labor market discrimination. The American Economic Review 94 , 991–1013
work page 2004
-
[4]
Boos, D. and L. Stefanski (2013). Essential Statistical Inference . New York: Springer
work page 2013
-
[5]
Butler, D. M. and D. Broockman (2011). Do politicians racially discriminate against constituents? a field experiment on state legislators. American Journal of Political Science 55 , 463–477
work page 2011
-
[6]
Carlsson, M. and D. O. Rooth (2007). Evidence of ethnic discrimination in the swedish labor market using experimental data. Labour Economics 14 , 716–729. 23
work page 2007
-
[7]
Carpusor, A. G. and W. E. Loges (2006). Rental discrimination and ethnicity in names. Journal of Applied Social Psychology 36 , 934–952
work page 2006
-
[8]
Chaloner, K. and I. Verdinelli (1995). Bayesian experimental design: A review. Statistical Sci- ence 10 , 273–304
work page 1995
Show all 21 references
-
[9]
Chaudhuri, P. and P. A. Mykland (1993). Nonlinear experiments: Optimal design and inference based on likelihood. Journal of the American Statistical Association 88 , 538–546. Chernoff, H. (1953). Locally optimal designs for estimating parameters. Annals of Mathematical Statisti...
1993
-
[10]
Fryer, R. G. J. and S. D. Levitt (2004). The causes and consequences of distinctively black names. The Quarterly Journal of Economics CXIX , 767–805
2004
-
[11]
Gaddis, S. M. (2018). Audit Studies: Behind the Scenes with Theory, Method, and Nuance . Cham: Springer International Publishing
2018
-
[12]
Goldstein, W. M. and H. J. Einhorn (1987). Expression theory and the preference reversal phe- nomena. Psychological Review 94 , 236–254
1987
-
[13]
Gonzalez, R. and G. Wu (1997). On the shape of the probability weighting function. Cognitive Psychology 38 , 129–166
1997
-
[14]
Heckman, J. J. (1998). Detecting discrimination. Journal of Economic Perspectives 12 , 101–116
1998
-
[15]
Libgober, B. (2020). Getting a lawyer while black: A field experiment. Lewis & Clark L. Rev. 24 , 53–108
2020
-
[16]
Milkman, K. L., M. Akinola, and D. Chugh (2015). What happens before? a field experiment exploring how pay and representation differentially shape bias on the pathway into organizations. Journal of Applied Psychology 100 , 1678–1712. 24
2015
-
[17]
Western, and B
Pager, D., B. Western, and B. Bonokowski (2006). Targeting, universalism, and single-mother poverty: A multilevel analysis across 18 affluent democracies. Demography 49, 719–746
2006
-
[18]
Pager, O
Quillian, L., D. Pager, O. Hexel, and A. H. Midtbøen (2017). Meta-analysis of field experiments shows no change in racial discrimination in hiring over time.Proceedings of the National Academy of Sciences 114 (41), 201706255
2017
-
[19]
Wald, A. (1943). Transactions of the american mathematical society.Health Educ. Res. 54, 426–482
1943
-
[20]
White, A. R., N. L. Nathan, and J. K. Faller (2015). What do i need to vote? bureaucratic discretion and discrimination by local election officials. American Political Science Review 109 , 129–142
2015
-
[21]
Dasgupta, and Q
Zhu, L., T. Dasgupta, and Q. Huang (2014). A d-optimal design for estimation of parameters of an exponential-linear growth curve of nanostructures. Technometrics 56, 432–442. 25
2014
Reviewed August 14, 2026 · model on record in the stance chip above.
Discussion (0). Continue with ORCID to comment.