REVIEW 3 major objections 5 minor 52 references
Sentiment Dynamics in Social Media News Channels
T0 review · 3 major / 5 minor · reviewed 2026-08-14 · deepseek-v4-flash
Pith's one-line read The sentiment of Facebook users' comments tracks the sentiment of the news post and the channel's medium.
desk verdict A useful data-driven paper with a solid comment–post sentiment correlation finding, but the medium-level claim is overreached by a design with five channels. read the letter →
The pith
A machine-rendered reading of the paper's core claim, the machinery that carries it, and where it could break.
The reading
What carries the argument
The analysis is carried by a dataset of 0.15 million Facebook news posts and 1.13 billion reactions from five news pages, combined with VADER, a lexicon-and-rule sentiment scorer specialised for social-media text, which assigns each post and comment a polarity score rescaled to an integer from -5 to +5. Posts are grouped into topics by a probabilistic topic model (latent Dirichlet allocation), and the paper's main quantitative evidence is the per-channel correlation between post polarity and average comment polarity. This machinery turns raw engagement counts into comparable sentiment signals and makes the post-to-comment emotional coupling measurable.
What would settle it
Re-run the analysis on a much larger panel with many outlets per medium and varied editorial stances. If the correlation between post sentiment and comment sentiment is no stronger within a medium than across media, or if two television pages with opposite editorial slants produce opposite comment reactions, the claim that the medium itself shapes user opinion fails.
Extended reading notes
Core claim
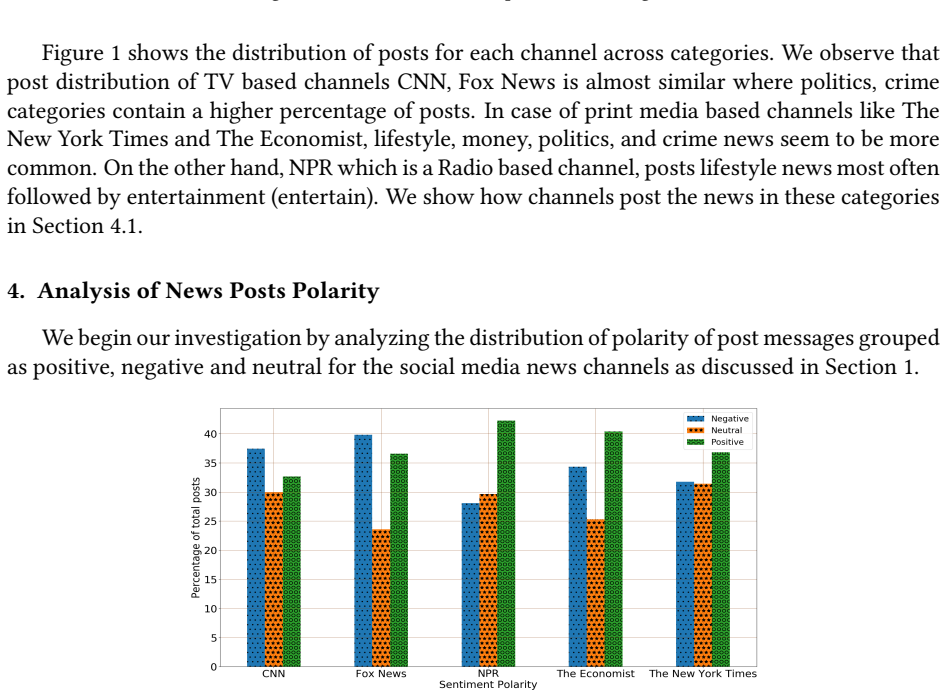
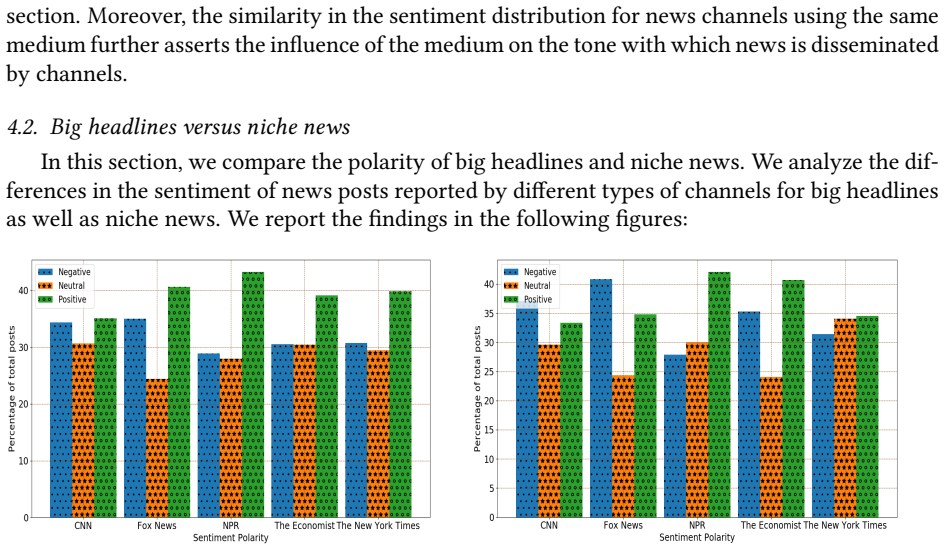
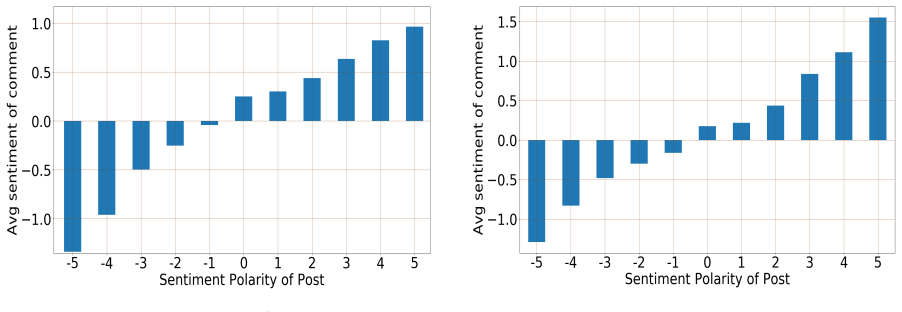
The paper's central discovery is a strong coupling between the emotional tone of a news post and the emotional tone of the reactions it receives, mediated by the traditional medium of the news source. On the five Facebook pages studied, television news pages are dominated by negative posts, print and radio pages by positive posts, and the same event can be reported with opposite polarity by different types of channels. Average comment sentiment rises and falls with post sentiment for every channel, with correlations from 0.93 for the radio page to 0.98 for one television page. The paper reads this as evidence that users react not only to the news event but to the channel's standing tone: television pages, which mostly post negative news, attract negative comments even for less negative posts, while a public radio page that mostly posts positive news keeps positive average comments regardless of the post's polarity.
Load-bearing premise
The load-bearing assumption is that five outlets can stand in for their media types: with one radio page and two each for television and print, the radio-versus-TV differences could be the editorial style of the chosen pages rather than a property of the medium itself.
Editorial extensions
If this is right
- News pages can anticipate the average mood of their comment section from a post's sentiment score before the post is published.
- Comment-based opinion mining should adjust for source type; otherwise the dominant tone of a channel leaks into the aggregated public opinion it claims to measure.
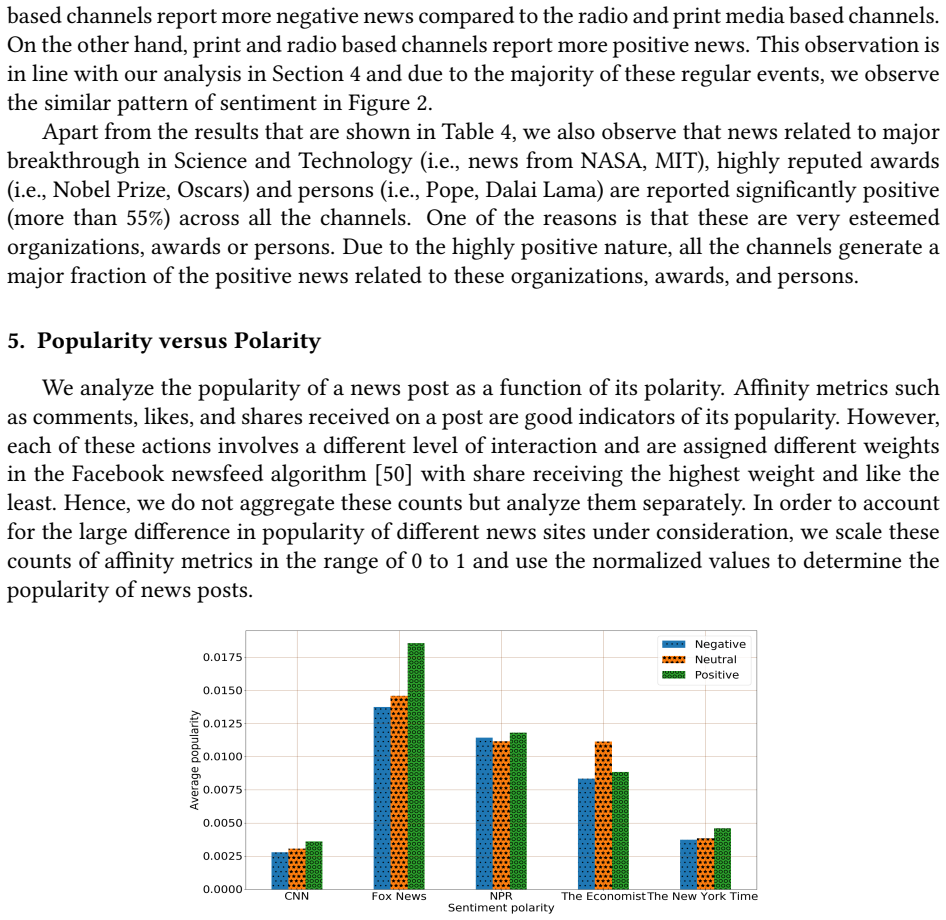
- The negativity bias needs to be stated at the level of the action: negative posts win comments and shares, positive posts win likes.
- Because TV pages skew negative and print/radio pages skew positive, studies comparing audience reactions across media must control for the story, not just the channel, before attributing differences to the medium.
- The polarity threshold at which comments turn negative is source-specific, so a single global post-sentiment threshold cannot predict reaction tone across all channels.
Reading between the lines
- The medium-level conclusion is entangled with channel identity in the sample: one radio outlet and two each of TV and print leave open the alternative that editorial brand, not the medium, drives the pattern.
- The high post–comment correlations may partly reflect commenters quoting or echoing the post's own emotional wording; a follow-up that removes lexical overlap between post and comment text would reveal how much independent opinion remains.
- The same-event comparisons hint at a controlled field experiment: post the same factual story with opposite emotional frames on matched pages and measure comment sentiment, which would test the paper's tone-causes-reaction reading against event-driven explanations.
- If the coupling holds, a practical extension is an early-warning signal for comment-section toxicity: post tone plus channel tone could flag threads likely to turn negative before many comments arrive.
Signed reviews
Editorial analysis
A structured set of objections, weighed in public.
Referee Report
Summary. The paper examines sentiment in Facebook posts and comments from five news channels (CNN, Fox News, The Economist, NYT, NPR), grouped as television, print, and radio sources. Using VADER for sentiment scoring, LDA topic modeling with manual precision evaluation, and a dataset of 0.15 million posts and 1.13 billion reactions, it reports that TV-based channels post predominantly negative content while print- and radio-based channels post predominantly positive content; that positive and negative posts receive more engagement than neutral ones, with negative posts receiving more comments and shares and positive posts more likes; and that average comment sentiment correlates strongly with post sentiment (0.93-0.98), with channel-level differences. The paper concludes that user opinion sentiment depends on post sentiment and on the type of information source, and it suggests these findings can correct biases when aggregating comments for opinion mining.
Significance. If the findings were generalizable, the paper would provide a useful descriptive account of sentiment dynamics in social media news and practical guidance for opinion-aggregation bias correction. The study's strengths include its unusually large dataset, the use of an externally validated sentiment tool (VADER), manual validation of topic labels (80.3% precision), and a transparent description of the data collection. However, the central claim about the role of the information-source medium is underidentified by the five-channel design, and the correlation analysis lacks the statistical detail needed to support the strong quantitative claims. The qualitative direction of the findings is plausible, but the current support does not yet justify the abstract's general statement about television, radio, and print media.
major comments (3)
- [Section 4 and Section 4.3 (Figure 2, Table 4)] The claim that post sentiment depends on the type of information source (TV, print, radio) is not identified by the design. The three medium groups contain two (CNN, Fox News), two (The Economist, NYT), and one (NPR) channels, so medium is perfectly confounded with channel identity, editorial policy, and audience. The 150k posts do not increase the effective sample size for the medium-level inference because posts within a channel are correlated; the effective replication count is five. A channel-level analysis or additional outlets per medium is required before the abstract's 'type of information source' claim can be supported. This comment is load-bearing because the medium-type conclusion appears throughout the paper and is repeated in the abstract and conclusion.
- [Section 6, Table 5] The reported correlations between post sentiment and average comment sentiment (0.93-0.98) lack confidence intervals, and the 'p-test' description is insufficient. Because the unit is the post-level average of comment sentiment, within-post comment variance is smoothed away, which can mechanically raise the correlation relative to a comment-level analysis. In addition, post text and comments are scored with the same VADER lexicon, so shared measurement error is a potential source of common signal. The authors should report comment-level or bootstrap/unit-level estimates, provide scatter plots or residual diagnostics, and clarify what exactly was tested with the cited p-value procedure.
- [Section 5, Figures 8-10] The popularity-versus-polarity claim (negative posts receive more comments and shares, positive posts more likes) is based on visual comparison of normalized counts without statistical tests or uncertainty estimates. Since the paper contrasts this result with the negativity-bias literature, a regression or bootstrap test with post-level controls (e.g., channel, topic, time) is needed to rule out confounds such as channel-specific posting frequency and topic mix. Without such tests, the claim that the negativity bias operates differently across engagement types is not quantitatively supported.
minor comments (5)
- [Table 2] The time-interval column is written as 'Dec 2016-April 2012' for CNN, which reverses chronological order; please use a consistent format such as 'April 2012 - Dec 2016' for all channels.
- [Section 7] The text says 'Figures 18-17' when referring to Figure 16 and 17; the figure cross-references need to be corrected.
- [Section 3.2] The conversion of VADER scores from the -1 to +1 range to integers between -5 and +5 is described, but the rounding or binning procedure is not specified; please state it explicitly.
- [Section 6] The phrase 'p-test' should be 'p-value' or 'significance test'; reference [52] is a cautionary note about p-values, which makes the citation choice puzzling unless the authors intend a specific testing framework.
- [Throughout] There are several grammatical slips, such as 'news related to health and world easily catch the attention of the channels' in Section 4.1, where 'news' appears to mean 'news items' and the sentence structure is awkward; a careful proofreading pass is needed.
Circularity Check
No circularity: the paper reports measured correlations and distributions using an externally validated sentiment tool, with no fitted parameter or self-citation chain reproducing the central claim.
full rationale
This is an empirical measurement and characterization paper, not a derivation. The central claims are that (i) post sentiment differs across the five channels, (ii) negative posts receive more comments and shares while positive posts receive more likes, and (iii) post sentiment correlates strongly with average comment sentiment. Each of these is reported as a directly measured quantity: post and comment sentiment are scored with VADER, an externally validated lexicon and rule-based tool cited to Hutto and Gilbert [34], and the correlation coefficients in Table 5 are ordinary Pearson correlations accompanied by a standard p-test. No parameter is fitted to the data and then renamed as a prediction: the abstract's phrase 'strongly correlates' is a summary of the observed correlation coefficients (0.93–0.98), not a forecast generated from those coefficients. The topic categorization uses LDA with manually validated precision, but the sentiment-polarity conclusions do not depend on any quantity that was defined in terms of those conclusions. There is no load-bearing self-citation: the reference list contains no works by the present authors, and no uniqueness theorem or prior author-derived ansatz is invoked to force the channel grouping. The reader-identified concern that 'type of information source' is confounded with channel identity (two TV outlets, two print outlets, one radio outlet) is a real threat to the generality of the medium-level inference, but confounding is a validity and external-validity problem, not a circularity problem: the paper's reported numbers would still be the same numbers even if the medium-level conclusion were false. Under the stated rules, a non-finding is appropriate, so the circularity score is 0.
Assumptions & free parameters
free parameters (1)
- LDA hyperparameters alpha, beta =
not reported
assumptions (4)
- domain assumption VADER accurately measures sentiment in Facebook news posts and user comments
- domain assumption The five selected channels are representative of their media types
- domain assumption Facebook reaction counts (likes, shares, comments) are valid measures of user engagement
- domain assumption The common time frame December 2014 to December 2016 is representative
Cite this review
Pith. "Pith review of Sentiment Dynamics in Social Media News Channels." pith.science (2026). https://pith.science/paper/6GAVRHRX
@misc{pith2026190808147,
  author       = {Pith},
  title        = {Pith review of: Sentiment Dynamics in Social Media News Channels},
  year         = {2026},
  howpublished = {\url{https://pith.science/paper/6GAVRHRX}},
  note         = {Machine review of arXiv:1908.08147}
}
read the original abstract
Social media is currently one of the most important means of news communication. Since people are consuming a large fraction of their daily news through social media, most of the traditional news channels are using social media to catch the attention of users. Each news channel has its own strategies to attract more users. In this paper, we analyze how the news channels use sentiment to garner users' attention in social media. We compare the sentiment of social media news posts of television, radio and print media, to show the differences in the ways these channels cover the news. We also analyze users' reactions and opinion sentiment on news posts with different sentiments. We perform our experiments on a dataset extracted from Facebook Pages of five popular news channels. Our dataset contains 0.15 million news posts and 1.13 billion users reactions. The results of our experiments show that the sentiment of user opinion has a strong correlation with the sentiment of the news post and the type of information source. Our study also illustrates the differences among the social media news channels of different types of news sources.
Figures


Figures from the paper (9 more)




Reference graph
Works this paper leans on
-
[23]
J. C. S. dos Rieis, F. B. de Souza, P. O. S. V. de Melo, R. O. Prates, H. Kwak, J. An, Breaking the news: First impressions matter on online news, in: Ninth International AAAI Conference on Web and Social Media, 2015
work page 2015
-
[52]
T. Dahiru, P-value, a true test of statistical signi/f_icance? a cautionary note, Annals of Ibadan postgraduate medicine 6 (1) (2008) 21–26. 21
work page 2008
-
[1]
U. K. Ecker, S. Lewandowsky, E. P. Chang, R. Pillai, The effects of subtle misinformation in news headlines., Journal of experimental psychology: applied 20 (4) (2014) 323
work page 2014
- [2]
-
[3]
J. Gottfried, E. Shearer, News use across social media platforms 2016, Pew Research Center 26
work page 2016
- [4]
-
[5]
E. Cambria, B. Schuller, Y. Xia, C. Havasi, New avenues in opinion mining and sentiment analysis, IEEE Intel- ligent Systems 28 (2) (2013) 15–21
work page 2013
-
[6]
G. Vinodhini, R. Chandrasekaran, Sentiment analysis and opinion mining: a survey, International Journal 2 (6) (2012) 282–292
work page 2012
Show all 52 references
-
[7]
Bautin, L
M. Bautin, L. Vijayarenu, S. Skiena, International sentiment analysis for news and blogs., in: ICWSM, 2008
2008
-
[8]
Godbole, M
N. Godbole, M. Srinivasaiah, S. Skiena, Large-scale sentiment analysis for news and blogs., ICWSM 7 (21) (2007) 219–222
2007
-
[9]
T. E. Patterson, Out of Order: An incisive and boldly original critique of the news media’s domination of Ameri, Vintage, 2011
2011
-
[10]
Stieglitz, L
S. Stieglitz, L. Dang-Xuan, Emotions and information diffusion in social media—sentiment of microblogs and sharing behavior, Journal of Management Information Systems 29 (4) (2013) 217–248
2013
-
[11]
Ahmed, S
M. Ahmed, S. Spagna, F. Huici, S. Niccolini, A peek into the future: Predicting the evolution of popularity in user generated content, in: Proceedings of the sixth ACM international conference on Web search and data mining, ACM, 2013, pp. 607–616
2013
-
[12]
Bandari, S
R. Bandari, S. Asur, B. A. Huberman, The pulse of news in social media: Forecasting popularity., ICWSM 12 (2012) 26–33
2012
-
[13]
J. G. Lee, S. Moon, K. Salamatian, An approach to model and predict the popularity of online contents with explanatory factors, in: Web Intelligence and Intelligent Agent Technology (WI-IAT), 2010 IEEE/WIC/ACM International Conference on, Vol. 1, IEEE, 2010, pp. 623–630. 19
2010
-
[14]
Lerman, T
K. Lerman, T. Hogg, Using a model of social dynamics to predict popularity of news, in: Proceedings of the 19th international conference on World wide web, ACM, 2010, pp. 621–630
2010
-
[15]
Szabo, B
G. Szabo, B. A. Huberman, Predicting the popularity of online content, Communications of the ACM 53 (8) (2010) 80–88
2010
-
[16]
Tatar, P
A. Tatar, P. Antoniadis, M. D. De Amorim, S. Fdida, From popularity prediction to ranking online news, Social Network Analysis and Mining 4 (1) (2014) 1–12
2014
-
[17]
Arapakis, M
I. Arapakis, M. Lalmas, B. B. Cambazoglu, M.-C. Marcos, J. M. Jose, User engagement in online news: Under the scope of sentiment, interest, affect, and gaze, Journal of the Association for Information Science and Technology 65 (10) (2014) 1988–2005
2014
-
[18]
Coscia, Average is boring: How similarity kills a meme’s success, Scienti/f_ic reports 4 (2014) 6477
M. Coscia, Average is boring: How similarity kills a meme’s success, Scienti/f_ic reports 4 (2014) 6477
2014
-
[19]
L. K. Hansen, A. Arvidsson, F. Å. Nielsen, E. Colleoni, M. Etter, Good friends, bad news-affect and virality in twitter, Future information technology (2011) 34–43
2011
-
[20]
Naveed, T
N. Naveed, T. Gottron, J. Kunegis, A. C. Alhadi, Bad news travel fast: A content-based analysis of interesting- ness on twitter, in: Proceedings of the 3rd International Web Science Conference, ACM, 2011, p. 8
2011
-
[21]
S. Wu, C. Tan, J. Kleinberg, M. W. Macy, Does bad news go away faster?, in: Fifth International AAAI Confer- ence on Weblogs and Social Media, 2011
2011
-
[22]
J. Reis, P. Gonçalves, P. Vaz de Melo, R. Prates, F. Benevenuto, Magnet news: You choose the polarity of what you read, Proceedings of ICWSM
-
[24]
Diakopoulos, M
N. Diakopoulos, M. Naaman, Topicality, time, and sentiment in online news comments, in: CHI’11 Extended Abstracts on Human Factors in Computing Systems, ACM, 2011, pp. 1405–1410
2011
-
[25]
A. Zubiaga, Newspaper editors vs the crowd: on the appropriateness of front page news selection, in: Proceed- ings of the 22nd International Conference on World Wide Web, ACM, 2013, pp. 879–880
2013
-
[26]
De Nies, G
T. De Nies, G. Haesendonck, F. Godin, W. De Neve, E. Mannens, R. Van de Walle, Towards automatic assessment of the social media impact of news content, in: Proceedings of the 22nd International Conference on World Wide Web, ACM, 2013, pp. 871–874
2013
-
[27]
Burke, M
M. Burke, M. Develin, Once more with feeling: Supportive responses to social sharing on facebook, in: Pro- ceedings of the 19th ACM Conference on Computer-Supported Cooperative Work & Social Computing, ACM, 2016, pp. 1462–1474
2016
-
[28]
Castillo, M
C. Castillo, M. El-Haddad, J. Pfeffer, M. Stempeck, Characterizing the life cycle of online news stories using social media reactions, in: Proceedings of the 17th ACM conference on Computer supported cooperative work & social computing, ACM, 2014, pp. 211–223
2014
-
[29]
Cheng, C
J. Cheng, C. Danescu-Niculescu-Mizil, J. Leskovec, How community feedback shapes user behavior, in: Eighth International AAAI Conference on Weblogs and Social Media, 2014
2014
-
[30]
D’Costa, Dont read the comments!(why do we read the online comments when we know theyll be bad?), Scienti/f_ic American
K. D’Costa, Dont read the comments!(why do we read the online comments when we know theyll be bad?), Scienti/f_ic American
-
[31]
Moosa, Comment sections are poison: handle with care or remove them, The Guardian
T. Moosa, Comment sections are poison: handle with care or remove them, The Guardian
-
[32]
Facebook, Facebook graph api, https://developers.facebook.com/docs/graph-api (2017)
2017
-
[33]
A. K. Uysal, S. Gunal, The impact of preprocessing on text classi/f_ication, Information Processing & Management 50 (1) (2014) 104–112
2014
-
[34]
C. J. Hutto, E. Gilbert, Vader: A parsimonious rule-based model for sentiment analysis of social media text, in: Eighth international AAAI conference on weblogs and social media, 2014
2014
-
[35]
Tamersoy, M
A. Tamersoy, M. De Choudhury, D. H. Chau, Characterizing smoking and drinking abstinence from social media, in: Proceedings of the 26th ACM Conference on Hypertext & Social Media, ACM, 2015, pp. 139–148
2015
-
[36]
Baccianella, A
S. Baccianella, A. Esuli, F. Sebastiani, Sentiwordnet 3.0: an enhanced lexical resource for sentiment analysis and opinion mining., in: Lrec, Vol. 10, 2010, pp. 2200–2204
2010
-
[37]
Cambria, C
E. Cambria, C. Havasi, A. Hussain, Senticnet 2: A semantic and affective resource for opinion mining and sentiment analysis., in: FLAIRS conference, 2012, pp. 202–207
2012
-
[38]
J. W. Pennebaker, M. E. Francis, R. J. Booth, Linguistic inquiry and word count: Liwc 2001, Mahway: Lawrence 20 Erlbaum Associates 71 (2001) (2001) 2001
2001
-
[39]
D. M. Blei, A. Y. Ng, M. I. Jordan, Latent dirichlet allocation, Journal of machine Learning research 3 (Jan) (2003) 993–1022
2003
-
[40]
W. Zhao, J. J. Chen, R. Perkins, Z. Liu, W. Ge, Y. Ding, W. Zou, A heuristic approach to determine an appropriate number of topics in topic modeling, BMC bioinformatics 16 (13) (2015) S8
2015
-
[41]
T. L. Griffiths, M. Steyvers, Finding scienti/f_ic topics, Proceedings of the National Academy of Sciences 101 (suppl 1) (2004) 5228–5235
2004
-
[42]
Chang, J
J. Chang, J. L. Boyd-Graber, S. Gerrish, C. Wang, D. M. Blei, Reading tea leaves: How humans interpret topic models., in: Nips, Vol. 31, 2009, pp. 1–9
2009
-
[43]
Agrawal, S
R. Agrawal, S. Gollapudi, A. Halverson, S. Ieong, Diversifying search results, in: WSDM, ACM, 2009, pp. 5–14
2009
-
[44]
Sievert, K
C. Sievert, K. E. Shirley, Ldavis: A method for visualizing and interpreting topics, in: Proceedings of the work- shop on interactive language learning, visualization, and interfaces, 2014, pp. 63–70
2014
-
[45]
W. L. Bennett, News: The politics of illusion, University of Chicago Press, 2016
2016
-
[46]
Budak, S
C. Budak, S. Goel, J. M. Rao, Fair and balanced? quantifying media bias through crowdsourced content analysis, Public Opinion Quarterly 80 (S1) (2016) 250–271
2016
-
[47]
Leetaru, Culturomics 2.0: Forecasting large-scale human behavior using global news media tone in time and space, First Monday 16 (9)
K. Leetaru, Culturomics 2.0: Forecasting large-scale human behavior using global news media tone in time and space, First Monday 16 (9)
-
[48]
R. F. Baumeister, E. Bratslavsky, C. Finkenauer, K. D. Vohs, Bad is stronger than good., Review of general psychology 5 (4) (2001) 323
2001
-
[49]
W. M. Johnston, G. C. Davey, The psychological impact of negative tv news bulletins: The catastrophizing of personal worries, British Journal of Psychology 88 (1) (1997) 85–91
1997
-
[50]
Kim, S.-U
C. Kim, S.-U. Yang, Like, comment, and share on facebook: How each behavior differs from the other, Public Relations Review 43 (2) (2017) 441–449
2017
-
[51]
Trussler, S
M. Trussler, S. Soroka, Consumer demand for cynical and negative news frames, The International Journal of Press/Politics (2014) 360–379
2014
Reviewed August 14, 2026 · model on record in the stance chip above.
Discussion (0). Continue with ORCID to comment.