REVIEW 3 major objections 6 minor 35 references
Vehicular Communication and Mobility Sustainability: the Mutual Impacts in Large-scale Smart Cities
T0 review · 3 major / 6 minor · reviewed 2026-08-14 · deepseek-v4-flash
Pith's one-line read The paper claims that VANET communication quality and urban mobility form a feedback loop that can gridlock a city when packet drops and delays corrupt eco-routing decisions.
desk verdict Novel integrated communication-traffic framework with a plausible mutual-impact story, but the load-bearing M/M/1/K queueing assumption is unvalidated and the headline gridlock result rests on it. read the letter →
The pith
A machine-rendered reading of the paper's core claim, the machinery that carries it, and where it could break.
The reading
What carries the argument
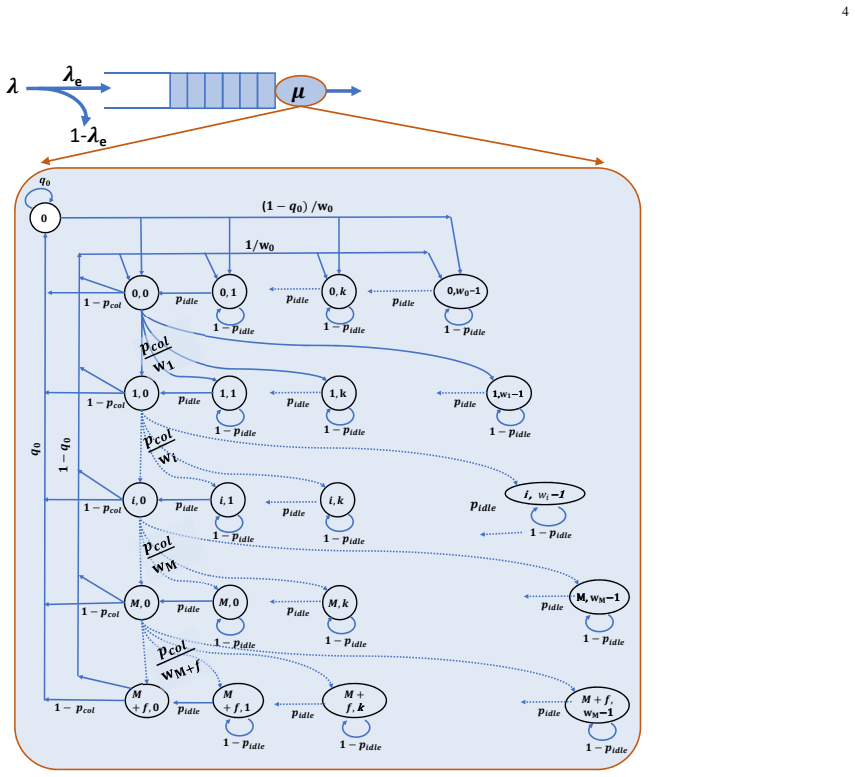
The carrying object is the integrated MAC-and-queue model: a two-dimensional Markov chain whose states $(i,j)$ track backoff stage $i$ and backoff counter $j$, together with an empty-system state, coupled to an M/M/1/K queue of finite size $K$. The chain yields the collision probability $p_{col}$, the idle probability $p_{idle}$, and the empty probability $q_0$, while the queue supplies the full-buffer rejection probability $P_{rej}$; together these produce the packet drop probability and the total packet delay that are fed into the traffic simulator. The service time $T_{serv}$ is a weighted sum over backoff stages, and the framework uses it to compute traffic intensity and queue statistics, so the communication metrics respond to the number of vehicles in range and the packet generation rate.
What would settle it
Replace the analytical queue-based drop and delay values of Equations 27 through 31 in the same downtown Los Angeles simulation with per-packet events from a discrete-event 802.11p simulator; if realistic communication then shows congestion onset at 90% of demand instead of 70%, the memoryless-queue assumption, not the mutual-impact claim, would be what carries the result.
Extended reading notes
Core claim
The paper's central claim is that the performance of IEEE 802.11p vehicular communication and the sustainability of urban mobility are mutually dependent, and that the dependence is strong enough to change a city's congestion threshold. In the downtown Los Angeles test network with calibrated morning-peak demand, the paper reports that ideal communication keeps the network out of the congested regime until demand reaches 90% of the calibrated origin-destination scaling factor, while realistic 802.11p communication—with packet drops and delays computed by the proposed MAC model—moves the congested regime to 70% demand and produces gridlock with large shares of vehicles unable to complete trips or enter the network. The mechanism is route feedback: delayed or dropped link-cost updates produce incorrect eco-routing decisions, which cause congestion, which raises vehicle density and further degrades communication. The paper also reports that at low demand eco-routing tolerates very high drop rates (about 93%), and that at the highest demand levels per-vehicle fuel and travel-time averages look better in the realistic case only because the completed trips are shorter and many vehicles drop out of the statistics.
Load-bearing premise
The load-bearing premise is the M/M/1/K memoryless assumption introduced in Section III-B (Equations 23, 27, and 30): packet arrivals and service times are treated as exponential even though the service time is computed from the Markov chain and is not shown to be memoryless.
Editorial extensions
If this is right
- In the downtown Los Angeles case study, the network enters the congested regime at 70% of calibrated demand under realistic 802.11p communication, versus 90% under ideal communication; at full demand only 41.2% of vehicles finish their trips in the realistic case, compared with 96.39% under ideal communication.
- At low traffic demand, eco-routing keeps working despite packet drop probabilities as high as about 93%, so the application can tolerate very poor communication when density is low.
- At the highest demand levels, the realistic-case averages for fuel, travel time, and emissions improve only because the statistics count trips that actually finish, and those trips are shorter; sustainability assessments must also count vehicles that never enter or never finish.
- The simulation time grows roughly linearly with the number of vehicles, making the framework usable for networks with tens of thousands of simultaneous vehicles.
- Communication-induced congestion in the realistic case roughly doubles the maximum average vehicle density seen in the ideal case at full demand (about 47 versus 25 vehicles per kilometer per lane).
Reading between the lines
- A natural extension is to test the same mutual-impact loop on other real-time feedback applications, such as adaptive signal timing or congestion-based route guidance; these also depend on timely link updates and could show a similar shift in the congestion threshold.
- Because the paper models one access category and only direct vehicle-to-infrastructure links, a multi-hop VANET with routing overhead would add more contention; a reasonable conjecture is that the congestion onset would appear at an even lower demand level.
- A measurement study on real 802.11p radios comparing full-queue rejection rates and service-time distributions at matched vehicle densities and packet rates would isolate whether the memoryless-queue assumption is the main source of error in the predicted gridlock threshold.
Signed reviews
Editorial analysis
A structured set of objections, weighed in public.
Referee Report
Summary. The paper proposes a scalable framework for jointly modeling IEEE 802.11p vehicular communication and microscopic traffic mobility in large ITS deployments. It first derives an analytical MAC model combining a two-dimensional Markov chain with an M/M/1/K queue to capture finite buffers, retransmission limits, and saturated/unsaturated conditions, then validates throughput and one-hop delay against OPNET simulations. The MAC model is integrated into the INTEGRATION traffic simulator to study dynamic eco-routing in a calibrated downtown Los Angeles network under ideal versus realistic V2I communication. The central experimental finding is that at high traffic demand (ODSF 0.7 and above), realistic communication with packet drops and delays causes incorrect eco-routing decisions, leading to congestion, gridlock, and a large share of vehicles failing to complete trips, whereas ideal communication remains largely uncongested until ODSF 0.9.
Significance. If the results hold, the paper provides a valuable and computationally efficient tool for studying mutual communication-mobility impacts in real city-scale ITS applications, and it delivers a practically important message: communication reliability should be a first-order design consideration for eco-routing systems in dense urban conditions. The strengths include a novel finite-buffer MAC model with retransmission limits, a real calibrated road network with multiple demand levels, and an explicit coupling loop between communication metrics and route decisions. The mathematical derivation is transparent and the paper honestly discloses the bias from computing averages only over completed trips, which is a commendable feature. However, the significance is tempered by the fact that the central queueing assumption is not validated, so the quantitative thresholds reported (e.g., ODSF 0.7) rest on an unverified approximation.
major comments (3)
- [Section III-B, Eqs. (22)-(23), (27), (30)] The M/M/1/K queueing model assumes both Poisson arrivals and exponentially distributed service times, but the service time Tserv computed in Eq. (22) is a weighted sum containing deterministic frame durations (Ts, Tf) and a truncated geometric number of backoff stages. Such a mixture is not memoryless, so the use of the M/M/1/K formula for q0 (Eq. 23), Prej (Eq. 27), and Tq (Eq. 30) is not justified by construction. This assumption is load-bearing because Pdrop and Tdelay are exactly the two channels through which communication degrades eco-routing in the central claim of Section V-B. The validation in Section III-C compares only throughput and one-hop delay, not the drop probability or queueing delay, so the reader cannot assess whether a more faithful service-time distribution would move the ODSF threshold or even eliminate the reported gridlock. The authors should either provide direct validation of q0, Prej, and Tq, or replace M/M/1/K with a more general model (e.g., M/G/1/K) and re-evaluate the qualitative conclusions.
- [Section III-C, Figs. 4-5] The validation of the MAC model is qualitative: the figures show curves labeled model and simulation with no error metrics, no confidence intervals, and no quantification of the deviation. Moreover, the validation targets per-vehicle throughput and average one-hop delay, whereas the quantities that actually drive the integrated eco-routing study are the packet drop probability (Eq. 28) and the queuing delay (Eq. 30). The claim that the model is "accurate" (Section III-C) is therefore not substantiated for the outputs on which the central conclusion depends. I request quantitative error metrics (e.g., relative error, root mean square error) for the existing comparisons, and ideally a direct comparison of Pdrop and Tq against the OPNET simulation at the operating points used in Section V (packet size 1000 bytes, K=64, R=1000 m).
- [Section V-B, Table II, and Section VI] The conclusion in Section VI that "the dynamic eco-routing system can work properly even at high packet drop rates that reaches approximately 93%" is based on the low-demand case ODSF=0.3, where the traffic network is not stressed. At ODSF=0.7 and above, the same framework predicts severe degradation, with over 20% of vehicles unable to complete trips at ODSF=1.0. The paper does acknowledge that averages at ODSF=0.9-1.0 are computed only over completed (and disproportionately short) trips, but the broad statement in the conclusion still overreaches. The robustness claim should be explicitly scoped to low or moderate demand levels, or to the specific operating conditions under which it was observed, to avoid misleading readers about the operational envelope of eco-routing under realistic communication.
minor comments (6)
- [Abstract and Keywords] The keyword "Samrt Cities" contains a typo; it should be "Smart Cities".
- [Throughout, especially Fig. 10 and Table II] The acronym "OSDF" appears where "ODSF" is intended; please use the correct abbreviation consistently.
- [Fig. 11 caption] The caption refers to "RUS locations" but should be "RSU locations".
- [Section V-D, Fig. 13] The statement that about 4% of packets can be delayed more than 1490 seconds relies on an implicit normal-distribution assumption from the mean and standard deviation. The delay distribution shown in Fig. 13-a is not demonstrated to be Gaussian; the percentile claim should be computed from the empirical distribution or explicitly justified.
- [Algorithm 1] The symbols "⊿" appear to be placeholder characters where comments were intended; these should be replaced with proper comment syntax or removed.
- [References and typos] Minor typos include "Revirbed modeler" (should be "Riverbed modeler") in the reference to [24] and "large-sale" (should be "large-scale") in Section VI.
Circularity Check
No significant circularity; MAC model is validated externally and eco-routing outcomes are emergent, not fitted.
full rationale
The paper's derivation chain is self-contained rather than circular. The MAC model is developed analytically from a two-dimensional Markov chain (Fig. 2, Eqs. 1-10) and an M/M/1/K queueing model (Eqs. 23, 27, 30), solved as a fixed point of the state probabilities and queue parameters. This model is then validated against independent OPNET discrete-event simulations for throughput and delay (Figs. 4-5), which is external evidence not tied to the paper's fitted values or its target conclusion. The eco-routing results are produced by feeding the model-computed drop probabilities and delays into the INTEGRATION traffic simulator; the gridlock at ODSF >= 0.7 is an emergent outcome of the simulation, not a quantity fitted to match that conclusion. Self-citations to the authors' prior work appear in the motivation: [9] is used to justify using UDP by citing robustness to a 25% drop rate, and [23] motivates the analytical model by noting the cost of discrete-event simulation. These citations inform design choices but do not define the central claim, which rests on the independently validated communication model and the coupled traffic simulation. The M/M/1/K service-time assumption (exponential service times, Eq. 22 vs. Eqs. 23/27/30) is an unvalidated modeling assumption that could affect the quantitative results, but it is not a case of the paper defining its target in terms of its input or renaming a fit as a prediction. No equation reduces to its own input by construction, and no self-citation is load-bearing in the derivation of the main result.
Assumptions & free parameters
free parameters (4)
- MAC queue size K =
64 packets
- Background packet generation rate lambda =
50 packets/s
- Communication range R_Com =
1000 m
- Packet size =
1000 bytes
assumptions (4)
- domain assumption Packet arrivals to the MAC queue follow a Poisson process and service times are exponentially distributed (M/M/1/K assumption).
- standard math Each station's back-off process can be modeled by a single Markov chain with constant, independent collision probability pcol (Bianchi-style mean-field assumption).
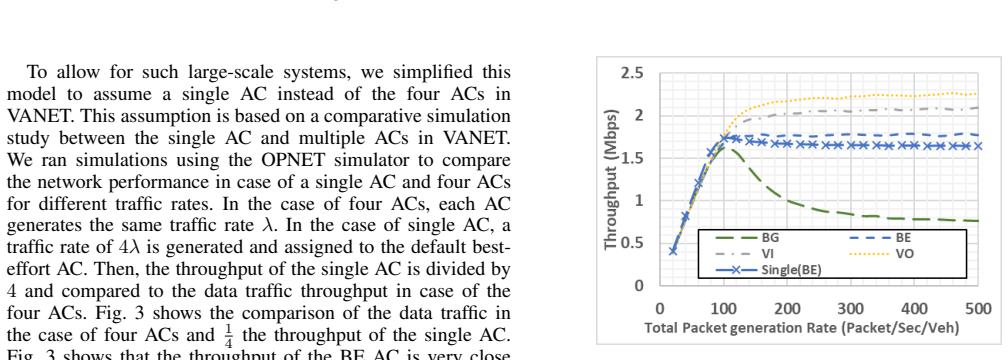
- domain assumption A single access category can represent the BE traffic of four-AC IEEE 802.11p EDCA.
- domain assumption The INTEGRATION microscopic traffic simulator and VT-Micro fuel consumption model accurately represent urban traffic and fuel use.
Cite this review
Pith. "Pith review of Vehicular Communication and Mobility Sustainability: the Mutual Impacts in Large-scale Smart Cities." pith.science (2026). https://pith.science/paper/W5AVSP5V
@misc{pith2026190808229,
  author       = {Pith},
  title        = {Pith review of: Vehicular Communication and Mobility Sustainability: the Mutual Impacts in Large-scale Smart Cities},
  year         = {2026},
  howpublished = {\url{https://pith.science/paper/W5AVSP5V}},
  note         = {Machine review of arXiv:1908.08229}
}
read the original abstract
Intelligent Transportation Systems (ITSs) is the backbone of transportation services in smart cities. ITSs produce better-informed decisions using real-time data gathered from connected vehicles. In ITSs, Vehicular Ad hoc Network (VANET) is a communication infrastructure responsible for exchanging data between vehicles and Traffic Management Centers (TMC). VANET performance (packet delay and drop rate) can affect the performance of ITS applications. Furthermore, the distribution of communicating vehicles affects the VANET performance. So, capturing this mutual impact between communication and transportation is crucial to understanding the behavior of ITS applications. Thus, this paper focuses on studying the mutual impact of VANET communication and mobility in city-level ITSs. We first introduce a new scalable and computationally fast framework for modeling large-scale ITSs including communication and mobility. In the proposed framework, we develop and validate a new mathematical model for the IEEE 802.11p MAC protocol which can capture the behavior of medium access and queuing process. This MAC model is then integrated within a microscopic traffic simulator to accurately simulate vehicle mobility. This integrated framework can accurately capture the mobility, communication, and the spatiotemporal impacts in large-scale ITSs. Secondly, the proposed framework is used to study the impact of communication on eco-routing navigation performance in a real large-scale network with real calibrated vehicular traffic. The paper demonstrates that communication performance can significantly degrade the performance of the dynamic eco-routing navigation when the traffic density is high. It also shows that the fuel consumption can be increased due to lack of communication reliability.
Figures

Figures from the paper (11 more)




Reference graph
Works this paper leans on
-
[1]
Performance analysis and enhancement of the dsrc for vanet’s safety applications,
K. A. Hafeez, L. Zhao, B. Ma, and J. W. Mark, “Performance analysis and enhancement of the dsrc for vanet’s safety applications,” IEEE Transactions on Vehicular Technology, vol. 62, no. 7, pp. 3069–3083, 2013
work page 2013
-
[2]
Integration framework for modeling eco-routing strategies: Logic and preliminary results,
H. A. Rakha, K. Ahn, and K. Moran, “Integration framework for modeling eco-routing strategies: Logic and preliminary results,” In- ternational Journal of Transportation Science and Technology , vol. 1, no. 3, pp. 259–274, 2012
work page 2012
-
[3]
“Approved IEEE Standard for Wireless Access in Vehicular Environ- ments (W A VE) - Networking Services,”Approved Std P1609.3/D23.pdf, Feb 2007, 2007
work page 2007
-
[4]
“IEEE Approved Draft Standard for Wireless Access in Vehicular Environments (W A VE) - Networking Services,” IEEE P1609.3v3/D6, November 2015, pp. 1–162, Jan 2016
work page 2015
-
[5]
IEEE Guide for Wireless Access in Vehicular Environments (W A VE) - Architecture, year=2014,
“IEEE Guide for Wireless Access in Vehicular Environments (W A VE) - Architecture, year=2014,” IEEE Std 1609.0-2013 , pp. 1–78, March
work page 2014
-
[6]
“IEEE Standard for Telecommunications and Information Exchange Between Systems - LAN/MAN Specific Requirements - Part 11: Wireless Medium Access Control (MAC) and physical layer (PHY) specifications: High Speed Physical Layer in the 5 GHz band,” IEEE Std 802.11a-1999, pp. 1–102, Dec 1999
work page 1999
-
[7]
“IEEE Standard for Information technology– Local and metropolitan area networks– Specific requirements– Part 11: Wireless LAN Medium Access Control (MAC) and Physical Layer (PHY) Specifications Amendment 6: Wireless Access in Vehicular Environments,” IEEE Std 802.11p-2010, pp. 1–51, July 2010
work page 2010
-
[8]
“IEEE Standard for Information technology–Local and metropolitan area networks–Specific requirements–Part 11: Wireless LAN Medium Access Control (MAC) and Physical Layer (PHY) Specifications - Amendment 8: Medium Access Control (MAC) Quality of Service Enhancements,” IEEE Std 802.11e-2005 , pp. 1–212, Nov 2005
work page 2005
Show all 35 references
-
[9]
Eco-Routing Using V2I Communication: System Evaluation,
A. Elbery, H. Rakha, M. Elnainay, W. Drira, and F. Filali, “Eco-Routing Using V2I Communication: System Evaluation,” in Intelligent Trans- portation Systems (ITSC), 2015 IEEE 18th International Conference on, pp. 71–76, IEEE, 2015
2015
-
[10]
RFC 791: Internet Protocol,
J. Postel et al., “RFC 791: Internet Protocol,” 1981
1981
-
[11]
Internet Protocol, version 6 (IPv6) specification,
S. E. Deering, “Internet Protocol, version 6 (IPv6) specification,” 1998
1998
-
[12]
Performance analysis of the IEEE 802.11 distributed coor- dination function,
G. Bianchi, “Performance analysis of the IEEE 802.11 distributed coor- dination function,” IEEE Journal on selected areas in communications , vol. 18, no. 3, pp. 535–547, 2000
2000
-
[13]
Refinements on IEEE 802.11 distributed coordination function modeling approaches,
I. Tinnirello, G. Bianchi, and Y . Xiao, “Refinements on IEEE 802.11 distributed coordination function modeling approaches,” IEEE Transac- tions on Vehicular Technology, vol. 59, no. 3, pp. 1055–1067, 2010
2010
-
[14]
Performance analysis of IEEE 802.11 DCF in presence of transmission errors,
P. Chatzimisios, A. C. Boucouvalas, and V . Vitsas, “Performance analysis of IEEE 802.11 DCF in presence of transmission errors,” in Communications, 2004 IEEE International Conference on , vol. 7, pp. 3854–3858, IEEE, 2004
2004
-
[15]
Performance evaluation of the IEEE 802.11 p W A VE communication standard,
S. Eichler, “Performance evaluation of the IEEE 802.11 p W A VE communication standard,” in Vehicular Technology Conference, 2007. VTC-2007 Fall. 2007 IEEE 66th , pp. 2199–2203, IEEE, 2007
2007
-
[16]
Revisit of the Markov model of IEEE 802.11 DCF for an error-prone channel,
H. Chen, “Revisit of the Markov model of IEEE 802.11 DCF for an error-prone channel,” IEEE Communications Letters , vol. 15, no. 12, pp. 1278–1280, 2011
2011
-
[17]
Analytical study of the IEEE 802.11 p MAC sublayer in vehicular networks,
C. Han, M. Dianati, R. Tafazolli, R. Kernchen, and X. Shen, “Analytical study of the IEEE 802.11 p MAC sublayer in vehicular networks,” IEEE Transactions on Intelligent Transportation Systems, vol. 13, no. 2, pp. 873–886, 2012
2012
-
[18]
Performance Modeling and Analysis of the IEEE 802.11 p EDCA Mechanism for V ANET,
J. Zheng and Q. Wu, “Performance Modeling and Analysis of the IEEE 802.11 p EDCA Mechanism for V ANET,” IEEE Transactions on Vehicular Technology, vol. 65, no. 4, pp. 2673–2687, 2016
2016
-
[19]
The performance evaluation of IEEE 802.11 DCF using Markov chain model for wireless LANs,
C.-E. Weng and H.-C. Chen, “The performance evaluation of IEEE 802.11 DCF using Markov chain model for wireless LANs,” Computer Standards & Interfaces , vol. 44, pp. 144–149, 2016
2016
-
[20]
An accurate two dimensional Markov chain model for IEEE 802.11 n DCF,
N. Hajlaoui, I. Jabri, and M. B. Jemaa, “An accurate two dimensional Markov chain model for IEEE 802.11 n DCF,” Wireless Networks , pp. 1–13, 2016
2016
-
[21]
Non-saturation and saturation analysis of IEEE 802.11 e EDCA with starvation prediction,
P. E. Engelstad and O. N. Østerbø, “Non-saturation and saturation analysis of IEEE 802.11 e EDCA with starvation prediction,” in Proceedings of the 8th ACM international symposium on Modeling, analysis and simulation of wireless and mobile systems , pp. 224–233, ACM, 2005
2005
-
[22]
Kleinrock, Queueing systems, volume 2: Computer applications , vol
L. Kleinrock, Queueing systems, volume 2: Computer applications , vol. 66. wiley New York, 1976. 15
1976
-
[23]
An integrated architecture for simulation and modeling of small-and medium-sized transportation and communication networks,
A. Elbery, H. Rakha, M. Y . ElNainay, and M. A. Hoque, “An integrated architecture for simulation and modeling of small-and medium-sized transportation and communication networks,” in International Confer- ence on Smart Cities and Green ICT Systems , pp. 282–303, Springer, 2015
2015
-
[24]
Revirbed modeler
“Revirbed modeler.” https://www.riverbed.com/products/steelcentral/ steelcentral-riverbed-modeler.html. Accessed: 2017-09-30
2017
-
[25]
A novel stochastic linear programming feedback eco-routing traffic assignment system,
A. Elbery and H. A. Rakha, “A novel stochastic linear programming feedback eco-routing traffic assignment system,” in Transportation Research Board 96th Annual Meeting, TRB2017 , 2017
2017
-
[26]
Environmentally-friendly navigation,
M. Barth, K. Boriboonsomsin, and A. Vu, “Environmentally-friendly navigation,” in Intelligent Transportation Systems Conference, 2007. ITSC 2007. IEEE , pp. 684–689, IEEE, 2007
2007
-
[27]
The effects of route choice decisions on vehicle energy consumption and emissions,
K. Ahn and H. Rakha, “The effects of route choice decisions on vehicle energy consumption and emissions,” Transportation Research Part D: Transport and Environment, vol. 13, no. 3, pp. 151–167, 2008
2008
-
[28]
Optimizing route choice for lowest fuel consumption–potential effects of a new driver support tool,
E. Ericsson, H. Larsson, and K. Brundell-Freij, “Optimizing route choice for lowest fuel consumption–potential effects of a new driver support tool,” Transportation Research Part C: Emerging Technologies, vol. 14, no. 6, pp. 369–383, 2006
2006
-
[29]
Field evaluation of energy and environmental impacts of driver route choice decisions,
K. Ahn and H. Rakha, “Field evaluation of energy and environmental impacts of driver route choice decisions,” in Intelligent Transportation Systems Conference, 2007. ITSC 2007. IEEE, pp. 730–735, IEEE, 2007
2007
-
[30]
Eco-routing navigation system based on multisource historical and real-time traffic information,
K. Boriboonsomsin, M. J. Barth, W. Zhu, and A. Vu, “Eco-routing navigation system based on multisource historical and real-time traffic information,” IEEE Transactions on Intelligent Transportation Systems, vol. 13, no. 4, pp. 1694–1704, 2012
2012
-
[31]
Eco- routing: An ant colony based approach.,
A. Elbery, H. Rakha, M. Y . ElNainay, W. Drira, and F. Filali, “Eco- routing: An ant colony based approach.,” in VEHITS, pp. 31–38, 2016
2016
-
[32]
Emission model de- velopment using in-vehicle on-road emission measurements,
H. Rakha, K. Ahn, I. El-Shawarby, and S. Jang, “Emission model de- velopment using in-vehicle on-road emission measurements,” in Annual Meeting of the Transportation Research Board, Washington, DC, vol. 2, 2004
2004
-
[33]
Kleinrock, Queueing systems, volume 2: Computer applications , vol
L. Kleinrock, Queueing systems, volume 2: Computer applications , vol. 66. wiley New York, 1976
1976
-
[34]
Microscopic simulation and calibration of a large-scale metropolitan network: Issues and proposed solutions,
A. E. M. K. Jianhe Du, Hesham A. Rakha, “Microscopic simulation and calibration of a large-scale metropolitan network: Issues and proposed solutions,” in Annual Meeting of the Transportation Research Board, Washington, DC, 2018
2018
-
[35]
Derivation of a fundamental diagram for urban traffic flow,
D. Helbing, “Derivation of a fundamental diagram for urban traffic flow,” The European Physical Journal B-Condensed Matter and Com- plex Systems, vol. 70, no. 2, pp. 229–241, 2009. Ahmed Elbery is a postdoctoral research fellow in the Center for Sustainable Mobility (CSM) at the...
2009
Reviewed August 14, 2026 · model on record in the stance chip above.
Discussion (0). Continue with ORCID to comment.