REVIEW 4 major objections 5 minor 20 references
Direct observation of the spin-orbit coupling interaction in ring-core optical fibers
T0 review · 4 major / 5 minor · reviewed 2026-08-14 · deepseek-v4-flash
Pith's one-line read A single-pixel SWIR camera resolves OAM modes spaced 30 ps apart, directly observing spin-orbit coupling in a ring-core fiber and confirming that SOa/SOaa delays scale with the square of the mode order.
desk verdict Useful methods paper: 30 ps-resolved SWIR mode imaging in ring-core fiber; L² scaling claim is plausible but over-fitted to four selected points without error bars. read the letter →
The pith
A machine-rendered reading of the paper's core claim, the machinery that carries it, and where it could break.
The reading
What carries the argument
The central object is the single-pixel imaging system: a DMD displaying Hadamard masks, a high-speed photodetector, and a 50 GHz oscilloscope reconstruct the fiber output as a 32-by-32-pixel movie, while Fourier deconvolution with the measured impulse response sharpens the temporal signal. The physical identity carrying the quantitative claim is the spin-orbit splitting formula $\delta\beta = \frac{L}{k a 2 n_{\mathrm{co}}^2} \int_0^\infty |E(r)|^2 \frac{\partial \Delta n(r)}{\partial r}\,dr$, whose polarization-correction integral accounts for the index-gradient interaction. Because that integral is of order $L$ in small-core fibers, the arrival-time difference between SOa and SOaa modes is predicted to scale as $L^2$, and the deconvolved temporal peaks are what tie the measured delays to this scaling.
What would settle it
Inject a known OAM order with controlled circular polarization into the same fiber and measure the SOa/SOaa delay directly without relying on mode labelling from reconstructed images; if the extracted arrival-time differences do not scale with the square of the mode order, or do not grow linearly with fiber length for fixed mode order, the claimed spin-orbit scaling would be contradicted.
Extended reading notes
Core claim
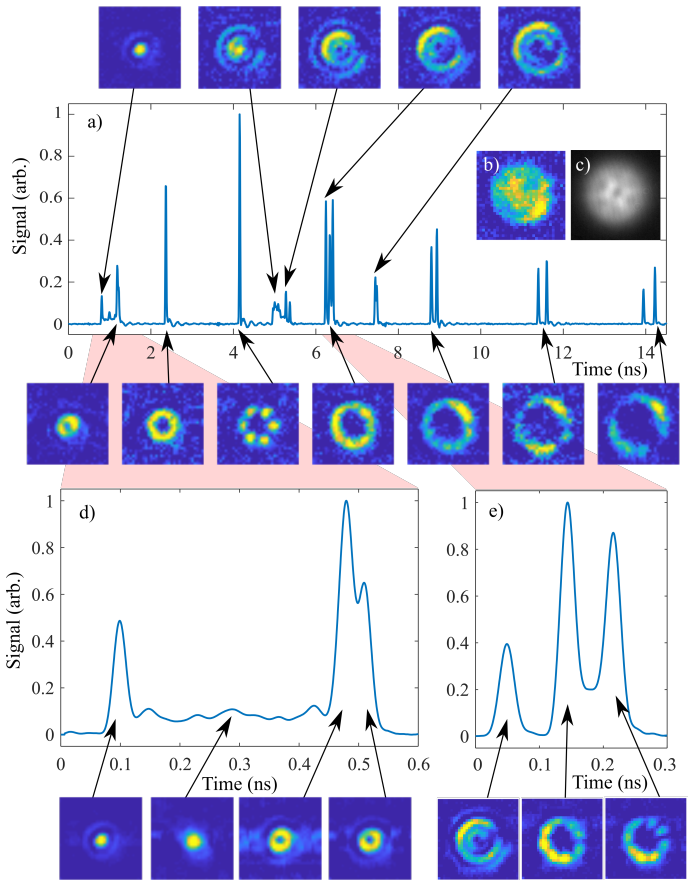
The paper's claim is that the spin-orbit coupling of light inside a ring-core fiber, namely the splitting of each propagation constant into aligned and anti-aligned polarization/OAM states, can be seen directly in the time domain. The authors reconstruct movies of the fiber output from Hadamard-coded single-pixel measurements and show separate temporal peaks for SOa and SOaa modes. From a full 15 ns acquisition they extract the arrival-time difference between SOa and SOaa for the modes whose splitting exceeds the instrument resolution, and find that this difference plots linearly against $L^2$ with $R^2 = 0.999$. They take this as confirmation of the standard spin-orbit splitting relation, in which the propagation-constant splitting $\delta\beta$ is proportional to $L$ times a polarization-correction integral that itself scales with $L$, so that group-delay separations scale as $L^2$.
Load-bearing premise
The load-bearing premise is that the deconvolution and smoothing do not shift or invent temporal peaks, so that each extracted delay is the true group-delay separation of a correctly identified SOa/SOaa pair; if that fails for any of the four fitted mode orders, the reported $L^2$ scaling is not established.
Editorial extensions
If this is right
- The technique resolves mode separations of 30 ps, an order-of-magnitude improvement in temporal resolution over earlier single-pixel light-in-flight work at this wavelength.
- The observed $L^2$ scaling gives a practical rule for when SOa/SOaa modes in ring-core fibers will be separable: higher-order OAM modes separate faster.
- Deconvolution of the instrument response is the step that makes picosecond-level mode identification possible with a nanosecond-response detector, so the same approach transfers to other slow detectors.
- Adding polarization control and detection could isolate pure SOa/SOaa pairs and measure their interference directly, which the authors note as a next step.
- The method applies beyond ring-core fibers to other multimode fibers where group-velocity differences between modes need to be characterized.
Reading between the lines
- If the $L^2$ scaling holds for all supported orders, then in longer fibers the SOa/SOaa delay grows quadratically with mode order; this could make time-gated detection a mode-sorting mechanism without spatial mode filtering.
- A decisive extension would vary fiber length and verify that measured delays scale linearly with length for fixed $L$, separating the material and waveguide contributions from the spin-orbit term.
- The same Hadamard temporal-imaging scheme, with a faster detector, could push below 10 ps and might resolve the near-degenerate groups (e.g., SOa0,2/TE0,2/SOa1,2/TM0,2) that currently appear as a broad feature.
- Because the measurement uses no polarization control, the petal interference between SOa and SOaa components complicates mode labelling; repeating with controlled input polarization would test whether the extracted delays are independent of coupling conditions.
Signed reviews
Editorial analysis
A structured set of objections, weighed in public.
Referee Report
Summary. The paper reports time-resolved single-pixel imaging of orbital-angular-momentum (OAM) modes emerging from a ring-core optical fiber at 1550 nm. A 32x32 Hadamard single-pixel camera with a fast photodetector and oscilloscope is used to record temporal traces for each mask, and Fourier deconvolution with a Gaussian smoothing step is applied to remove the 18.5 ns detector impulse response. The authors identify SOa/SOaa mode pairs separated by as little as 30 ps, present images of the modes, and claim in Section 3 that the measured arrival-time differences between SOa and SOaa modes follow an L^2 scaling, supported by a linear regression with R^2=0.999 over the four mode orders L=±4 to ±7 for which the separation was measurable.
Significance. If the result holds, the paper demonstrates a practical route to picosecond-level time-resolved imaging of fiber modes at telecommunications wavelengths using a single-pixel camera, and provides the first direct time-domain observation of spin-orbit-coupling-induced mode splitting in a ring-core fiber. The strengths of the work are the clear experimental design, the use of deconvolution to overcome a slow detector response, and the explicit comparison of the measured separations with a predicted L^2 scaling. The paper does not ship code or data, and it does not provide machine-checked derivations; its reproducibility rests on the description of the apparatus. The central quantitative claim, however, is currently supported by a small and selectively chosen dataset without uncertainty estimates, so the significance is real but the quantitative conclusion is not yet secure.
major comments (4)
- [§3, Fig. 4] The L^2-scaling claim rests on a linear regression of only four data points (L = ±4 to ±7), with no error bars, no reported slope or intercept, and no statement of the fit procedure. The caption states that points were included only when the SOa/SOaa separation was 'larger than the temporal resolution of our experiment,' so the inclusion criterion is explicitly correlated with the measured response variable. This truncation can bias the fit and inflate R^2. The manuscript should report all extracted separations, including unresolved modes as upper limits, justify or prespecify the inclusion rule, and provide uncertainties for the extracted arrival-time differences.
- [§2, Fig. 2] Arrival times are extracted from signals after Fourier deconvolution and Gaussian smoothing, but the smoothing width is not specified and no sensitivity analysis is presented. Because the detector has an 18.5 ns ringing impulse response and the signals are sampled over a 15 ns window (1 ns for the higher-resolution acquisitions), deconvolution can shift or create temporal peaks. The claimed 30 ps separation and the Fig. 4 data are therefore not yet quantitatively established. The authors should quantify the uncertainty in peak positions, for example by varying the regularization or smoothing parameters and by validating the processing on synthetic signals with known mode separations.
- [§3, Fig. 3] The assignment of measured peaks to SOa/SOaa pairs is made from reconstructed 32x32 images, but several modes are near-degenerate (for example, the SOa0,2/TE0,2/SOa1,2/TM0,2 group is described as a 'low haystack'). Without an explicit labeling criterion, such as petal count, ring radius, or comparison with a simulated mode set, and without an uncertainty analysis, a misidentification of the peaks used in Fig. 4 would change the reported scaling. Please specify the labeling rule and test its robustness.
- [§3, Eq. (2)] The prediction that the separation scales as L^2 relies on two assertions: that the polarization correction integral is 'typically of order L' and that the group-velocity splitting scales in the same way as the propagation-constant splitting. Neither step is derived in the manuscript or tied to a specific equation in the cited references. If these assumptions do not hold for the ring-core fiber used here, the L^2 comparison is not a valid test of the model. Please add the derivation or a precise reference and state the conditions under which the L^2 scaling is expected.
minor comments (5)
- [§1 and §3] There are typographical errors: 'expresses as an integer value L' should be 'expressed as an integer value L', and 'direction observation' should be 'direct observation'.
- [§2] The statement that 'there was little difference in the results when either method was used' should be quantified or removed, since the choice of deconvolution domain is part of the data-processing pipeline.
- [§3] The claim that an 18 ps detector response would allow a 10 ps difference to be detected is unsupported; a quantitative criterion, such as separation relative to the deconvolved pulse width and the signal-to-noise ratio, is needed.
- [§3, Eq. (2)] The notation 'ka 2n2co' is ambiguous; it should be written as k a^2 2 n_co^2 (or equivalent) so that the denominator is clear.
- [§2, §3] The specific models of the pulsed laser, the photodetector, and the Goldeye comparison camera are named but their key specifications are not all given in the text; adding the relevant data-sheet parameters would improve reproducibility.
Circularity Check
No circularity found: the reported L^2 scaling is a measured comparison against an independent theoretical model, not a fitted parameter renamed as a prediction.
full rationale
The paper's derivation chain is: (1) a single-pixel camera records time-resolved images of OAM modes via Hadamard-mask measurements; (2) Fourier deconvolution and Gaussian smoothing separate temporally close modes; (3) arrival-time differences between SOa and SOaa modes are extracted; (4) these differences are plotted against mode order L and compared with Eq. (2), the standard polarization-correction expression from Refs. [17,19,20], which predicts an L^2 scaling. The model constants and the polarization-correction integral are not fitted to the measured arrival times; the paper tests only the predicted functional form. The linear regression in Fig. 4 is a data-analysis fit, not a model parameter fit, so the R^2 value does not reduce to the model being used as an input. The self-citations to Ref. [7] (the fiber) and Ref. [15] (the prior single-pixel technique) are contextual: they identify the fiber and the instrumentation, but the central observation of 30 ps-separated SOa/SOaa modes and their arrival-time scaling is new, directly measured data. The concern that the Fig. 4 point selection is correlated with temporal resolution is a statistical/robustness issue, not a circularity: it does not make the measured L^2 dependence equivalent by construction to the input model. No load-bearing circular step is identifiable in the paper's argument.
Assumptions & free parameters
free parameters (2)
- Gaussian smoothing width =
not stated
- Linear regression slope and intercept in Fig. 4 =
not reported
assumptions (5)
- standard math The Hadamard transform reconstruction in Eq. (1) correctly inverts the mask measurements to form the image at each time bin.
- standard math The measured signal is the convolution of the true optical signal with a stationary impulse response, so Fourier deconvolution is valid.
- domain assumption The polarization-correction integral in Eq. (2), taken from [7,19,20], correctly describes spin-orbit splitting of propagation constants in this fiber.
- domain assumption The fiber output mode pattern is stable over the roughly 20 minute acquisition across 2048 DMD masks.
- domain assumption Each temporal peak corresponds to one mode or near-degenerate mode group, and the L labels assigned from the reconstructed images are correct.
Cite this review
Pith. "Pith review of Direct observation of the spin-orbit coupling interaction in ring-core optical fibers." pith.science (2026). https://pith.science/paper/IHAPINCM
@misc{pith2026190808252,
  author       = {Pith},
  title        = {Pith review of: Direct observation of the spin-orbit coupling interaction in ring-core optical fibers},
  year         = {2026},
  howpublished = {\url{https://pith.science/paper/IHAPINCM}},
  note         = {Machine review of arXiv:1908.08252}
}
read the original abstract
Ring-core optical fibers have been designed to carry orbital angular momentum modes. We demonstrate the imaging of these modes, individually identifying modes separated temporally by only 30~ps. A single-pixel camera operating in the short-wave infrared detection range is used to image the 1550~nm wavelength optical modes. With this technique, examination of these optical modes can be performed with significantly higher temporal resolution than is possible with conventional imaging systems, such that the imaging of modes separated by spin-orbit coupling is achieved and evaluated. Deconvolution is required to separate the instrument response from the optical mode signal, increasing the clarity and temporal resolution of the measurement system.
Figures


Figures from the paper (1 more)

Reference graph
Works this paper leans on
-
[1]
Capacity trends and limits of optical communication networks,
R.-J. Essiambre and R. W. Tkach, “Capacity trends and limits of optical communication networks,” Proc. IEEE100, 1035–1055 (2012)
work page 2012
-
[2]
Mode-multiplexed transmission over conventional graded-index multimode fibers,
R. Ryf, N. K. Fontaine, H. Chen, B. Guan, B. Huang, M. Esmaeelpour, A. H. Gnauck, S. Randel, S. Yoo, A. Koonen, R. Shubochkin, Y. Sun, and R. Lingle, “Mode-multiplexed transmission over conventional graded-index multimode fibers,” Opt. Express23, 235–246 (2015)
work page 2015
-
[3]
K. Lenglé, X. Insou, P. Jian, N. Barré, B. Denolle, L. Bramerie, and G. Labroille, “4x10 Gbit/s bidirectional transmissionover2kmofconventionalgraded-indexOM1multimodefiberusingmodegroupdivisionmultiplexing,” Opt. Express24, 28594–28605 (2016)
work page 2016
-
[4]
S. Ramachandran and P. Kristensen, “Optical vortices in fiber,” Nanophotonics2, 455–474 (2013)
work page 2013
-
[5]
Terabit-scale orbital angular momentum mode division multiplexing in fibers,
N. Bozinovic, Y. Yue, Y. Ren, M. Tur, P. Kristensen, H. Huang, A. E. Willner, and S. Ramachandran, “Terabit-scale orbital angular momentum mode division multiplexing in fibers,” Science340, 1545–1548 (2013)
work page 2013
-
[6]
Orbital angular momentum of light and the transformation of Laguerre-Gaussian laser modes,
L. Allen, M. W. Beijersbergen, R. J. C. Spreeuw, and J. P. Woerdman, “Orbital angular momentum of light and the transformation of Laguerre-Gaussian laser modes,” Phys. Rev. A45, 8185–8189 (1992)
work page 1992
-
[7]
Conservationoforbital angularmomentumin air-coreoptical fibers,
P.Gregg, P. Kristensen, andS.Ramachandran, “Conservationoforbital angularmomentumin air-coreoptical fibers,” Optica 2, 267–270 (2015)
work page 2015
-
[8]
Atrillionframespersecond: thetechniquesandapplicationsoflight-in-flightphotography
D.FaccioandA.Velten,“Atrillionframespersecond: thetechniquesandapplicationsoflight-in-flightphotography.” Reports on Prog. Phys.81, 105901 (2018)
work page 2018
Show all 20 references
-
[9]
3D imaging with 128× 128 eye safe InGaAs p-i-n lidar camera,
C. P. Bradley, S. S. Mukherjee, A. D. Reinhardt, P. F. McManamon, A. O. Lee, and V. Dhulla, “3D imaging with 128× 128 eye safe InGaAs p-i-n lidar camera,” Proc. SPIE 11005, Laser Radar Technol. Appl. XXIV (2019)
2019
-
[10]
Cross-correlated (C2) imaging of fiber and waveguide modes,
D. N. Schimpf, R. A. Barankov, and S. Ramachandran, “Cross-correlated (C2) imaging of fiber and waveguide modes,” Opt. Express19, 13008–13019 (2011)
2011
-
[11]
Sub-second mode measurement of fibers using C2 imaging,
J. Demas and S. Ramachandran, “Sub-second mode measurement of fibers using C2 imaging,” Opt. Express22, 23043–23056 (2014)
2014
-
[12]
Spatially and spectrally resolved imaging of modal content in large-mode-area fibers,
J. W. Nicholson, A. D. Yablon, S. Ramachandran, and S. Ghalmi, “Spatially and spectrally resolved imaging of modal content in large-mode-area fibers,” Opt. Express16, 7233–7243 (2008)
2008
-
[13]
Principles and prospects for single-pixel imaging,
M. P. Edgar, G. M. Gibson, and M. J. Padgett, “Principles and prospects for single-pixel imaging,” Nat. Photonics13, 13–20 (2019)
2019
-
[14]
Single-photon sensitive light-in-fight imaging,
G. Gariepy, N. Krstajić, R. Henderson, C. Li, R. R. Thomson, G. S. Buller, B. Heshmat, R. Raskar, J. Leach, and D. Faccio, “Single-photon sensitive light-in-fight imaging,” Nat. Commun.6, 6021 (2015)
2015
-
[15]
A light-in-flight single-pixel camera for use in the visible and short-wave infrared,
S. D. Johnson, D. B. Phillips, Z. Ma, S. Ramachandran, and M. J. Padgett, “A light-in-flight single-pixel camera for use in the visible and short-wave infrared,” Opt. Express27, 9829–9837 (2019)
2019
-
[16]
Hadamard transform image coding,
W. K. Pratt, J. Kane, and H. C. Andrews, “Hadamard transform image coding,” Proc. IEEE57, 58–68 (1969)
1969
-
[17]
Spin and orbital rotation of electrons and photons via spin-orbit interaction,
C. C. Leary, M. G. Raymer, and S. J. van Enk, “Spin and orbital rotation of electrons and photons via spin-orbit interaction,” Phys. Rev. A80, 061804 (2009)
2009
-
[18]
Generation and propagation of radially polarized beams in optical fibers,
S. Ramachandran, P. Kristensen, and M. F. Yan, “Generation and propagation of radially polarized beams in optical fibers,” Opt. Lett.34, 2525–2527 (2009)
2009
-
[19]
Bures,Guided Optics: Optical Fibers and All-fiber Components(Wiley, 2008)
J. Bures,Guided Optics: Optical Fibers and All-fiber Components(Wiley, 2008)
2008
-
[20]
Snyder and J
A. Snyder and J. Love,Optical Waveguide Theory(Springer, 1983)
1983
Reviewed August 14, 2026 · model on record in the stance chip above.
Discussion (0). Continue with ORCID to comment.