REVIEW 2 major objections 4 minor 53 references
What Determines the Sizes of Bars in Spiral Galaxies?
T0 review · 2 major / 4 minor · reviewed 2026-08-14 · deepseek-v4-flash
Pith's one-line read Bar size in spiral galaxies is bimodal in stellar mass and is set mostly by the disc scale length, with an extra mass dependence only in the most massive galaxies.
desk verdict New bimodal bar–mass scaling from S4G with a real but covariance-vulnerable residual mass term; worth refereeing, but the high-mass claim needs a correlated-error test. read the letter →
The pith
A machine-rendered reading of the paper's core claim, the machinery that carries it, and where it could break.
The reading
What carries the argument
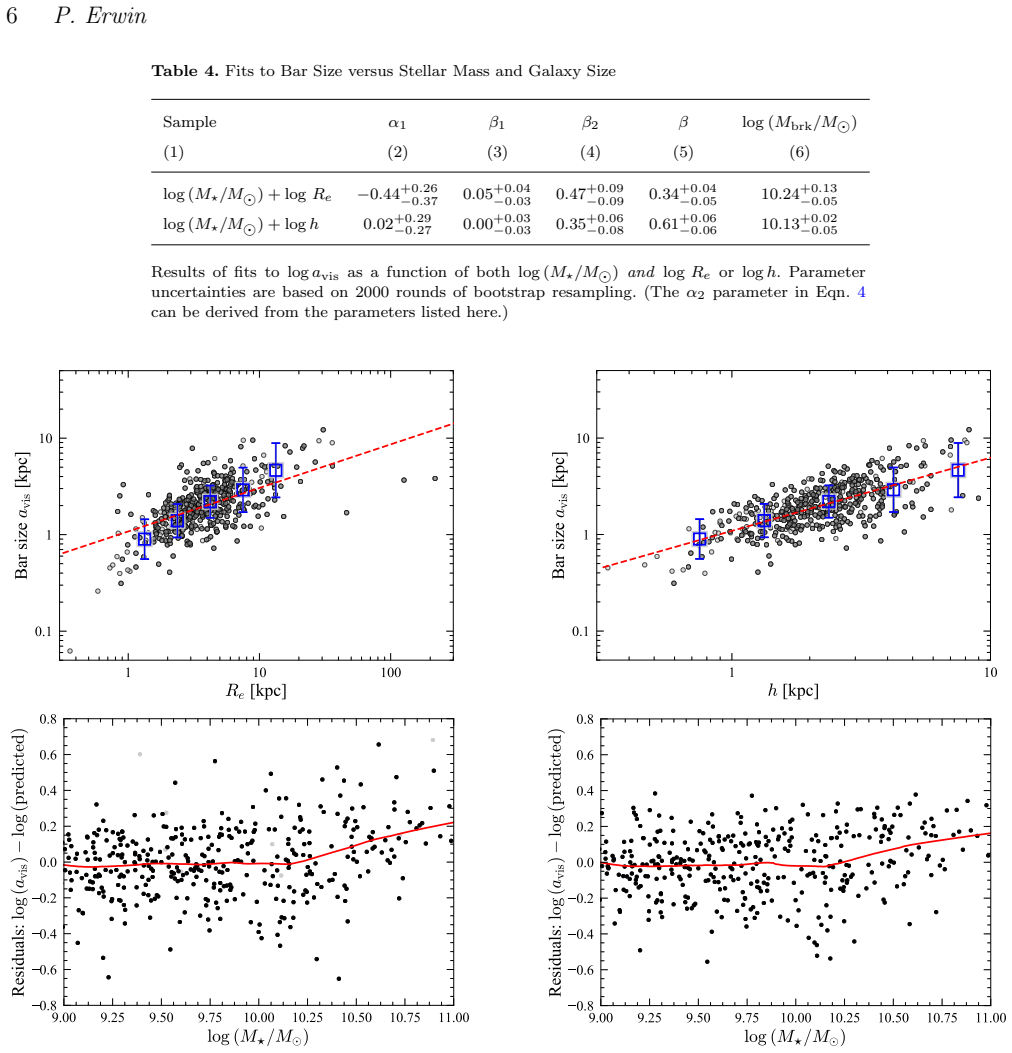
The load-bearing element is a broken-linear (bimodal) power-law fit in the $\log a_{\rm vis}$--$\log M_\star$ plane, extended to multi-variable fits of $\log a_{\rm vis}$ against $\log M_\star$ plus $\log R_e$ or $\log h$ (Eqns. 1 and 4). The break mass $M_{\rm brk}$ is a free parameter, so the bimodality is not imposed by hand; it emerges from the data and is checked by bootstrap resampling, Akaike information criterion comparisons, and bootstrap estimates of prediction error. Residual plots of the size-only fits against stellar mass give the decisive visual evidence that an extra mass term appears only above the break.
What would settle it
Re-fit the bar-size relations using independent size and mass estimates for the same galaxies (for example, effective radii from optical imaging or masses from dynamics rather than photometry) and check whether the residual slope of bar size versus stellar mass at fixed size remains about $0.35$--$0.47$ for $\log (M_\star/M_\odot) > 10.1$; if it drops to zero, the extra mass dependence is a correlated-error artifact.
Extended reading notes
Core claim
The central discovery, stated on the paper's own terms, is that the bar-size--stellar-mass relation in local disc galaxies is bimodal, with a break at $\log (M_\star/M_\odot) \simeq 10.1$--$10.2$: below the break $a_{\rm vis} \propto M_\star^{0.1}$, above it $a_{\rm vis} \propto M_\star^{0.6}$. Bar size is an even stronger function of galaxy size, $a_{\rm vis} \propto R_e^{0.45}$ and $a_{\rm vis} \propto h^{0.8}$, and the multi-variable fits of Table 4 show that once both size and mass are included, the residual mass slope below the break is consistent with zero while above the break it remains significant ($\beta_2 \simeq 0.35$--$0.47$). The author reads this as evidence that disc scale length is the primary structural determinant of bar size, that a separate mass-driven growth channel operates only in galaxies above roughly $10^{10.1}\,M_\odot$, and that the classical correlations with gas fraction and Hubble type are not independent of mass and size.
Load-bearing premise
The analysis treats stellar mass, half-light radius, and disc scale length as error-free predictors, even though all three are measured from the same near-infrared images of the same galaxies; if correlated measurement errors generate the residual high-mass dependence of bar size on mass, the most novel conclusion would not survive.
Editorial extensions
If this is right
- Bar-detectability corrections for large or high-redshift surveys cannot assume a single bar-size--mass scaling; the break at $\log (M_\star/M_\odot) \simeq 10.1$ means low-mass and high-mass bars fade out at different rates with distance.
- Disc scale length, not total stellar mass, is the primary structural control on bar size, so models of bar formation and growth should aim to reproduce $a \propto h^{0.8}$.
- Above the break, a more massive galaxy of the same size will host a longer bar, pointing to a mass-dependent growth process that operates only in the most massive discs.
- The absence of any residual bar-size dependence on present-day gas fraction or Hubble type means those classical correlations are not separate physical drivers.
- Barred galaxies are more extended than unbarred galaxies of the same mass, and larger bars mark larger discs, so bar presence and bar size can improve predictions of galaxy size from stellar mass.
Reading between the lines
- If the bimodal relation is real, then measurements of bar fraction versus redshift need a mass-dependent visibility correction that itself may evolve with the break mass; a constant-size detection threshold will bias high-redshift samples toward the most massive bars.
- The $a \propto h^{0.8}$ scaling invites a direct test in simulations: bar length should be a predictable multiple of the initial disc scale length, and mergers or disc heating that change $h$ should change bar size in the same proportion.
- A concrete check that goes beyond the paper's fits is to redo the multi-variable fits with independent sizes and masses (for example, optical effective radii and dynamical masses); this would separate a physical mass effect from correlated photometric errors.
- The null gas-fraction result does not necessarily mean gas never slows bar growth; it may mean present-day atomic gas fraction is a poor proxy for the gas content at the epoch of bar formation, a distinction simulations with time-evolving gas fractions could settle.
Signed reviews
Editorial analysis
A structured set of objections, weighed in public.
Referee Report
Summary. The paper presents an analysis of bar sizes (deprojected semi-major axes) in the S4G sample of nearby spiral galaxies, using volume- and mass-limited subsamples to measure how bar size depends on stellar mass, galaxy half-light radius, disc scale length, gas fraction, and Hubble type. The central claims are: (i) the bar-size--stellar-mass relation is bimodal, being nearly flat (slope ~0.1) below log M* ~ 10.1 and steep (slope ~0.6) above; (ii) bar size correlates more strongly with disc scale length (slope ~0.8) and half-light radius (slope ~0.45) than with stellar mass; (iii) after accounting for galaxy size, an additional residual dependence on stellar mass persists only for galaxies above the break mass, with slopes 0.35 (with h) and 0.47 (with Re) from the multivariate fits in Eq. (4) and Table 4; (iv) bar size shows no residual dependence on gas mass fraction or Hubble type after mass/size corrections; and (v) galaxy size can be modeled as a function of stellar mass, bar presence, and bar size. The analysis uses careful sample selection, bootstrap uncertainties, AIC comparison, and out-of-sample prediction errors, and the code and data are publicly available.
Significance. If the central claims hold, this is a valuable empirical contribution to understanding bar formation and growth: it identifies disc scale length as the dominant predictor of bar size and reveals a high-mass residual mass dependence that is not explained by galaxy size alone. The bimodality of the bar-size--mass relation, if real, is a new scaling relation that any model of bar evolution must reproduce, and the observed absence of a present-day gas-fraction dependence constrains theoretical expectations. The paper is careful in its sample selection (volume/mass-limited, inclination cuts), uses bootstrap resampling for parameter uncertainties, compares models with AIC and out-of-sample prediction errors, and ships reproducible code and data. These are genuine strengths. However, the novelty and importance of the result rest heavily on the high-mass residual mass dependence, which is the most vulnerable to systematic uncertainties in the measured predictors.
major comments (2)
- [Section 3.3, Eq. (4), Table 4] The central new result -- that bar size depends on stellar mass even after controlling for Re or h at log M* > 10.1 (beta2 = 0.35 +/- 0.06 with h, 0.47 +/- 0.09 with Re) -- is not robustly established because the predictor variables M*, Re, and h are all measured from the same S4G 3.6 micron images (Muse et al. 2015; Salo et al. 2015) and are treated as error-free. Correlated measurement errors among M*, Re, and h (e.g., a fluctuation that raises both the inferred stellar mass and the inferred disc scale length) can generate a spurious positive residual slope of bar size versus M* after removing h or Re. The 2000 bootstrap resamples resample galaxies, not measurement-noise realizations, so they cannot detect this effect. I request an explicit test: either propagate the published uncertainties on M*, Re, and h (including their covariance), or run a Monte Carlo simulation that adds correlated noise to these predictors and show that the recovered beta2 remains consistent with the reported values. Until this is done, the high-mass residual mass dependence should be treated as tentative rather than established, and this caveat should be stated in the abstract and summary.
- [Section 3.1, Eq. (1), Table 2] The bimodality of the bar-size--stellar-mass relation is quantified with a broken-linear fit that has an abrupt change in slope, and the model comparison is only between a single straight line and this broken linear form. A smooth transition (e.g., a bent power law with a finite transition width, or a low-order spline) might fit the data as well, which would change the physical interpretation from a distinct break to a gradual steepening. Moreover, the reported break mass (log M* ~ 10.1-10.2) is close to the break seen in the size--mass relation itself (Appendix A), so part of the apparent bimodality could be a projection of that underlying relation. The multivariate fits in Section 3.3 partially address this concern, but the paper should either test alternative functional forms or explicitly justify why an abrupt broken line is the physically preferred model.
minor comments (4)
- [Section 2.1.1] The assumption of a constant 10% fractional uncertainty on bar sizes is used to compute all AIC values. Since the same uncertainty is used for all fits, it does not affect relative AIC comparisons among the models, but the absolute AIC values are not meaningful if the true uncertainty differs substantially. It would be useful to state this explicitly and perhaps quote qualitative conclusions based on AIC deltas rather than absolute values.
- [Section 4.1] The statement that 'there is very little correlation' (Spearman r = 0.08, P = 0.11) is slightly undercut by the weak turn-up for very gas-rich galaxies that is mentioned in the same paragraph; the paper correctly notes this is in the opposite sense from the models, but the wording should be tightened to avoid appearing inconsistent.
- [Section 5, Eq. (5-6)] In the fits of galaxy size versus stellar mass and bar size, the binary variable B is defined as 0 for unbarred and 1 for barred galaxies. The model is fitted to all galaxies in the Main Spiral Sample, but for unbarred galaxies the bar size is undefined; it would be helpful to clarify that the product B * log(avis) is set to zero for unbarred galaxies, as the mathematical notation in Eq. (5-6) alone does not make this explicit.
- [Throughout] The paper is generally well written, but there are minor typos and formatting issues (e.g., 'Insitut' in the author affiliation, and some figure captions that use 'fi' ligatures). These do not affect the science.
Circularity Check
No significant circularity: the central scaling relations are empirical fits to independent S4G catalog data, not derivations that reduce to their own inputs.
full rationale
The paper's central results are empirical scaling relations fitted to published S4G catalog data, with stellar masses from Muñoz-Mateos et al. (2015), half-light radii and disc scale lengths from Salo et al. (2015), and bar sizes from Herrera-Endoqui et al. (2015). The bimodal slope values, break mass, and residual mass dependence are least-squares outputs, not inputs: the broken-linear relation in Eqn. 1 is motivated by LOESS and residual inspection and then fitted to the data, and the multi-variable model in Eqn. 4 is assessed against single-variable models using AIC and bootstrap validation. Bar size is not defined in terms of stellar mass or galaxy size, and the paper does not fit a parameter to one subset of data and then present a closely related quantity as an independent prediction. The bootstrap MSE computation is an honest internal predictive check, not a hidden reuse of fitted values. Self-citations to Paper I (Erwin 2018) are used for sample definitions, distance limits, and contextual arguments about bar detectability; they do not carry the scaling-law claims, which are re-derived from the catalog data and are consistent with prior independent work. Section 5's use of bar size to predict galaxy size is explicitly described by the paper as "a trivial inversion" of the empirical bar-size–galaxy-size relation, so it is not presented as an independent first-principles derivation and does not constitute circular reasoning. The possible correlation of measurement errors among M*, Re, h, and a_bar is a legitimate statistical robustness concern, but it is an error-propagation and correctness issue rather than a circularity of the derivation.
Assumptions & free parameters
free parameters (4)
- Slope of bar size vs stellar mass, low-mass branch (beta_1) =
0.10 +/- 0.04 (Parent Spiral)
- Slope of bar size vs stellar mass, high-mass branch (beta_2) =
0.59 +/- 0.08 (Parent Spiral)
- Break mass (log M_brk/M_sun) =
10.16 +/- 0.07 (Parent Spiral)
- Slope of bar size vs disc scale length (beta_h) =
0.76 +/- 0.06
assumptions (5)
- domain assumption The S4G Parent Spiral Sample (D<=30 Mpc, log M*=9-11) is representative of local spiral galaxies after excluding S0s and inclined systems.
- domain assumption Deprojected 'visual' bar semi-major axes from Herrera-Endoqui et al. (2015) are reliable measures of bar size; a constant 10% fractional uncertainty applies.
- domain assumption Present-day atomic gas mass fraction is a meaningful (if imperfect) tracer of the gas content relevant to bar formation; molecular gas corrections would not change the null result.
- ad hoc to paper Measurement errors in M*, Re, and h are negligible relative to the trends, and correlations among these errors do not generate the residual mass dependence.
- ad hoc to paper The broken-linear functional form adequately captures the true bar-size-mass relation; the break is not an artifact of the fitting function.
Cite this review
Pith. "Pith review of What Determines the Sizes of Bars in Spiral Galaxies?." pith.science (2026). https://pith.science/paper/A45JIJFM
@misc{pith2026190808423,
  author       = {Pith},
  title        = {Pith review of: What Determines the Sizes of Bars in Spiral Galaxies?},
  year         = {2026},
  howpublished = {\url{https://pith.science/paper/A45JIJFM}},
  note         = {Machine review of arXiv:1908.08423}
}
abstract
I use volume- and mass-limited subsamples and recently published data from the Spitzer Survey of Stellar Structure in Galaxies (S4G) to investigate how the size of bars depends on galaxy properties. The known correlation between bar semi-major-axis $a$ and galaxy stellar mass (or luminosity) is actually *bimodal*: for $\log M_{\star} < 10.1$, bar size is almost independent of stellar mass ($a \propto M_{\star}^{0.1}$), while it is a strong function for higher masses ($a \propto M_{\star}^{0.6}$). Bar size is a slightly stronger function of galaxy half-light radius $r_{e}$ and (especially) exponential disc scale length $h$ ($a \propto h^{0.8}$). Correlations between stellar mass and galaxy size can explain the bar-size--$M_{\star}$ correlation -- but only for galaxies with $\log M_{\star} < 10.1$; at higher masses, there is an extra dependence of bar size on $M_{\star}$ itself. Despite theoretical arguments that the presence of gas can affect bar growth, there is no evidence for any residual dependence of bar size on (present-day) gas mass fraction. The traditional dependence of bar size on Hubble type (longer bars in early-type discs) can be explained as a side-effect of stellar-mass--Hubble-type correlations. Finally, I show that galaxy size ($r_{e}$ or $h$) can be modeled as a function of stellar mass and both bar presence and bar size: barred galaxies tend to be more extended than unbarred galaxies of the same mass, with larger bars correlated with larger sizes.
Figures


Figures from the paper (6 more)


Reference graph
Works this paper leans on
-
[1]
Aguerri J. A. L., M \'e ndez-Abreu J., Corsini E. M., 2009, , 495, 491
work page 2009
- [2]
-
[3]
Astropy Collaboration et al., 2013, , 558, A33
2013
-
[4]
Athanassoula E., 2002, ApJL, 569, L83
work page 2002
-
[5]
Athanassoula E., 2003, MNRAS, 341, 1179
work page 2003
-
[6]
Athanassoula E., Machado R. E. G., Rodionov S. A., 2013, , 429, 1949
work page 2013
-
[7]
Berentzen I., Heller C. H., Shlosman I., Fricke K. J., 1998, MNRAS, 300, 49
work page 1998
-
[8]
Berentzen I., Shlosman I., Martinez-Valpuesta I., Heller C. H., 2007, ApJ, 666, 189
work page 2007
Show all 53 references
-
[9]
Boselli A., Cortese L., Boquien M., Boissier S., Catinella B., Lagos C., Saintonge A., 2014, , 564, A66
2014
-
[10]
Bournaud F., Combes F., Semelin B., 2005, , 364, L18
2005
-
[11]
S., Valluri M., Shen J., Debattista V
Brown J. S., Valluri M., Shen J., Debattista V. P., 2013, , 778, 151
2013
-
[12]
J., et al., 2015, ApJS, 217, 32
Buta R. J., et al., 2015, ApJS, 217, 32
2015
-
[13]
Cappellari M., 2014, CAP\_LOESS\_1D & CAP\_LOESS\_2D: Recover mean trends from noisy data , Astrophysics Source Code Library
2014
-
[14]
Cappellari M., et al., 2013, , 432, 1862
2013
-
[15]
P., Sellwood J
Debattista V. P., Sellwood J. A., 1998, , 493, L5
1998
-
[16]
P., Sellwood J
Debattista V. P., Sellwood J. A., 2000, , 543, 704
2000
-
[17]
P., Mayer L., Carollo C
Debattista V. P., Mayer L., Carollo C. M., Moore B., Wadsley J., Quinn T., 2006, ApJ, 645, 209
2006
-
[18]
D \' az-Garc \' a S., Salo H., Laurikainen E., Herrera-Endoqui M., 2016a, , 587, A160
-
[19]
D \' az-Garc \' a S., Salo H., Laurikainen E., 2016b, , 596, A84
-
[20]
Dubinski J., Berentzen I., Shlosman I., 2009, , 697, 293
2009
-
[21]
G., Elmegreen D
Elmegreen B. G., Elmegreen D. M., 1985, , 288, 438
1985
-
[22]
Erwin P., 2005, MNRAS, 364, 283
2005
-
[23]
Erwin P., 2018, , 474, 5372
2018
-
[24]
Gavazzi G., et al., 2015, , 580, A116
2015
-
[25]
Springer Series in Statistics, New York: Springer
Hastie T., Tibshirani R., Friedman J., 2009, The Elements of Statistical Learning: Data Mining, Inference, and Prediction, 2nd Ed. . Springer Series in Statistics, New York: Springer
2009
-
[26]
D., 1992, , 400, 80
Hernquist L., Weinberg M. D., 1992, , 400, 80
1992
-
[27]
Herrera-Endoqui M., D \' az-Garc \' a S., Laurikainen E., Salo H., 2015, A&A, 582, A86
2015
-
[28]
Hohl F., 1971, , 168, 343
1971
-
[29]
Holley-Bockelmann K., Weinberg M., Katz N., 2005, , 363, 991
2005
-
[30]
Hoyle B., et al., 2011, , 415, 3627
2011
-
[31]
Jones E., Oliphant T., Peterson P., et al., 2001--, SciPy : Open source scientific tools for Python , http://www.scipy.org/
2001
-
[32]
D., Combes F., 2018, , 609, A60
Khoperskov S., Haywood M., Di Matteo P., Lehnert M. D., Combes F., 2018, , 609, A60
2018
-
[33]
H., Erroz-Ferrer S., Roa J., Bakos J., Cisternas M., Leaman R., Szymanek N., 2014, , 569, A91
Knapen J. H., Erroz-Ferrer S., Roa J., Bakos J., Cisternas M., Leaman R., Szymanek N., 2014, , 569, A91
2014
-
[34]
Kormendy J., 1979, ApJ, 227, 714
1979
-
[35]
Kraljic K., Bournaud F., Martig M., 2012, ApJ, 757, 60
2012
-
[36]
H., Peletier R
Laine S., Shlosman I., Knapen J. H., Peletier R. F., 2002, , 567, 97
2002
-
[37]
Lange R., et al., 2015, , 447, 2603
2015
-
[38]
H., 2007, , 381, 401
Laurikainen E., Salo H., Buta R., Knapen J. H., 2007, , 381, 401
2007
-
[39]
Marinova I., Jogee S., 2007, , 659, 1176
2007
-
[40]
Martin P., 1995, , 109, 2428
1995
-
[41]
H., Scoville N
Men \'e ndez-Delmestre K., Sheth K., Schinnerer E., Jarrett T. H., Scoville N. Z., 2007, ApJ, 657, 790
2007
-
[42]
C., et al., 2015, , 219, 3
Mu \ n oz-Mateos J. C., et al., 2015, , 219, 3
2015
-
[43]
Salo H., et al., 2015, , 219, 4
2015
-
[44]
A., 2013, , 432, L56
S \'a nchez-Janssen R., Gadotti D. A., 2013, , 432, L56
2013
-
[45]
J., White S
Shen S., Mo H. J., White S. D. M., Blanton M. R., Kauffmann G., Voges W., Brinkmann J., Csabai I., 2003, , 343, 978
2003
-
[46]
Sheth K., et al., 2010, , 122, 1397
2010
-
[47]
M., Elmegreen B
Sheth K., Melbourne J., Elmegreen D. M., Elmegreen B. G., Athanassoula E., Abraham R. G., Weiner B. J., 2012, , 758, 136
2012
-
[48]
Spinoso D., Bonoli S., Dotti M., Mayer L., Madau P., Bellovary J., 2017, , 465, 3729
2017
-
[49]
Valenzuela O., Klypin A., 2003, , 345, 406
2003
-
[50]
Villa-Vargas J., Shlosman I., Heller C., 2010, , 719, 1470
2010
-
[51]
Wegg C., Gerhard O., Portail M., 2015, , 450, 4050
2015
-
[52]
D., Katz N., 2002, , 580, 627
Weinberg M. D., Katz N., 2002, , 580, 627
2002
-
[53]
D., Katz N., 2007, , 375, 460
Weinberg M. D., Katz N., 2007, , 375, 460
2007
Reviewed August 14, 2026 · model on record in the stance chip above.
Discussion (0). Continue with ORCID to comment.