REVIEW 3 major objections 6 minor 9 references
Dynamic 3D Tomographic X-ray Data of Ladybug
T0 review · 3 major / 6 minor · reviewed 2026-08-14 · deepseek-v4-flash
Pith's one-line read This paper documents an open 3D cone-beam CT dataset of a ladybug: eight 360-projection sinograms with shared acquisition geometry, intended for dynamic tomography research.
desk verdict A genuinely open dynamic CT dataset that is useful as a benchmark, but its documentation has a self-contradictory geometry section that must be corrected before anyone can use the data quantitatively. read the letter →
The pith
A machine-rendered reading of the paper's core claim, the machinery that carries it, and where it could break.
The reading
What carries the argument
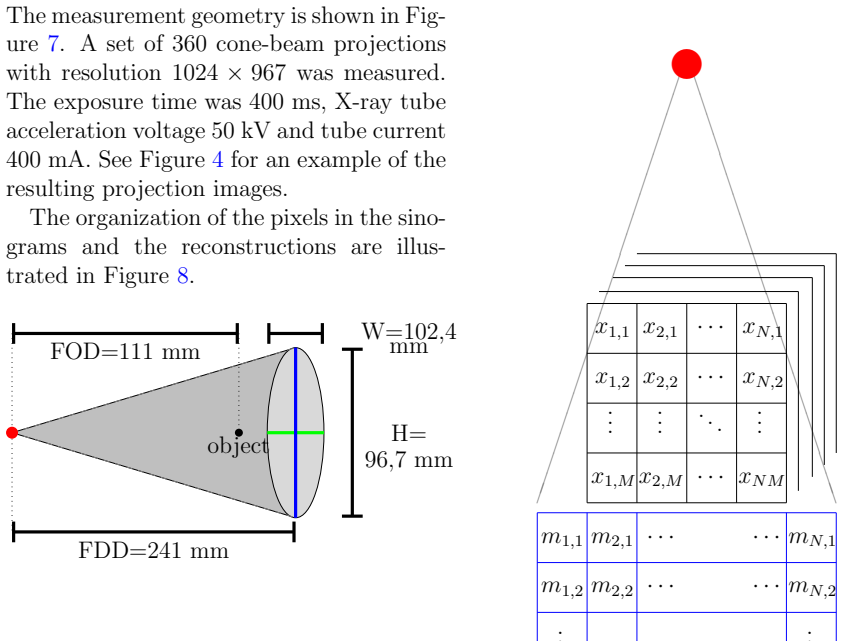
The central object is the three-dimensional cone-beam sinogram array: for each scan, a $1024\times360\times186$ matrix whose dimensions record detector width, number of projection angles, and selected central detector rows. It carries the argument because every reconstruction depends on this arrangement, on the log-normalization, and on the stated geometry (FOD, FDD, pixel size, row selection). The eight arrays, all taken with the same angular sampling from different starting positions, are what let a user build either individual measurement matrices or a stacked dynamic model.
What would settle it
Reconstruct all eight sinograms with filtered backprojection using the stated geometry and compare the recovered physical size of the ladybug's shell with the specimen's known size; a clear scale mismatch would show that the documented FOD, FDD, or pixel size is incorrect.
Extended reading notes
Core claim
The paper's central claim is that the eight released files sinogram1.mat through sinogram8.mat each hold a log-normalized 3D cone-beam sinogram of a ladybug, acquired at 50 kV with 360 projections, a focus-to-object distance of 111 mm, a focus-to-detector distance of 241 mm, and 48 µm detector pixels, and that only the central 186 of the 967 detector rows were kept. These eight measurements of the same object at different starting positions are intended to be enough to assemble a dynamic CT model $Ax=m$, or a stacked dynamic version, using standard tomography toolboxes. The documentation is thus the specification that makes the data usable for quantitative reconstruction.
Load-bearing premise
The load-bearing premise is that the written geometry (FOD=111 mm, FDD=241 mm, 48 µm pixel size, central 186 of 967 rows) is the true acquisition geometry, because every quantitative reconstruction from the data depends on these numbers.
Editorial extensions
If this is right
- Each sinogram can be used as the right-hand side of the CT model $Ax=m$, giving a 3D reconstruction from 360 cone-beam projections.
- Taking subsets of the 360 projections yields sparse-view data, which the paper notes is useful for studying reduced radiation dose and measurement time.
- Because all eight scans use the same projection angles, the data can be stacked into a dynamic system with eight entries, following the paper's dynamic-model suggestion.
- The explicit geometry and detector-row selection allow the same data to be reconstructed with different toolboxes, making the set a shared comparison point.
Reading between the lines
- A natural extension not stated in the paper: the eight scans of the same specimen can also serve as a repeatability set for registration and alignment methods, since scan-to-scan variation includes real positioning differences.
- Because the sinograms keep only 186 of 967 detector rows, an indirect test of the data is to reconstruct with two independent toolboxes and compare the central slices; large discrepancies would point to a row-selection or geometry mismatch.
- One could reinterpret the eight starting positions as quasi-static frames of an object being reoriented, giving a surrogate time-lapse sequence for benchmarking motion-aware reconstruction, though the paper does not claim the ladybug moved during a single scan.
Signed reviews
Editorial analysis
A structured set of objections, weighed in public.
Referee Report
Summary. This paper documents an open X-ray computed tomography dataset of a ladybug, deposited on Zenodo, consisting of eight 3D cone-beam sinograms of dimensions 1024 x 360 x 186, acquired with 360 projections using a Procon X-ray CT portable device. The authors specify the measurement geometry (FOD=111 mm, FDD=241 mm, detector height H=96.7 mm, width W=102.4 mm), describe the sinogram organization, and give the linear model Ax=m for reconstruction with toolboxes such as ASTRA and opTomo. The paper also reports acquisition parameters including 50 kV voltage, 400 ms exposure, and a tube current of 400 mA, and states that the sinograms were logarithmically transformed and normalized.
Significance. If the stated geometry is correct, this dataset is a potentially valuable open benchmark for dynamic and sparse-view cone-beam tomography, complementing existing public CT data with a biological specimen and repeat measurements from eight starting positions. The paper makes no derived predictions or fitted parameters, so circularity is not an issue; its value lies entirely in the released data and its documentation. The explicit file naming, stated array dimensions, and the intended use with standard toolboxes are strengths. However, the dataset's usability for quantitative reconstruction hinges on the accuracy and unambiguous reporting of the acquisition geometry, and the current manuscript contains a geometry inconsistency and an implausible tube-current value that must be corrected before the dataset can be used reliably.
major comments (3)
- [Section 3, Figure 7] The detector pixel size is stated as 48 µm, but the detector dimensions given in Figure 7 (W=102.4 mm, H=96.7 mm) imply a pixel pitch of about 100 µm: 1024 columns × 100 µm = 102.4 mm and 967 rows × 100 µm = 96.7 mm. With the stated 48 µm pixel size, 1024 columns correspond to 49.15 mm, a factor of two discrepancy. If the 48 µm value is the effective pixel size in the object plane rather than on the detector, the paper should say so explicitly and give the detector pixel pitch (approximately 100 µm) that users must enter into ASTRA or opTomo. Without this clarification, the geometry required for quantitative reconstruction from the 1024-column sinograms is ambiguous.
- [Section 3, exposure parameters] The reported tube current of 400 mA at 50 kV implies an electrical input power of 20 kW, which is inconsistent with the stated 50 W maximum tube output. This is likely a typographical error (for instance, 400 µA), but as written it reduces confidence in the reliability of the entire parameter list. The authors should correct the value and verify that all acquisition parameters are mutually consistent.
- [Sections 2 and 3] The paper provides no validation or calibration measurements, such as a scan of a known phantom or a reconstruction quality assessment, that would confirm the stated geometry. For a dataset intended to support quantitative tomographic reconstruction, at least one reconstruction performed with the reported geometry should be shown, along with a quantitative measure of data consistency or a calibration scan. This would help resolve the pixel-size ambiguity and demonstrate that the released sinograms can be accurately reconstructed with the documented parameters.
minor comments (6)
- [Figure 2 caption] The caption contains the informal phrase "Please mention" and should be rewritten as an indicative sentence, for example: "These reconstructions are shown only for visualization of the different starting positions."
- [Abstract] The abstract says the data is "available here" without a visible hyperlink; the full Zenodo URL should be given in the text.
- [Section 1, last paragraph] The grammar in "It can be also possible that the scanning angle is limited" is awkward; consider rephrasing to "It is also possible that the scanning angle is limited."
- [Section 3] The paper does not state whether dark-field and flat-field corrections were applied before the logarithmic transform and normalization; the normalization procedure should be described explicitly so that users can interpret the sinogram values.
- [Figure 7] The dimensions in Figure 7 use a comma as a decimal separator (96,7 mm, 102,4 mm), which is inconsistent with the decimal point used in the text; please use a uniform notation.
- [References] Reference [4] has an extra comma between the author list and "and J. Sijbers"; this should be cleaned up.
Circularity Check
No circularity: the paper is a data documentation note with no derived predictions or fitted parameters.
full rationale
The paper reports an acquired 3D cone-beam CT dataset of a ladybug and documents its contents, geometry, and file organization. It contains no derivation chain, no model prediction, and no fitted parameter that is later called a result. The only quantitative claims are the measured geometry (FOD=111 mm, FDD=241 mm, 48 micron pixel size, 1024 x 967 images, 360 projections) and the dimensions of the released sinograms (1024 x 360 x 186). These are statements about the measurement and data files, not outputs derived from the data. The references to ASTRA, opTomo, and standard CT models are external tools and textbook formulations, not self-citations that supply the paper's content. The reader-flagged inconsistency between the stated 48 micron pixel size and the Figure 7 detector width/height is a potential data-quality or documentation-accuracy issue; it is not a circularity issue because nothing is 'predicted' from those numbers within the paper. Accordingly, no circular step exists, and the circularity score is 0.
Assumptions & free parameters
assumptions (3)
- domain assumption The CT measurement model Ax = m (Eq. 1) describes the cone-beam projection process.
- domain assumption The reported measurement geometry (FOD=111 mm, FDD=241 mm, 48 µm pixel size, 186 selected detector rows) exactly matches the actual acquisition.
- domain assumption The sinograms were correctly log-transformed and normalized, so the data represents line integrals.
Cite this review
Pith. "Pith review of Dynamic 3D Tomographic X-ray Data of Ladybug." pith.science (2026). https://pith.science/paper/357CXRQO
@misc{pith2026190808782,
  author       = {Pith},
  title        = {Pith review of: Dynamic 3D Tomographic X-ray Data of Ladybug},
  year         = {2026},
  howpublished = {\url{https://pith.science/paper/357CXRQO}},
  note         = {Machine review of arXiv:1908.08782}
}
read the original abstract
This is the documentation of the 3D dynamic tomographic X-ray (CT) data of a ladybug. The open data set is available https://zenodo.org/record/3375488#.XV_T3vxS9oA and can be freely used for scientific purposes with appropriate references to the data and to this document in http://arxiv.org/
Figures


Figures from the paper (3 more)


Reference graph
Works this paper leans on
-
[1]
Cerebral aneurysms: detection and delineation using 3-d-ct angiography.,
S. Aoki, Y. Sasaki, T. Machida, T. Ohkubo, M. Minami, and Y. Sasaki, “Cerebral aneurysms: detection and delineation using 3-d-ct angiography.,” American Journal of Neuroradiology , vol. 13, no. 4, pp. 1115–1120, 1992
work page 1992
-
[2]
Dynamic 2d ultrasound and 3d ct image registration of the beat- ing heart,
X. Huang, J. Moore, G. Guiraudon, D. L. Jones, D. Bainbridge, J. Ren, and T. M. Peters, “Dynamic 2d ultrasound and 3d ct image registration of the beat- ing heart,” IEEE Transactions on Medi- cal Imaging, vol. 28, pp. 1179–1189, Aug 2009
work page 2009
-
[3]
E. Y. Sidky and X. Pan, “Image reconstruction in circular cone-beam computed tomography by constrained, total-variation minimization,” Physics in Medicine & Biology , vol. 53, no. 17, p. 4777, 2008
work page 2008
-
[4]
The astra toolbox: A platform for advanced algo- rithm development in electron tomogra- phy,
W. van Aarle, W. J. Palenstijn, J. D. Beenhouwer, T. Altantzis, S. Bals, K. J. Batenburg, , and J. Sijbers, “The astra toolbox: A platform for advanced algo- rithm development in electron tomogra- phy,” Ultramicroscopy, vol. 157, pp. 35 – 47, 2015
work page 2015
-
[5]
Fast and flexible x-ray tomography using the astra toolbox,
W. van Aarle, W. J. Palenstijn, J. Cant, E. Janssens, F. Bleichrodt, A. Dabravol- ski, J. D. Beenhouwer, K. J. Batenburg, and J. Sijbers, “Fast and flexible x-ray tomography using the astra toolbox,” Optics Express , vol. 24(22), pp. 25129 – 25147, 2016
work page 2016
-
[6]
Principles of computerized tomo- graphic imaging,
A. C. Kak, M. Slaney, and G. Wang, “Principles of computerized tomo- graphic imaging,” Medical Physics , vol. 29, no. 1, pp. 107–107, 2002
work page 2002
-
[7]
T. M. Buzug, “Computed tomography,” in Springer Handbook of Medical Tech- nology, pp. 311–342, Springer, 2011
work page 2011
-
[8]
J. L. Mueller and S. Siltanen, Lin- ear and nonlinear inverse problems with practical applications , vol. 10. Siam, 2012
work page 2012
Show all 9 references
-
[9]
Space-time tomography for continu- ously deforming objects,
G. Zang, R. Idouchi, R. Tao, G. Lu- bineau, P. Wonka, and W. Heidrich, “Space-time tomography for continu- ously deforming objects,” ACM Trans- actions on Graphics (TOG) , vol. 37, no. 4, p. 100, 2018. 6
2018
Reviewed August 14, 2026 · model on record in the stance chip above.
Discussion (0). Continue with ORCID to comment.