REVIEW 3 major objections 7 minor 73 references
Football is becoming more predictable; Network analysis of 88 thousands matches in 11 major leagues
T0 review · 3 major / 7 minor · reviewed 2026-08-14 · deepseek-v4-flash
Pith's one-line read Top-division European football has become more predictable over the 26 seasons from 1993-94 to 2018-19.
desk verdict A useful panel measurement of football predictability, but the headline trend may be an artifact of the paper's decision to drop draws; worth refereeing, not taking at face value. read the letter →
The pith
A machine-rendered reading of the paper's core claim, the machinery that carries it, and where it could break.
The reading
What carries the argument
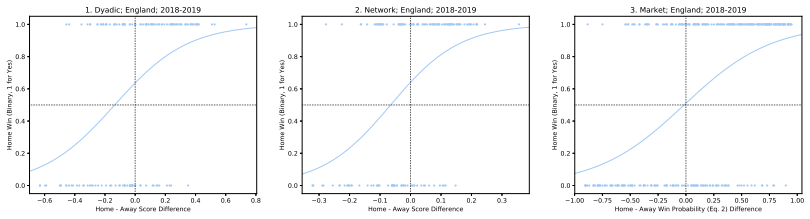
The central mechanism is a directed match network whose eigenvector centrality serves as a self-contained team-strength rating. In the network, each edge points from the loser to the winner and is weighted by the points the winner earned, and a team's eigenvector centrality reflects not only how often it wins but how strong its beaten opponents are—a team is central if it beats teams that are themselves central. The difference between the home and away teams' centrality scores is the single input to a logistic regression, and the area under that regression's ROC curve on matches outside the training window is the paper's operational measure of predictability. The model is intentionally simple and time-consistent: it uses only past results and fixed parameters, so any historical trend in its AUC reflects changes in the game itself rather than improvements in the predictor.
What would settle it
Re-run the same centrality-based model on all 87,816 matches using three outcomes—home win, draw, and away win—and compare the AUC trend with the paper's two-outcome trend; if the rise in predictability disappears once draws are included, the central claim is specific to decisive matches, not to football generally.
Extended reading notes
Core claim
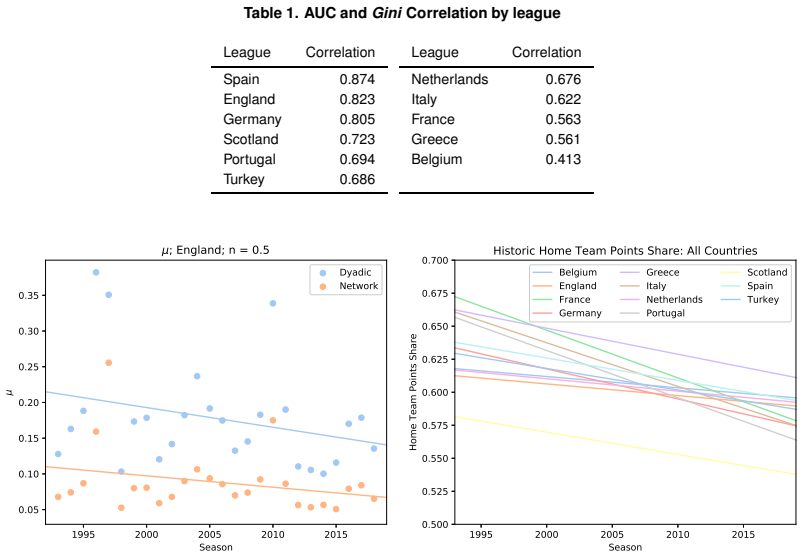
The central claim is that football's results have become easier to anticipate, not just that some teams are stronger. The authors define predictability as the out-of-sample AUC of a fixed, past-results-only model, so an upward trend in AUC means the same simple predictor extracts more information from recent results now than it did in the 1990s. They find that seven of the eleven leagues studied show increasing AUC over the sample, Greece and Turkey show the opposite but with recent increases, Belgium and Italy are stable, and the leagues tend to converge near 0.75 AUC. The paper also shows that the Gini coefficient of end-of-season points is positively correlated with AUC in every league, and that home-field advantage, measured both by the model's logistic offset and by the historical share of home points, has declined in all eleven leagues. It explicitly does not claim to have established the monetary cause of these trends.
Load-bearing premise
The load-bearing assumption is that removing drawn matches does not distort the historical comparison; if draws changed in frequency or predictability over 26 years, the upward trend measured on matches with a winner may not describe football as a whole.
Editorial extensions
If this is right
- Because the prediction model uses only past results and its parameters are fixed, the rising AUC cannot be attributed to smarter forecasting; the same simple model has become a better predictor of future results over time.
- The positive correlation between AUC and Gini coefficient in all 11 leagues indicates that inequality in final points and predictability move together, so leagues with more concentrated results are also the leagues where outcomes are easier to forecast.
- The universal decline in home-field advantage means that home status contributes less to match outcomes than it used to, which reduces the number of matches a weaker team can win simply by playing at home.
- The observed convergence of league AUC values near 0.75 means that differences between leagues in how predictable their results are have shrunk even while the overall level of predictability has risen.
Reading between the lines
- A direct test of the tie-removal assumption would be to include draws as a third outcome; if the AUC trend disappears, the paper's result holds only for matches with a winner, not for football as a whole.
- The paper's gentrification feedback loop can be tested with club finances: within a league, seasons with larger gaps in wage bills or transfer spending between top and bottom clubs should show higher AUC than seasons with smaller gaps.
- Because the methodology is sport-agnostic, applying the same network-AUC measure to leagues with salary caps would disentangle whether the predictability trend comes from unrestricted spending or from something intrinsic to football; the paper names this comparison as future work.
- The model's own home-advantage parameter offers a way to separate the two trends the paper reports: a regression of league-season AUC on league-season home advantage would show whether the shrinking home boost is actually one of the mechanisms making results easier to predict.
Signed reviews
Editorial analysis
A structured set of objections, weighed in public.
Referee Report
Summary. This paper uses 87,816 matches from eleven top European leagues between the 1993/94 and 2018/19 seasons to ask whether football outcomes have become more predictable. The authors build two self-contained models—a simple points-share difference and a network eigenvector-centrality score computed from past matches—and benchmark them against Bet365 odds. After excluding drawn matches, they fit a logistic regression of home-win/away-win on the score difference and measure predictive performance with the Brier score and AUC. They report a general upward trend in per-season AUC (with Greece and Turkey as exceptions), convergence toward AUC around 0.75, a positive correlation between AUC and the Gini coefficient of season points, and a decreasing home-field advantage across all leagues, which they interpret as consistent with a 'gentrification' of football.
Significance. The study is a valuable first large-scale, historically consistent attempt to quantify predictability in football with a simple network-based model, and the public data source and fixed model specification make the approach transparent and reproducible in principle. The decline in home-field advantage is a robust and interesting side result. However, the central trend claim currently rests on an unconditioned two-class analysis of non-draw matches and on visually assessed time trends without inferential support; these issues must be resolved before the main conclusion can be accepted.
major comments (3)
- [Modelling predictability] The decisive modelling choice is to 'limit our analysis to the matches that have a winner and eliminate the ties from the entirety of this study.' Because draws are a large, non-random fraction of football matches, removing them can change the apparent difficulty of the classification problem even if the full three-outcome distribution is unchanged: if the draw rate fell over time, the retained subset would contain progressively more lopsided matches, and AUC on that subset could rise mechanically. The paper never reports draw rates by league and season, never estimates a three-outcome (home/draw/away) model, and never checks whether the reported AUC trend survives adjustment for draw frequency. The authors should add these analyses or explicitly demonstrate that the non-draw AUC trend is not an artefact of selection.
- [Results and Discussion: Predictability over Time] The central 'becoming more predictable' claim is supported only by lowess curves and visual inspection in Figure 4. AUC for a single league-season is estimated from a few hundred matches and will carry substantial sampling noise, yet no confidence intervals, trend coefficients, significance tests, or adjustments for temporal autocorrelation are reported. The authors should supply formal trend estimates for each league (for example, regression or rank-based trend tests with season as the covariate) and, given the autocorrelated series, a time-series-aware inference procedure. The statement that 'all leagues tend to converge towards 0.75 AUC' likewise needs quantitative support.
- [Model Performance] The text says the models and the betting-market benchmark are 'statistically indistinguishable at the 2% significance level for the majority of year-leagues,' but Tables S1 and S2 contradict this. In Table S2, eight of eleven AUC comparisons between the Network model and the Market are significant at p<0.02 (England, Germany, Spain, Italy, Portugal, Netherlands, Belgium, France), all favouring the market, and several Brier-score comparisons are also significant at the 2% level. This is an internal inconsistency in a passage used to justify the model as a reliable measurement tool. The comparison should be re-run or, at minimum, described accurately in the text.
minor comments (7)
- [Modelling predictability, Eq. (1)] Logistic-regression parameters are not obtained by 'ordinary least squares methods'; the standard estimation is maximum likelihood via iteratively reweighted least squares. Please correct the wording.
- [Fig. 1 caption] The caption says the network is shown 'after 240 matches have been played for n = 0.5' but also says the centrality is calculated from 'the last 190 matches'; for a 380-match season, n = 0.5 gives 190 matches, so one of these numbers is wrong.
- [Fig. 4] Please state the smoothing span used for the lowess fits and clarify whether the plotted points are raw per-season values or smoothed values; the dual-axis display currently makes it hard to assess the data behind the curves.
- [Table 1] The AUC–Gini correlations need a stated method (Pearson or Spearman; raw or smoothed series) and confidence intervals or p-values; the value 0.413 for Belgium should be described as weak-to-moderate, not 'high.'
- [Eq. (2)] Because draws are excluded, the market probabilities in Eq. (2) are conditional on no draw; please state this explicitly, since the raw Bet365 odds include a third outcome and the normalization is not the usual three-outcome calibration.
- [Conclusion] The limitations paragraph acknowledges data volume and model sophistication but omits the draw-exclusion choice, which is the most consequential modelling decision for the main claim; this should be discussed and, ideally, checked.
- [Throughout] There are numerous typos and OCR-like artifacts (for example, 'predictibility' in the Results section, '88 thousands' in the title/abstract, 'Ho e Points' in Figure S8, 'T urkey' in Table 1) that a careful proofreading pass should remove.
Circularity Check
No significant circularity: the central AUC measure is self-contained, externally benchmarked, and not equivalent to its inputs by construction.
full rationale
No significant circularity found. The central measure, AUC of a binary home-win/away-win classifier, is computed from features (score differences built from past matches) and outcomes (the result of the match being evaluated), so the target variable is not an input to the feature construction. The logistic regression in Eq. 1 is a standard fit; the network model uses eigenvector centrality from previous results; and the betting-market benchmark in Eq. 2 is external to the authors' models. The Gini coefficient is reported as a correlate of the AUC trend, not as a fitted input that defines or forces the AUC. The paper's decision to exclude draws is a validity limitation rather than a circular step: the AUC trend is defined on the non-draw subset, so the conclusion is conditional on that subset, but the measure is not equivalent to its inputs by construction. The paper's own limitation statements in the Conclusion, concerning sample size and deliberately simple self-contained models, are acknowledged scope restrictions rather than admissions of circular reasoning. Self-citations are not load-bearing; the cited centrality and Gini methods are standard external results, and the market benchmark provides an independent reference point. The reported trend, even if debatable on selection-bias grounds, follows from an empirical calculation rather than from a definitional tautology or a fitted-parameter-as-prediction step.
Assumptions & free parameters
free parameters (2)
- Training window fraction n =
0.5 (main analysis); robustness at 0.1, 0.3, 0.7, 0.9 in SI
- Logistic regression parameters (mu, s) =
Per league, season, and model
assumptions (5)
- domain assumption The football-data.co.uk database is accurate, time-consistent, and free of systematic bias across 11 leagues and 26 seasons.
- domain assumption Drawn matches can be removed without biasing the measurement of predictability.
- domain assumption Eigenvector centrality on the loser-to-winner directed network is a valid proxy for team strength.
- domain assumption Normalized Bet365 odds provide a good estimate of state-of-the-art market probability.
- standard math A logistic function adequately links team-strength difference to win probability.
Cite this review
Pith. "Pith review of Football is becoming more predictable; Network analysis of 88 thousands matches in 11 major leagues." pith.science (2026). https://pith.science/paper/H3IN7PX2
@misc{pith2026190808991,
  author       = {Pith},
  title        = {Pith review of: Football is becoming more predictable; Network analysis of 88 thousands matches in 11 major leagues},
  year         = {2026},
  howpublished = {\url{https://pith.science/paper/H3IN7PX2}},
  note         = {Machine review of arXiv:1908.08991}
}
read the original abstract
In recent years excessive monetization of football and professionalism among the players has been argued to have affected the quality of the match in different ways. On the one hand, playing football has become a high-income profession and the players are highly motivated; on the other hand, stronger teams have higher incomes and therefore afford better players leading to an even stronger appearance in tournaments that can make the game more imbalanced and hence predictable. To quantify and document this observation, in this work we take a minimalist network science approach to measure the predictability of football over 26 years in major European leagues. We show that over time, the games in major leagues have indeed become more predictable. We provide further support for this observation by showing that inequality between teams has increased and the home-field advantage has been vanishing ubiquitously. We do not include any direct analysis on the effects of monetization on football's predictability or therefore, lack of excitement, however, we propose several hypotheses which could be tested in future analyses.
Figures


Figures from the paper (2 more)

Reference graph
Works this paper leans on
-
[1]
Giulianotti R, Rollin J, Weil E, Joy B, Alegi P (2017) Footb all. encyclopedia britannica
work page 2017
-
[2]
Wilson B (2018) European football is worth a record £22bn, says deloitte
work page 2018
-
[3]
Ingle S, Glendenning B (2003) Baseball or football: which sport gets the higher attendance?
work page 2003
-
[4]
Journal of Economic Behavior & Organization 107:614–629
Choi D, Hui SK (2014) The role of surprise: Understanding o verreaction and underreaction to unanticipated events usi ng in-play soccer betting market. Journal of Economic Behavior & Organization 107:614–629
work page 2014
-
[5]
Statistica Neerlandica 36(3):109–118
Maher MJ (1982) Modelling association football scores. Statistica Neerlandica 36(3):109–118
work page 1982
-
[6]
Journal of the Royal Statistical Society: Series D (The Stat istician) 49(3):399–418
Rue H, Salvesen O (2000) Prediction and retrospective ana lysis of soccer matches in a league. Journal of the Royal Statistical Society: Series D (The Stat istician) 49(3):399–418
work page 2000
-
[7]
Journal of the Royal Statistical Society: Series C (Applied Statistics) 46(2):265–280
Dixon MJ, Coles SG (1997) Modelling association football scores and inefficiencies in the football betting market. Journal of the Royal Statistical Society: Series C (Applied Statistics) 46(2):265–280
work page 1997
-
[8]
Journal of the Royal Statistical Society: Series D (The Statistician) 51(2):157–168
Crowder M, Dixon M, Ledford A, Robinson M (2002) Dynamic mo delling and prediction of english football league matches f or betting. Journal of the Royal Statistical Society: Series D (The Statistician) 51(2):157–168
work page 2002
Show all 73 references
-
[9]
International Journal of forecasting 26(3):460–470
Hvattum LM, Arntzen H (2010) Using elo ratings for match re sult prediction in association football. International Journal of forecasting 26(3):460–470
2010
-
[10]
(Summersdale Publishers L TD-ROW)
Buchdahl J (2003) Fixed odds sports betting: Statistical forecasting and ris k management. (Summersdale Publishers L TD-ROW)
2003
-
[11]
Knowledge-Based Systems 36:322–339
Constantinou AC, Fenton NE, Neil M (2012) pi-football: A bayesian network model for forecasting association footba ll match outcomes. Knowledge-Based Systems 36:322–339
2012
-
[12]
Journal of Forecasting 23(1):51–66
Goddard J, Asimakopoulos I (2004) Forecasting football results and the efficiency of fixed-odds betting. Journal of Forecasting 23(1):51–66
2004
-
[13]
Applied Economics 32(11):1353–1363
Kuypers T (2000) Information and efficiency: an empirica l study of a fixed odds betting market. Applied Economics 32(11):1353–1363
2000
-
[14]
International Journal of forecasting 21(2):331–340
Goddard J (2005) Regression models for forecasting goal s and match results in association football. International Journal of forecasting 21(2):331–340
2005
-
[15]
International Journal of Forecasting 35(2):741–755
Baboota R, Kaur H (2019) Predictive analysis and modelli ng football results using machine learning approach for eng lish premier league. International Journal of Forecasting 35(2):741–755
2019
-
[16]
Science 362(6416):825–829
Fraiberger SP , Sinatra R, Resch M, Riedl C, Barabási AL (2 018) Quantifying reputation and success in art. Science 362(6416):825–829
-
[17]
Nature communications 10(1):2256
Williams OE, Lacasa L, Latora V (2019) Quantifying and pr edicting success in show business. Nature communications 10(1):2256
2019
-
[18]
(IEEE Press), pp
Cintia P , Coscia M, Pappalardo L (2016) The haka network: evaluating rugby team performance with dynamic graph analy sis in Proceedings of the 2016 IEEE/ACM International Conference on Advances in Social Networks Analysis and Mining . (IEEE Press), pp. 1095–1102
2016
-
[19]
PloS one 6(2):e17249
Radicchi F (2011) Who is the best player ever? a complex ne twork analysis of the history of professional tennis. PloS one 6(2):e17249
2011
-
[20]
EPJ Data Science 5(1):17
Y ucesoy B, Barabási AL (2016) Untangling performance fr om success. EPJ Data Science 5(1):17
2016
-
[21]
(2018) Effective injury forecasting in so ccer with gps training data and machine learning
Rossi A, et al. (2018) Effective injury forecasting in so ccer with gps training data and machine learning. PloS one 13(7):e0201264
2018
-
[22]
arXiv preprint arXiv:1802.04987
Pappalardo L, Cintia P , Ferragina P , Pedreschi D, Gianno tti F (2018) Playerank: Multi-dimensional and role-aware r ating of soccer player performance. arXiv preprint arXiv:1802.04987
2018 arXiv
-
[23]
Cintia P , Rinzivillo S, Pappalardo L (2015) A network-ba sed approach to evaluate the performance of football teams i n Machine learning and data mining for sports analytics works hop, Porto, Portugal
2015
-
[24]
arXiv preprint arXiv:1503.01331
Lazova V , Basnarkov L (2015) Pagerank approach to rankin g national football teams. arXiv preprint arXiv:1503.01331
2015 arXiv
-
[25]
Milanlouei S (2017) Fall in love with network science at fi rst sight!
2017
-
[26]
(Oxford university press)
Newman M (2018) Networks. (Oxford university press)
2018
-
[27]
American journal of sociology 92(5):1170–1182
Bonacich P (1987) Power and centrality: A family of measu res. American journal of sociology 92(5):1170–1182
1987
-
[28]
Reprinted in Memorie di metodologica statistica (Ed
Gini C (1912) Variabilità e mutabilità. Reprinted in Memorie di metodologica statistica (Ed. Pizet ti E, Salvemini, T). Rome: Libreria Eredi Virgilio Veschi
1912
-
[29]
The Economic Journal 31(121):124–126
Gini C (1921) Measurement of inequality of incomes. The Economic Journal 31(121):124–126
1921
-
[30]
Colorado College Publication, General Series 208:73–79
Gini C (1936) On the measure of concentration with specia l reference to income and statistics. Colorado College Publication, General Series 208:73–79
1936
-
[31]
International Journal of Performance Analysis in Sport 17(4):586–599
Pollard R, Prieto J, Gómez MÁ (2017) Global differences i n home advantage by country , sport and sex. International Journal of Performance Analysis in Sport 17(4):586–599
2017
-
[32]
Social forces 55(3):641–661
Schwartz B, Barsky SF (1977) The home advantage. Social forces 55(3):641–661
1977
-
[33]
Journal of sports sciences 4(3):237–248
Pollard R (1986) Home advantage in soccer: A retrospecti ve analysis. Journal of sports sciences 4(3):237–248
1986
-
[34]
The open sports sciences journal 1(1)
Pollard R (2008) Home advantage in football: A current re view of an unsolved puzzle. The open sports sciences journal 1(1)
2008
-
[35]
Advances in Complex Systems p
Pappalardo L, Cintia P (2017) Quantifying the relation b etween performance and success in soccer. Advances in Complex Systems p. 1750014
2017
-
[36]
Monthey Weather Review 78(1):1–3
Brier GW (1950) Verification of forecasts expressed in te rms of probability . Monthey Weather Review 78(1):1–3
1950
-
[37]
Pattern recognition letters 27(8):861–874
Fawcett T (2006) An introduction to roc analysis. Pattern recognition letters 27(8):861–874
2006
-
[38]
Radiology 148(3):839–843
Hanley JA, McNeil BJ (1983) A method of comparing the area s under receiver operating characteristic curves derived f rom the same cases. Radiology 148(3):839–843
1983
-
[39]
(2010) Small-sample precision of roc-r elated estimates
Hanczar B, et al. (2010) Small-sample precision of roc-r elated estimates. Bioinformatics 26(6):822–830
2010
-
[40]
Global ecology and Biogeography 17(2):145–151
Lobo JM, Jiménez-Valverde A, Real R (2008) Auc: a mislead ing measure of the performance of predictive distribution m odels. Global ecology and Biogeography 17(2):145–151
2008
-
[41]
Machine learning 77(1):103–123
Hand DJ (2009) Measuring classifier performance: a coher ent alternative to the area under the roc curve. Machine learning 77(1):103–123
2009
-
[42]
Ferri C, Hernández-Orallo J, Flach P A (2011) A coherent i nterpretation of auc as a measure of aggregated classificati on performance in Proceedings of the 28th International Conference on Machin e Learning (ICML-11). pp. 657–664
2011
-
[43]
Journal of Machine Learning Research 13(Oct):2813– 2869
Hernández-Orallo J, Flach P , Ferri C (2012) A unified view of performance metrics: translating threshold choice into expected classification loss. Journal of Machine Learning Research 13(Oct):2813– 2869. 7 Supporting Information Table S1. The t-Test values comparing the Brier s...
2012
-
[44]
Network 3
Dyadic 2. Network 3. Market Prediction Model 0.16 0.18 0.20 0.22 0.24Brier Score Brier Score; Belgium
-
[45]
Network 3
Dyadic 2. Network 3. Market Prediction Model 0.12 0.14 0.16 0.18 0.20 0.22 0.24Brier Score Brier Score; England
-
[46]
Network 3
Dyadic 2. Network 3. Market Prediction Model 0.16 0.18 0.20 0.22 0.24Brier Score Brier Score; France
-
[47]
Network 3
Dyadic 2. Network 3. Market Prediction Model 0.16 0.18 0.20 0.22 0.24 0.26Brier Score Brier Score; Germany
-
[48]
Network 3
Dyadic 2. Network 3. Market Prediction Model 0.075 0.100 0.125 0.150 0.175 0.200 0.225 0.250Brier Score Brier Score; Greece
-
[49]
Network 3
Dyadic 2. Network 3. Market Prediction Model 0.16 0.18 0.20 0.22 0.24Brier Score Brier Score; Italy
-
[50]
Network 3
Dyadic 2. Network 3. Market Prediction Model 0.12 0.14 0.16 0.18 0.20 0.22 0.24Brier Score Brier Score; Netherlands
-
[51]
Network 3
Dyadic 2. Network 3. Market Prediction Model 0.14 0.16 0.18 0.20 0.22 0.24Brier Score Brier Score; Portugal
-
[52]
Network 3
Dyadic 2. Network 3. Market Prediction Model 0.14 0.16 0.18 0.20 0.22 0.24 0.26Brier Score Brier Score; Scotland
-
[53]
Network 3
Dyadic 2. Network 3. Market Prediction Model 0.14 0.16 0.18 0.20 0.22 0.24 0.26Brier Score Brier Score; Spain
-
[54]
Network 3
Dyadic 2. Network 3. Market Prediction Model 0.14 0.16 0.18 0.20 0.22 0.24 0.26Brier Score Brier Score; Turkey Fig. S1. Brier score distributions per country for the benchmark and prediction models (for n = 0 .5). 9
-
[55]
Network 3
Dyadic 2. Network 3. Market Prediction Model 0.55 0.60 0.65 0.70 0.75 0.80 0.85 0.90AUC AUC; Belgium
-
[56]
Network 3
Dyadic 2. Network 3. Market Prediction Model 0.5 0.6 0.7 0.8 0.9AUC AUC; England
-
[57]
Network 3
Dyadic 2. Network 3. Market Prediction Model 0.45 0.50 0.55 0.60 0.65 0.70 0.75 0.80 0.85AUC AUC; France
-
[58]
Network 3
Dyadic 2. Network 3. Market Prediction Model 0.50 0.55 0.60 0.65 0.70 0.75 0.80 0.85AUC AUC; Germany
-
[59]
Network 3
Dyadic 2. Network 3. Market Prediction Model 0.60 0.65 0.70 0.75 0.80 0.85 0.90 0.95 1.00AUC AUC; Greece
-
[60]
Network 3
Dyadic 2. Network 3. Market Prediction Model 0.60 0.65 0.70 0.75 0.80 0.85 0.90AUC AUC; Italy
-
[61]
Network 3
Dyadic 2. Network 3. Market Prediction Model 0.55 0.60 0.65 0.70 0.75 0.80 0.85 0.90 0.95AUC AUC; Netherlands
-
[62]
Network 3
Dyadic 2. Network 3. Market Prediction Model 0.60 0.65 0.70 0.75 0.80 0.85 0.90AUC AUC; Portugal
-
[63]
Network 3
Dyadic 2. Network 3. Market Prediction Model 0.5 0.6 0.7 0.8 0.9AUC AUC; Scotland
-
[64]
Network 3
Dyadic 2. Network 3. Market Prediction Model 0.50 0.55 0.60 0.65 0.70 0.75 0.80 0.85 0.90AUC AUC; Spain
-
[65]
Network 3
Dyadic 2. Network 3. Market Prediction Model 0.5 0.6 0.7 0.8 0.9AUC AUC; Turkey Fig. S2. Area Under the Curve (AUC) distributions per country for the benchmark and prediction models (for n = 0 .5). 10 BelgiumEnglandFrance GermanyGreece Italy Netherlands PortugalScotland SpainT...
2005
-
[66]
Market BelgiumEnglandFrance GermanyGreece Italy Netherlands PortugalScotland SpainTurkey Country 0.50 0.55 0.60 0.65 0.70 0.75 0.80 0.85 0.90Average AUC Average AUC: 2005/06 to 2018/19 (n = 0 .1)
2005
-
[67]
Market Fig. S3. Average Accuracy per Country: n = 0 .10 BelgiumEnglandFrance GermanyGreece Italy Netherlands PortugalScotland SpainTurkey Country 0 .10 0.12 0.14 0.16 0.18 0.20 0.22 0.24Average Brier Score Average Brier Score: 2005/06 to 2018/19 (n = 0.3)
2005
-
[68]
Market BelgiumEnglandFrance GermanyGreece Italy Netherlands PortugalScotland SpainTurkey Country 0.50 0.55 0.60 0.65 0.70 0.75 0.80 0.85 0.90Average AUC Average AUC: 2005/06 to 2018/19 (n = 0 .3)
2005
-
[69]
Market Fig. S4. Average Accuracy per Country: n = 0 .30 11 BelgiumEnglandFrance GermanyGreece Italy Netherlands PortugalScotland SpainTurkey Country 0 .10 0.12 0.14 0.16 0.18 0.20 0.22 0.24Average Brier Score Average Brier Score: 2005/06 to 2018/19 (n = 0.7)
2005
-
[70]
Market BelgiumEnglandFrance GermanyGreece Italy Netherlands PortugalScotland SpainTurkey Country 0.50 0.55 0.60 0.65 0.70 0.75 0.80 0.85 0.90Average AUC Average AUC: 2005/06 to 2018/19 (n = 0 .7)
2005
-
[71]
Market Fig. S5. Average Accuracy per Country: n = 0 .70 BelgiumEnglandFrance GermanyGreece Italy Netherlands PortugalScotland SpainTurkey Country 0 .10 0.12 0.14 0.16 0.18 0.20 0.22 0.24Average Brier Score Average Brier Score: 2005/06 to 2018/19 (n = 0.9)
2005
-
[72]
Market BelgiumEnglandFrance GermanyGreece Italy Netherlands PortugalScotland SpainTurkey Country 0.50 0.55 0.60 0.65 0.70 0.75 0.80 0.85 0.90Average AUC Average AUC: 2005/06 to 2018/19 (n = 0 .9)
2005
-
[73]
Market Fig. S6. Average Accuracy per Country: n = 0 .90 12 19952000200520102015 Time 0.14 0.16 0.18 0.20 0.22Brier Score Brier Score; England Linear Fit Lowess Fit Scores 1995 2000 2005 2010 2015 Time 0.16 0.17 0.18 0.19 0.20 0.21 0.22 0.23 0.24Brier Score Brier Score; Spain L...
1995
Reviewed August 14, 2026 · model on record in the stance chip above.
Discussion (0). Continue with ORCID to comment.