REVIEW 3 major objections 4 minor 2 cited by
New Insights on Ly-alpha and Lyman Continuum Radiative Transfer in the Greenest Peas
T0 review · 3 major / 4 minor · reviewed 2026-08-14 · deepseek-v4-flash
Pith's one-line read New ultraviolet spectra of thirteen highly ionized Green Pea galaxies show that the Lyα double-peak separation traces the transparency of low-density gas channels, that covering fraction traces porosity, and that [O III]/[O II] alone…
desk verdict New COS data on the most extreme Green Peas with careful measurements, but the central ΔvLyα–column-density interpretation is underdetermined and should be tested against direct LyC data. read the letter →
The pith
A machine-rendered reading of the paper's core claim, the machinery that carries it, and where it could break.
The reading
What carries the argument
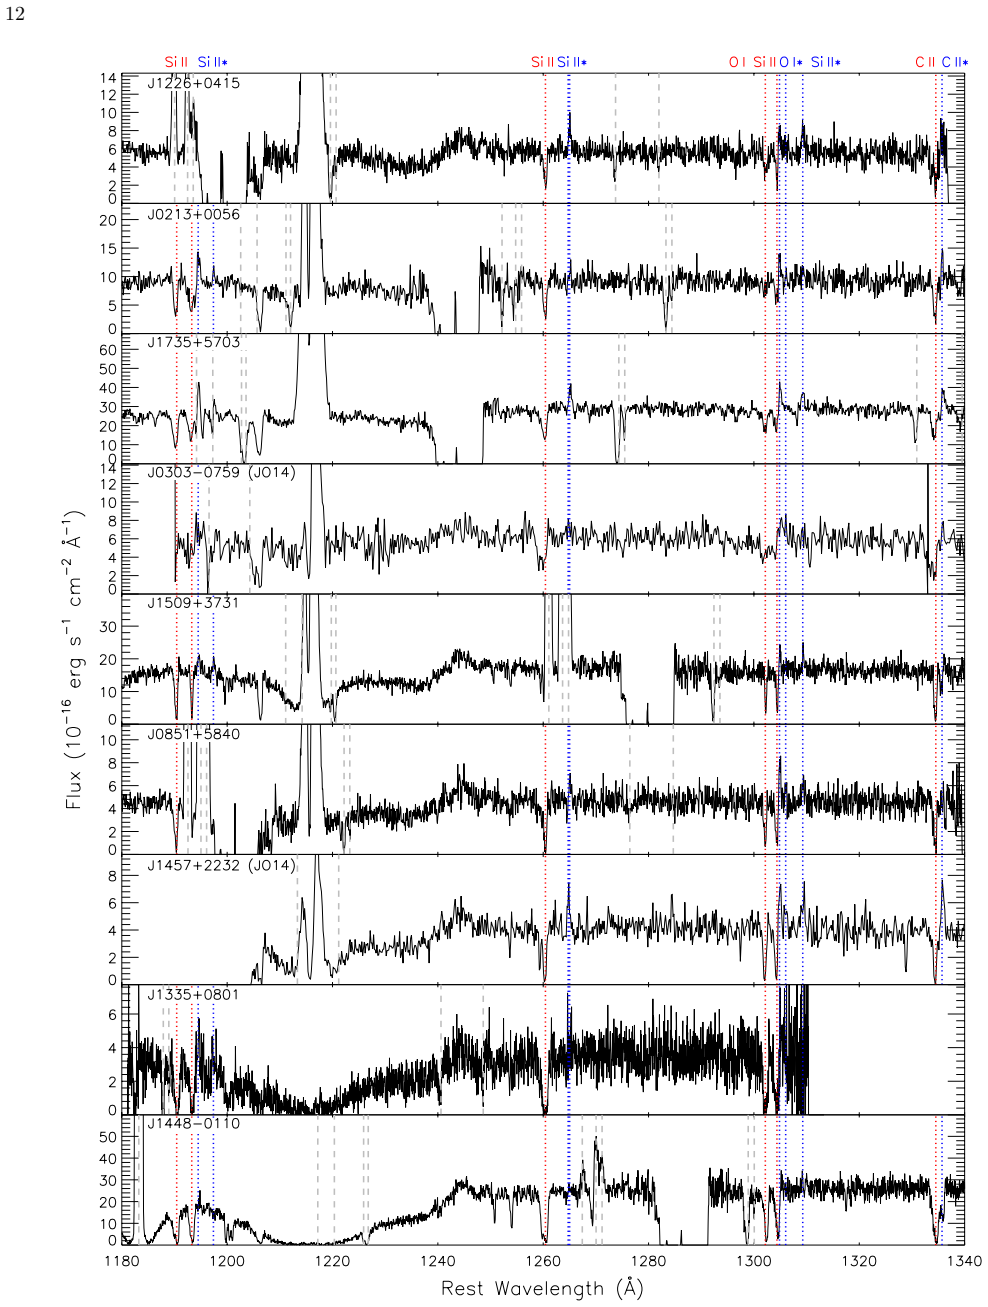
The load-bearing observables are the Lyα double-peak separation ΔvLyα, which radiative-transfer models connect to H I column density, and the Si II covering fraction fcov, measured from the residual intensity at line center, which measures gas porosity. The paper adds the flux at the Lyα profile minimum Fmin/Fcont, the Lyα escape fraction, and the balance of low-ionization resonant absorption (Si II, C II, O I) versus fluorescent non-resonant emission (Si II*, C II*) to map where absorbing gas sits relative to the line of sight. Together these diagnostics are used to infer a multiphase medium: dense, clumpy clouds that generate high ionization parameters, embedded in a low-density inter-clump medium whose column density sets ΔvLyα and through which LyC and narrow Lyα escape.
What would settle it
Direct ultraviolet observations of Lyman continuum escape from the 13 new Green Peas would settle the claim: the prediction is that J1608+3528 and other galaxies with narrow ΔvLyα and weak low-ionization lines will show detectable LyC leakage, while the two galaxies with deep, broad Lyα absorption (J1335+0801 and J1448-0110) will not. A model-level check is to compare the ΔvLyα–NH I mapping used in the shell and clumpy radiative-transfer models against the H I column densities these same galaxies show in their Lyα absorption troughs.
Extended reading notes
Core claim
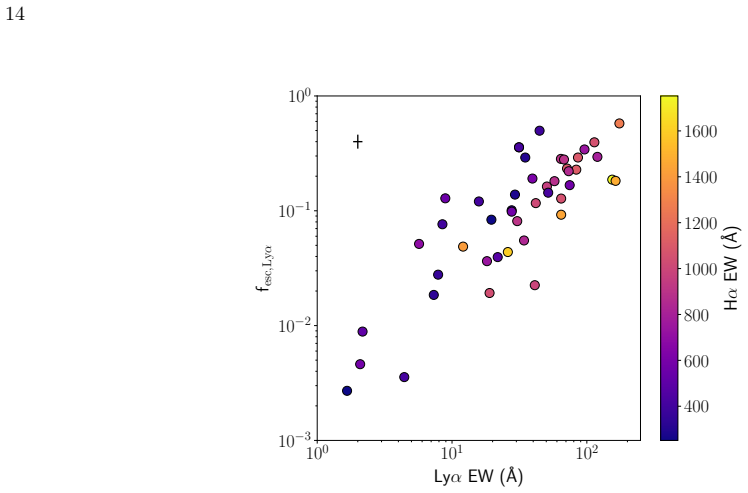
The paper's central claim is that two observables separately track the two geometric ingredients that control Lyman continuum escape in Green Pea galaxies. The Lyα escape fraction fesc,Lyα is driven by the covering fraction fcov, a measure of porosity: the two anti-correlate with ρ≈−0.82, and confirmed LyC leakers all have low fcov. The velocity separation ΔvLyα between the Lyα emission peaks is instead driven by the column density of the residual low-column-density gas between clumps: it correlates with [O I]/Hβ, [O III]/[O II], and metallicity, none of which correlate strongly with fcov. The paper therefore argues that ΔvLyα can reveal the transparency of the channels through which LyC photons escape, while fcov reveals how much of the sight line is covered by dense gas. High [O III]/[O II] selects galaxies with high intrinsic Lyα and LyC production, which is why so many are Lyα emitters and candidate LyC leakers, but it remains insufficient as a standalone LyC diagnostic because orientation and clumpiness decide whether an individual sight line is transparent.
Load-bearing premise
The argument stands on the claim that the gap between the two hydrogen-line peaks is a direct measure of how much thin gas the light passed through; if real galaxies mix dense clouds and thin gas in a way that breaks that relationship, the paper's central interpretation falls, and none of the 13 new galaxies has a direct measurement of escaping ionizing radiation to check it.
Editorial extensions
If this is right
- Narrow ΔvLyα can serve as a secondary, high-redshift LyC diagnostic: where direct Lyman continuum is unobservable, a close double-peak Lyα profile points to transparent low-column-density channels, while covering fraction measurements point to sight-line porosity.
- Lyα EW is a proxy for the net escaping LyC flux (production times escape), not for escape fraction alone, because high intrinsic Lyα production boosts EW even at moderate fesc,Lyα.
- Single-component gas geometries are insufficient: radiative-transfer models used to interpret LyC leakers must include a range of H I column densities, with dense clumps embedded in a lower-density inter-clump medium, or they will mispredict the Lyα–LyC relationship.
- Stacked high-redshift spectra will understate the true variation in low-ionization absorption and emission; the average profile corresponds to no individual galaxy, so conclusions about gas geometry from stacks need caution.
- Low-metallicity, compact clusters with suppressed mechanical feedback are the most plausible sites of LyC-transparent channels, implying that reionization-era conditions may be set by cluster formation physics, not just by galaxy mass or star formation rate.
Reading between the lines
- A test the paper does not spell out: if ΔvLyα traces the column density of the escape channels, then in LyC leakers the residual flux at the Lyα profile minimum should correlate with the LyC escape fraction more tightly than ΔvLyα itself does, because Fmin is set by the same low-column-density paths.
- By implication, the orientation dependence the paper invokes could be quantified: galaxies with similar [O III]/[O II] and fcov should scatter in fesc,LyC according to how many transparent channels happen to align with the line of sight, producing a natural prediction for the scatter in the [O III]/[O II]–fesc,LyC relation.
- The fine-structure absorption in C II* and Si II* implies that column densities derived from resonant lines without accounting for these excited states will be biased; future work could model collisional excitation and pumping to correct those measurements.
- The metallicity–ΔvLyα link raises the possibility of using Lyα profile shape as a rough metallicity/ionization tracer in regimes where nebular lines are unavailable, though that would require independent calibration.
Signed reviews
Editorial analysis
A structured set of objections, weighed in public.
Referee Report
Summary. The paper presents new HST/COS ultraviolet spectra of 13 extremely high-ionization Green Pea galaxies, with [O III]/[O II] between 6.6 and 34.9, and combines these with earlier GP samples to examine correlations among Ly-alpha profile parameters, low-ionization absorption/emission lines, gas covering fractions, and optical nebular properties. The main interpretive claim is that the Ly-alpha peak separation Δv_Lyα traces the column density of low-column-density pathways, while the Si II covering fraction f_cov traces the porosity of the neutral ISM; the paper further connects low metallicity, high ionization, and narrow Δv_Lyα through a catastrophic-cooling, clumpy-geometry scenario. The authors also emphasize that high [O III]/[O II] selects galaxies with many LyC emitter candidates but is not by itself a sufficient LyC escape diagnostic, and they caution that stacked LIS spectra do not represent any individual galaxy.
Significance. If the central interpretation holds, the paper provides a step toward using Ly-alpha profile shape and low-ionization lines as indirect tracers of LyC escape, which matters for reionization-era galaxies. The observational effort is substantial: the new COS sample extends to the most extreme ionization parameters known in SDSS, and the paper gives careful attention to extraction-aperture flux losses, spectral resolution, continuum placement, and systematic uncertainties. The authors also deserve credit for explicitly flagging the main limitations of their own analysis, including the lower-limit nature of f_cov, aperture effects, contamination by non-resonant absorption, and the non-representativeness of stacked spectra. The correlations are useful observational constraints even if the physical interpretation is not uniquely determined.
major comments (3)
- [Section 3.2.3 and Section 5.2] The claim that ΔvLyα traces column density while f_cov traces porosity is underdetermined by the presented data. The evidence is correlational: ΔvLyα correlates with ionization measures and f_cov does not (Section 3.2.3), and ΔvLyα and f_cov are only moderately correlated (ρ=0.56, Table 7). In the clumpy, multiphase medium the paper itself advocates, Lyα peak separation is an integrated sightline property that depends on the full column-density distribution, clump optical depth, and orientation, not uniquely on the inter-clump column density. The cited radiative-transfer mappings (Verhamme et al. 2015; Dijkstra et al. 2016) assume simpler geometries, and the paper's own statement in Section 3.2.5 that the GPs are 'neither pure shells nor a distribution of clumps with completely evacuated holes' sharpens this concern. The observed ΔvLyα–f_cov correlation is also what would be expected if both quantities respond to the same clump/column degeneracy rather than to two cleanly separated physical parameters. I recommend either softening the diagnostic claim to 'consistent with' while explicitly listing the degenerate interpretation, or adding multiphase Lyα radiative-transfer calculations that vary f_cov and inter-clump column density independently and demonstrating that ΔvLyα separates them.
- [Tables 6–9 and Section 3.2] The correlation analysis reports Spearman ρ and sample sizes but no significance levels or confidence intervals. Several correlations that anchor the main text have N=10–15, for example EWnet(C II*1335+C II1334) with Lyα EW (ρ=0.80, N=12; Table 6) and EWnet(O I*1305+O I1302) with ΔvLyα (ρ=−0.85, N=11; Table 7). The contrast between the ΔvLyα–ionization correlations and the f_cov–ionization correlations (Section 3.2.3) is a comparison of coefficients with different values and different sample sizes, and the paper does not test whether the difference is significant. Because the Δv/porosity separation rests partly on this contrast, please provide p-values or bootstrap confidence intervals for all reported correlations, and where the text contrasts two correlations, assess whether the difference is statistically meaningful.
- [Section 2.2 and Section 4.3] The f_cov measurements are derived from Si II residual intensities and are acknowledged in Section 2.2 to be lower limits, and Section 4.3 shows that C II* and Si II* absorption can contaminate the relevant lines. Since the paper uses f_cov to separate porosity from column-density effects, the robustness of the f_cov–ΔvLyα and f_cov–ionization correlations to these systematic effects should be quantified. For example, the authors could recompute the key correlations after excluding low-metallicity objects, where Si II absorption is intrinsically weaker, or after applying a correction for non-resonant absorption where detected. Without such a test, the reader cannot tell whether the reported f_cov trends are dominated by the known systematics rather than by actual covering-fraction variations.
minor comments (4)
- [Section 3.2.4] The sentence 'metallicity appears to be linked specifically to Lyα optical depth' overstates what a correlational study can establish; consider rewording to 'linked to the properties that trace Lyα optical depth'.
- [Tables 4 and 5] The tables contain many 1σ upper and lower limits, but the text does not describe how these limits were treated in the EWnet correlations shown in Figure 17. Please state explicitly whether limits were excluded, replaced by the limiting value, or handled with a survival-analysis method.
- [Section 4.4 and Figure 18] The stacked-spectrum discussion would be clearer if the figure or caption stated the number of galaxies contributing to each wavelength bin, since the line coverage varies from object to object.
- [Section 1 and Table 1] There are a few typographical inconsistencies, such as 'T able 1' in the table caption and a stray 'delta_v,LyA' in the abstract; a final copyedit would remove these.
Circularity Check
No significant circularity: the measured quantities are independent, and the central interpretation rests on external radiative-transfer models and empirical correlations, not on fitted inputs or self-referential definitions.
full rationale
I find no circular step in this paper. The central observables are measured independently of the claims they support: Delta-v_LyA is measured from the COS Ly-alpha profiles, fcov is derived from Si II residual intensities (taken from McKinney et al. 2019 and Gazagnes et al. 2018), and fesc,LyA is computed from Ly-alpha and H-alpha fluxes under Case B assumptions. None of these quantities is defined in terms of another quantity that the paper claims to predict. The paper's main interpretive suggestion, that Delta-v_LyA may trace the residual transparency of low-column-density pathways while fcov traces porosity, is explicitly an interpretation of correlations and is grounded in external radiative-transfer models (Verhamme et al. 2015; Dijkstra et al. 2016). The paper does not fit a parameter to a subset of data and then rename it as a prediction; it reports Spearman correlations and proposes a physical picture consistent with them. The use of companion papers by the same group (e.g., McKinney et al. 2019 for fcov, Jaskot et al. 2017 for previous Delta-v measurements) is data and method provenance, not load-bearing circular reasoning, and the fcov measurements are additionally sourced in part from the independent Gazagnes et al. 2018 analysis. The paper also explicitly acknowledges limitations, such as the lower-limit nature of the Si II-derived fcov and the statement that the GPs are 'neither pure shells nor a distribution of clumps with completely evacuated holes.' These are scientific caveats about an underdetermined interpretation, not circular derivations. No equation in the paper reduces a claimed result to its own inputs, and no uniqueness theorem or ansatz is imported from the authors' prior work to force the conclusion. The analysis is therefore self-contained as an observational study with an interpretive hypothesis, and the appropriate circularity score is 0.
Assumptions & free parameters
free parameters (2)
- Adopted electron temperature for [O III] 4363 non-detections =
13451 K
- Dust attenuation law R_V choice =
R_V = 2.7 for Hβ EW > 150 A, else 3.1
assumptions (5)
- standard math Case B recombination gives Lyα/Hα ≈ 8.24-8.96 for the measured electron temperatures and densities.
- domain assumption Lyα double-peak separation ΔvLyα maps to H I column density in Lyα radiative transfer models.
- domain assumption Si ii residual intensity at line center provides a valid lower limit on the gas covering fraction.
- domain assumption The pooled sample of extreme-ionization GPs and previous GP samples is representative for Spearman rank correlations.
- domain assumption Catastrophic cooling in massive compact super star clusters suppresses mechanical feedback at low metallicity and produces dense clumps with transparent inter-clump channels.
Cite this review
Pith. "Pith review of New Insights on Ly-alpha and Lyman Continuum Radiative Transfer in the Greenest Peas." pith.science (2026). https://pith.science/paper/UEKSF6DV
@misc{pith2026190809763,
  author       = {Pith},
  title        = {Pith review of: New Insights on Ly-alpha and Lyman Continuum Radiative Transfer in the Greenest Peas},
  year         = {2026},
  howpublished = {\url{https://pith.science/paper/UEKSF6DV}},
  note         = {Machine review of arXiv:1908.09763}
}
read the original abstract
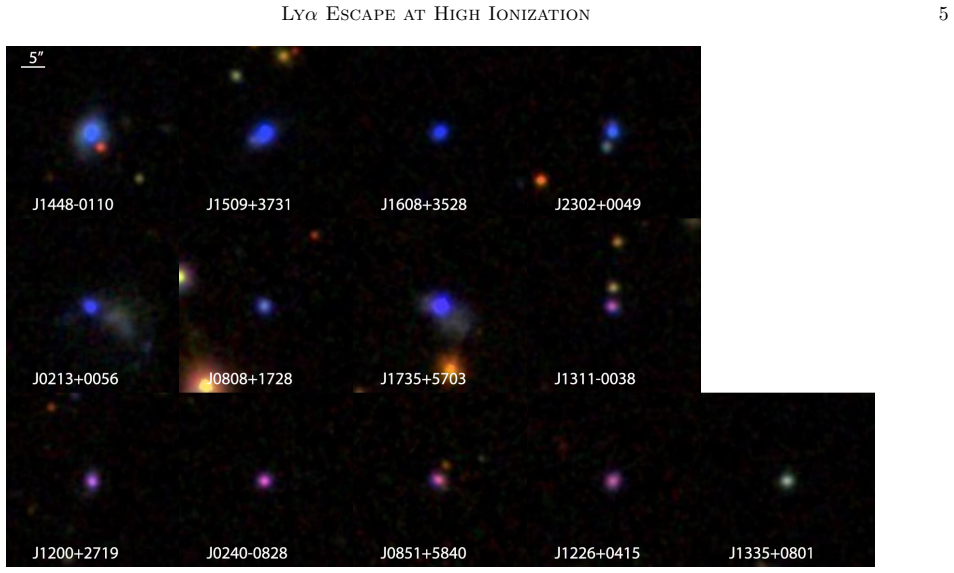
As some of the only Lyman continuum (LyC) emitters at z~0, Green Pea (GP) galaxies are possible analogs of the sources that reionized the universe. We present HST COS spectra of 13 of the most highly ionized GPs, with [O III]/[O II]=6-35, and investigate correlations between Ly-alpha, galaxy properties, and low-ionization UV lines. Galaxies with high [O III]/[O II] have higher H-alpha equivalent widths (EWs), and high intrinsic Ly-alpha production may explain the prevalence of high Ly-alpha EWs among GPs. While Ly-alpha escape fraction is closely linked to low gas covering fractions, implying a clumpy gas geometry, narrow Ly-alpha velocity peak separation (delta_v,LyA) correlates with the ionization state, suggesting a density-bounded geometry. We therefore suggest that delta_v,LyA may trace the residual transparency of low-column-density pathways. Metallicity is associated with both [O III]/[O II] and delta_v,LyA. This trend may result from catastrophic cooling around low-metallicity star clusters, which generates a compact geometry of dense clouds within a low-density inter-clump medium. We find that the relative strength of low-ionization UV emission to absorption correlates with Ly-alpha emission strength and is related to Ly-alpha profile shape. However, as expected for optically thin objects, the GPs with the lowest delta_v,LyA show both weak low-ionization emission and weak absorption. The strengths of the low-ionization absorption and emission lines in a stacked spectrum do not correspond to any individual spectrum. Galaxies with high [O III]/[O II] contain a high fraction of LyC emitter candidates, but [O III]/[O II] alone is an insufficient diagnostic of LyC escape.
Figures


Figures from the paper (15 more)




Forward citations
Cited by 2 Pith papers
-
A new technique for finding galaxies leaking Lyman-continuum radiation: [SII]-deficiency
Two of three [SII]-weak star-forming galaxies at redshift 0.3 show direct Lyman-continuum emission, supporting [SII]-deficiency as a new signpost for LyC escape.
-
HST Imaging of the Ionizing Radiation from a Star-forming Galaxy at z = 3.794
HST and VLT observations detect Lyman-continuum radiation escaping from a compact, off-center region of the z=3.794 galaxy Ion1, which unusually shows Lyman-alpha in absorption; a stack of 107 LBGs limits the average ...
Reference graph
Works this paper leans on
-
[1]
, " * write output.state after.block = add.period write newline
ENTRY address archivePrefix author booktitle chapter doi edition editor eprint howpublished institution journal key month number organization pages publisher school series title misctitle type volume year version url label extra.label sort.label short.list INTEGERS output.state before.all mid.sentence after.sentence after.block FUNCTION init.state.consts ...
-
[2]
write newline
" write newline "" before.all 'output.state := FUNCTION format.url url empty "" new.block "" url * "" * if FUNCTION format.eprint eprint empty "" archivePrefix empty "" archivePrefix "arXiv" = new.block " " eprint * " " * new.block " " eprint * " " * if if if FUNCTION format.doi doi empty "" " " doi * " " * if FUNCTION format.pid doi empty eprint empty ur...
-
[3]
" id="W5M0MpCehiHzreSzNTczkc9d
thebibliography [1] 20pt to REFERENCES 6pt =0pt 10pt plus 3pt =0pt =0pt =1pt plus 1pt =0pt =0pt -12pt =13pt plus 1pt =20pt =13pt plus 1pt \@M =10000 =-1.0em =0pt =0pt 0pt =0pt =1.0em @enumiv\@empty 10000 10000 `\.\@m \@noitemerr \@latex@warning Empty `thebibliography' environment \@ifnextchar \@reference \@latexerr Missing key on reference command Each re...
-
[4]
P., et al
Ahn , C. P., et al. 2014, , 211, 17
2014
-
[5]
O., P \'e rez-Montero , E., & V \' lchez , J
Amor \' n , R. O., P \'e rez-Montero , E., & V \' lchez , J. M. 2010, , 715, L128
2010
-
[6]
2009, , 502, 791
Atek , H., Schaerer , D., & Kunth , D. 2009, , 502, 791
2009
-
[7]
A., Phillips , M
Baldwin , J. A., Phillips , M. M., & Terlevich , R. 1981, , 93, 5
1981
-
[8]
Behrens , C., Dijkstra , M., & Niemeyer , J. C. 2014, , 563, A77
2014
Show all 119 references
-
[9]
G., Arnberg , D., Masegosa , J., & \"O stlin , G
Bergvall , N., Zackrisson , E., Andersson , B. G., Arnberg , D., Masegosa , J., & \"O stlin , G. 2006, , 448, 513
2006
-
[10]
M., Leitherer , C., & Overzier , R
Borthakur , S., Heckman , T. M., Leitherer , C., & Overzier , R. A. 2014, Science, 346, 216
2014
-
[11]
2002, , 385, 454
Boselli , A., Gavazzi , G., Lequeux , J., & Pierini , D. 2002, , 385, 454
2002
-
[12]
S., & Larson , R
Bromm , V., Coppi , P. S., & Larson , R. B. 1999, , 527, L5
1999
-
[13]
2009, , 399, 1191
Cardamone , C., et al. 2009, , 399, 1191
2009
-
[14]
A., Clayton , G
Cardelli , J. A., Clayton , G. C., & Mathis , J. S. 1989, , 345, 245
1989
-
[15]
2018, , 860, 143
Carr , C., Scarlata , C., Panagia , N., & Henry , A. 2018, , 860, 143
2018
-
[16]
2015, , 801, L25
Cen , R., & Kimm , T. 2015, , 801, L25
2015
-
[17]
2018, , 616, A30
Chisholm , J., et al. 2018, , 616, A30
2018
-
[18]
I., Thuan , T
Chisholm , J., Orlitov \'a , I., Schaerer , D., Verhamme , A., Worseck , G., Izotov , Y. I., Thuan , T. X., & Guseva , N. G. 2017, , 605, A67
2017
-
[19]
K., Genzel , R., Townes , C
Crawford , M. K., Genzel , R., Townes , C. H., & Watson , D. M. 1985, , 291, 755
1985
-
[20]
A., et al
Crowther , P. A., et al. 2016, , 458, 624
2016
-
[21]
2016, , 828, 71
Dijkstra , M., Gronke , M., & Venkatesan , A. 2016, , 828, 71
2016
-
[22]
A., & Sutherland , R
Dopita , M. A., & Sutherland , R. S. 2003, Astrophysics of the diffuse universe
2003
-
[23]
J., Stanway , E
Eldridge , J. J., Stanway , E. R., Xiao , L., McClelland , L. A. S., Taylor , G., Ng , M., Greis , S. M. L., & Bray , J. C. 2017, , 34, e058
2017
-
[24]
R., & Shull , J
Fernandez , E. R., & Shull , J. M. 2011, , 731, 20
2011
-
[25]
L., et al
Finkelstein , S. L., et al. 2015, , 810, 71
2015
-
[26]
Fitzpatrick , E. L. 1999, , 111, 63
1999
-
[27]
J., Robertson , B
Fletcher , T. J., Robertson , B. E., Nakajima , K., Ellis , R. S., Stark , D. P., & Inoue , A. 2018, ArXiv e-prints
2018
-
[28]
R., & Bayliss , M
Gazagnes , S., Chisholm , J., Schaerer , D., Verhamme , A., Rigby , J. R., & Bayliss , M. 2018, , 616, A29
2018
-
[29]
1996, , 466, 831
Giavalisco , M., Koratkar , A., & Calzetti , D. 1996, , 466, 831
1996
-
[30]
Gronke , M., Dijkstra , M., McCourt , M., & Oh , S. P. 2016, , 833, L26
2016
-
[31]
2017, , 607, A71
Gronke , M., Dijkstra , M., McCourt , M., & Peng Oh , S. 2017, , 607, A71
2017
-
[32]
J., Oey , M
Hanish , D. J., Oey , M. S., Rigby , J. R., de Mello , D. F., & Lee , J. C. 2010, , 725, 2029
2010
-
[33]
Hansen , M., & Oh , S. P. 2006, , 367, 979
2006
-
[34]
2015, , 812, 157
Hashimoto , T., et al. 2015, , 812, 157
2015
-
[35]
2013, , 765, L27
Hayes , M., et al. 2013, , 765, L27
2013
-
[36]
M., et al
Heckman , T. M., et al. 2011, , 730, 5
2011
-
[37]
M., Sembach , K
Heckman , T. M., Sembach , K. R., Meurer , G. R., Leitherer , C., Calzetti , D., & Martin , C. L. 2001, , 558, 56
2001
-
[38]
L., Woosley , S
Heger , A., Fryer , C. L., Woosley , S. E., Langer , N., & Hartmann , D. H. 2003, , 591, 288
2003
-
[39]
L., & Erb , D
Henry , A., Scarlata , C., Martin , C. L., & Erb , D. 2015, , 809, 19
2015
-
[40]
2002, , 336, 33
Iglesias-P \'a ramo , J., & Mu \ n oz-Tu \ n \'o n , C. 2002, , 336, 33
2002
-
[41]
K., Iwata , I., & Deharveng , J.-M
Inoue , A. K., Iwata , I., & Deharveng , J.-M. 2006, , 371, L1
2006
-
[42]
I., Guseva , N
Izotov , Y. I., Guseva , N. G., Fricke , K. J., Henkel , C., & Schaerer , D. 2017 a , , 467, 4118
2017
-
[43]
I., Guseva , N
Izotov , Y. I., Guseva , N. G., & Thuan , T. X. 2011, , 728, 161
2011
-
[44]
I., Orlitov \'a , I., Schaerer , D., Thuan , T
Izotov , Y. I., Orlitov \'a , I., Schaerer , D., Thuan , T. X., Verhamme , A., Guseva , N. G., & Worseck , G. 2016 a , , 529, 178
2016
-
[45]
I., Schaerer , D., Thuan , T
Izotov , Y. I., Schaerer , D., Thuan , T. X., Worseck , G., Guseva , N. G., Orlitov \'a , I., & Verhamme , A. 2016 b , , 461, 3683
2016
-
[46]
I., Schaerer , D., Worseck , G., Guseva , N
Izotov , Y. I., Schaerer , D., Worseck , G., Guseva , N. G., Thuan , T. X., Verhamme , A., Orlitov \'a , I., & Fricke , K. J. 2018 a , , 474, 4514
2018
-
[47]
I., Thuan , T
Izotov , Y. I., Thuan , T. X., & Guseva , N. G. 2017 b , , 471, 548
2017
-
[48]
I., Worseck , G., Schaerer , D., Guseva , N
Izotov , Y. I., Worseck , G., Schaerer , D., Guseva , N. G., Thuan , T. X., Fricke , A., V., & Orlitov \'a , I. 2018 b , , 478, 4851
2018
-
[49]
E., & Oey , M
Jaskot , A. E., & Oey , M. S. 2013, , 766, 91
2013
-
[50]
2014, , 791, L19
---. 2014, , 791, L19
2014
-
[51]
E., Oey , M
Jaskot , A. E., Oey , M. S., Scarlata , C., & Dowd , T. 2017, , 851, L9
2017
-
[52]
A., Ellis , R
Jones , T. A., Ellis , R. S., Schenker , M. A., & Stark , D. P. 2013, , 779, 52
2013
-
[53]
2019, arXiv e-prints, arXiv:1905.02480
Kakiichi , K., & Gronke , M. 2019, arXiv e-prints, arXiv:1905.02480
2019 arXiv
-
[54]
P., Oey , M
Keenan , R. P., Oey , M. S., Jaskot , A. E., & James , B. L. 2017, , 848, 12
2017
-
[55]
C., & Evans , N
Kennicutt , R. C., & Evans , N. J. 2012, , 50, 531
2012
-
[56]
A., Sobral , D., Mobasher , B., Smail , I., Darvish , B., Nayyeri , H., Hemmati , S., & Stott , J
Khostovan , A. A., Sobral , D., Mobasher , B., Smail , I., Darvish , B., Nayyeri , H., Hemmati , S., & Stott , J. P. 2016, , 463, 2363
2016
-
[57]
R., & Thompson , T
Krumholz , M. R., & Thompson , T. A. 2012, , 760, 155
2012
-
[58]
M., Terlevich , E., Terlevich , R., Lequeux , J., & Fall , S
Kunth , D., Mas-Hesse , J. M., Terlevich , E., Terlevich , R., Lequeux , J., & Fall , S. M. 1998, , 334, 11
1998
-
[59]
Larson , R. B. 2005, , 359, 211
2005
-
[60]
2013, , 553, A16
Lebouteiller , V., Heap , S., Hubeny , I., & Kunth , D. 2013, , 553, A16
2013
-
[61]
2013, , 553, A106
Leitet , E., Bergvall , N., Hayes , M., Linn \'e , S., & Zackrisson , E. 2013, , 553, A106
2013
-
[62]
C., Heckman , T
Leitherer , C., Ferguson , H. C., Heckman , T. M., & Lowenthal , J. D. 1995, , 454, L19
1995
-
[63]
C., & Oey , M
Leitherer , C., Hernandez , S., Lee , J. C., & Oey , M. S. 2016, , 823, 64
2016
-
[64]
Luridiana , V., Morisset , C., & Shaw , R. A. 2015, , 573, A42
2015
-
[65]
Marks , M., Kroupa , P., Dabringhausen , J., & Pawlowski , M. S. 2012, , 422, 2246
2012
-
[66]
M., Kunth , D., Tenorio-Tagle , G., Leitherer , C., Terlevich , R
Mas-Hesse , J. M., Kunth , D., Tenorio-Tagle , G., Leitherer , C., Terlevich , R. J., & Terlevich , E. 2003, , 598, 858
2003
-
[67]
McGaugh , S. S. 1991, , 380, 140
1991
-
[68]
S., Yun , M., Dowd , T., & Lowenthal , J
McKinney , J., Jaskot , A., Oey , M. S., Yun , M., Dowd , T., & Lowenthal , J. 2019, ApJ Submitted
2019
-
[69]
S., Jaskot , A
Micheva , G., Oey , M. S., Jaskot , A. E., & James , B. L. 2017, , 845, 165
2017
-
[70]
S., Keenan , R
Micheva , G., Oey , M. S., Keenan , R. P., Jaskot , A. E., & James , B. L. 2018, , 867, 2
2018
-
[71]
E., Shapley , A
Mostardi , R. E., Shapley , A. E., Steidel , C. C., Trainor , R. F., Reddy , N. A., & Siana , B. 2015, , 810, 107
2015
-
[72]
P., Forrest , B., Oesch , P
Naidu , R. P., Forrest , B., Oesch , P. A., Tran , K.-V. H., & Holden , B. P. 2018, , 478, 791
2018
-
[73]
S., Iwata , I., Inoue , A
Nakajima , K., Ellis , R. S., Iwata , I., Inoue , A. K., Kusakabe , H., Ouchi , M., & Robertson , B. E. 2016, , 831, L9
2016
-
[74]
2014, , 442, 900
Nakajima , K., & Ouchi , M. 2014, , 442, 900
2014
-
[75]
S., Herrera , C
Oey , M. S., Herrera , C. N., Silich , S., Reiter , M., James , B. L., Jaskot , A. E., & Micheva , G. 2017, , 849, L1
2017
-
[76]
S., & Schaerer , D
Orlitov \'a , I., Verhamme , A., Henry , A., Scarlata , C., Jaskot , A., Oey , M. S., & Schaerer , D. 2018, , 616, A60
2018
-
[77]
E., & Ferland , G
Osterbrock , D. E., & Ferland , G. J. 2006, Astrophysics of gaseous nebulae and active galactic nuclei
2006
-
[78]
2015, , 451, 2544
Paardekooper , J.-P., Khochfar , S., & Dalla Vecchia , C. 2015, , 451, 2544
2015
-
[79]
2017, , 129, 043001
P \'e rez-Montero , E. 2017, , 129, 043001
2017
-
[80]
X., Kasen , D., & Rubin , K
Prochaska , J. X., Kasen , D., & Rubin , K. 2011, , 734, 24
2011
-
[81]
2019, arXiv e-prints
Ramachandran , V., et al. 2019, arXiv e-prints
2019
-
[82]
E., et al
Rivera-Thorsen , T. E., et al. 2017 a , , 608, L4
2017
-
[83]
2015, , 805, 14
---. 2015, , 805, 14
2015
-
[84]
E., \"O stlin , G., Hayes , M., & Puschnig , J
Rivera-Thorsen , T. E., \"O stlin , G., Hayes , M., & Puschnig , J. 2017 b , , 837, 29
2017
-
[85]
E., Ellis , R
Robertson , B. E., Ellis , R. S., Furlanetto , S. R., & Dunlop , J. S. 2015, , 802, L19
2015
-
[86]
2016, Optimization of Lifetime Position 3 of the COS/FUV Detector , Tech
Roman-Duval , J., et al. 2016, Optimization of Lifetime Position 3 of the COS/FUV Detector , Tech. rep
2016
-
[87]
J., et al
Rutkowski , M. J., et al. 2016, , 819, 81
2016
-
[88]
2015, , 801, 43
Scarlata , C., & Panagia , N. 2015, , 801, 43
2015
-
[89]
I., Verhamme , A., Orlitov \'a , I., Thuan , T
Schaerer , D., Izotov , Y. I., Verhamme , A., Orlitov \'a , I., Thuan , T. X., Worseck , G., & Guseva , N. G. 2016, , 591, L8
2016
-
[90]
A., Ellis , R
Schenker , M. A., Ellis , R. S., Konidaris , N. P., & Stark , D. P. 2014, , 795, 20
2014
-
[91]
F., & Finkbeiner , D
Schlafly , E. F., & Finkbeiner , D. P. 2011, , 737, 103
2011
-
[92]
Schneider , F. R. N., et al. 2018, Science, 359, 69
2018
-
[93]
E., Steidel , C
Shapley , A. E., Steidel , C. C., Pettini , M., & Adelberger , K. L. 2003, , 588, 65
2003
-
[94]
2014, , 788, 74
Shibuya , T., et al. 2014, , 788, 74
2014
-
[95]
M., Moloney , J., Danforth , C
Shull , J. M., Moloney , J., Danforth , C. W., & Tilton , E. M. 2015, , 811, 3
2015
-
[96]
2017, , 465, 1375
Silich , S., & Tenorio-Tagle , G. 2017, , 465, 1375
2017
-
[97]
2004, , 610, 226
Silich , S., Tenorio-Tagle , G., & Rodr \' guez-Gonz \'a lez , A. 2004, , 610, 226
2004
-
[98]
J., Crowther , P
Smith , L. J., Crowther , P. A., Calzetti , D., & Sidoli , F. 2016, , 823, 38
2016
-
[99]
P., Ellis , R
Stark , D. P., Ellis , R. S., & Ouchi , M. 2011, , 728, L2
2011
-
[100]
2015, , 576, A83
Stasi \'n ska , G., Izotov , Y., Morisset , C., & Guseva , N. 2015, , 576, A83
2015
-
[101]
C., Bogosavlevic , M., Shapley , A
Steidel , C. C., Bogosavlevic , M., Shapley , A. E., Reddy , N. A., Rudie , G. C., Pettini , M., Trainor , R. F., & Strom , A. L. 2018, ArXiv e-prints
2018
-
[102]
J., & Hummer , D
Storey , P. J., & Hummer , D. G. 1995, , 272, 41
1995
-
[103]
1998, , 502, L71
St \"o rzer , H., & Hollenbach , D. 1998, , 502, L71
1998
-
[104]
2002, , 123, 485
Stoughton , C., et al. 2002, , 123, 485
2002
-
[105]
E., Brown , J
Sukhbold , T., Ertl , T., Woosley , S. E., Brown , J. M., & Janka , H. T. 2016, , 821, 38
2016
-
[106]
R., et al
Tanvir , N. R., et al. 2019, , 483, 5380
2019
-
[107]
F., Strom , A
Trainor , R. F., Strom , A. L., Steidel , C. C., & Rudie , G. C. 2016, , 832, 171
2016
-
[108]
2016, , 825, 41
Vanzella , E., et al. 2016, , 825, 41
2016
-
[109]
2016, , 831, 38
Vasei , K., et al. 2016, , 831, 38
2016
-
[110]
2015, , 578, A7
Verhamme , A., Orlitov \'a , I., Schaerer , D., & Hayes , M. 2015, , 578, A7
2015
-
[111]
X., & Guseva , N
Verhamme , A., Orlitov \'a , I., Schaerer , D., Izotov , Y., Worseck , G., Thuan , T. X., & Guseva , N. 2017, , 597, A13
2017
-
[112]
S., de Koter , A., & Lamers , H
Vink , J. S., de Koter , A., & Lamers , H. J. G. L. M. 2001, , 369, 574
2001
-
[113]
S., & Walterbos , R
Voges , E. S., & Walterbos , R. A. M. 2006, , 644, L29
2006
-
[114]
H., & Cen , R
Wise , J. H., & Cen , R. 2009, , 693, 984
2009
-
[115]
M., Prochaska , J
Wolfe , A. M., Prochaska , J. X., & Gawiser , E. 2003, , 593, 215
2003
-
[116]
L., et al
Wright , E. L., et al. 1991, , 381, 200
1991
-
[117]
2017 a , , 844, 171
Yang , H., et al. 2017 a , , 844, 171
2017
-
[118]
E., Leitherer , C., Wofford , A., Jiang , T., & Wang , J
Yang , H., Malhotra , S., Rhoads , J. E., Leitherer , C., Wofford , A., Jiang , T., & Wang , J. 2017 b , , 838, 4
2017
-
[119]
S., Veilleux , S., & McDonald , M
Zastrow , J., Oey , M. S., Veilleux , S., & McDonald , M. 2013, , 779, 76
2013
Reviewed August 14, 2026 · model on record in the stance chip above.
Discussion (0). Continue with ORCID to comment.