REVIEW 3 major objections 4 minor 92 references
One- and Two-point Source Statistics from the LOFAR Two-metre Sky Survey First Data Release
T0 review · 3 major / 4 minor · reviewed 2026-08-14 · deepseek-v4-flash
Pith's one-line read A clean 2 mJy sample of 19,719 LoTSS radio sources shows angular clustering consistent with the standard cosmological model and with percent-level statistical isotropy of the radio sky.
desk verdict A careful first clustering measurement from LoTSS-DR1; trust the 2 mJy result, but the Planck agreement remains conditional until photo-zs are validated. read the letter →
The pith
A machine-rendered reading of the paper's core claim, the machinery that carries it, and where it could break.
The reading
What carries the argument
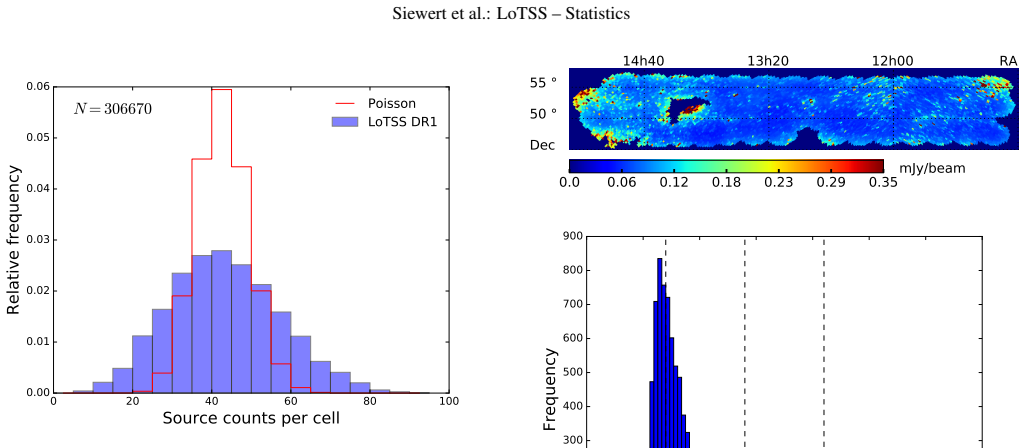
The argument pivots on two objects. For the one-point statistics it is the counts-in-cell distribution and its moments, especially the clustering parameter $n_c=\mathrm{Var}[k]/\mathbb{E}[k]$, with a compound Poisson distribution (a Poisson number of clusters, each contributing a Poisson number of components) as the model that fits the data. For the two-point statistics it is the angular correlation function $w(\theta)$, measured through the Landy-Szalay pair-counting estimator $\hat w(\theta)=(DD-2DR+RR)/RR$, where $DD$, $DR$, and $RR$ are normalized data-data, data-random, and random-random pair counts. The random catalogue is a noise-weighted mock built from a simulated radio sky and the actual LoTSS noise maps, so survey masks and completeness variations are folded into the null expectation. The theoretical comparison carries through a redshift-space window: the measured photo-$z$ histogram, the Planck 2018 parameters, and a bias-redshift relation are fed into a Boltzmann-solver code that produces the predicted $w(\theta)$, with the finite-survey integral constraint subtracted.
What would settle it
Recompute the predicted $w(\theta)$ for the 2 mJy low-noise sample using a spectroscopic redshift distribution rather than the photometric one, and check whether the prediction still lies inside the measured 1-$\sigma$ band between 0.2 and 2 degrees; if it drifts outside, the claimed agreement depended on the assumed $N(z)$.
Extended reading notes
Core claim
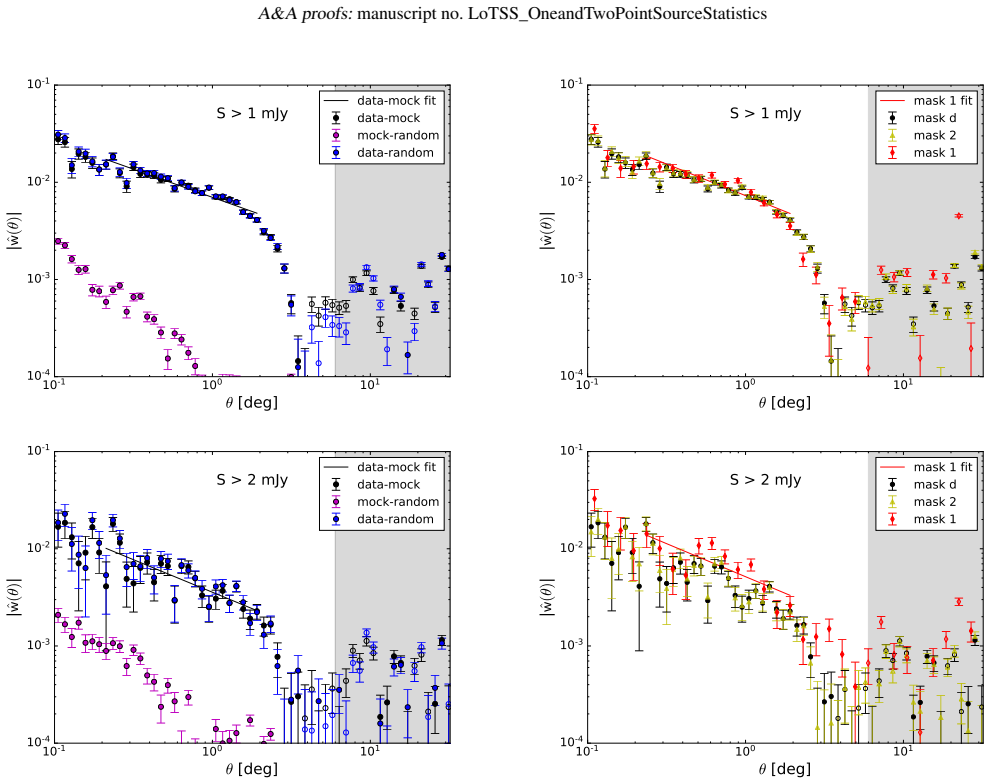
The paper's central claim is that the angular clustering of LoTSS-DR1 radio sources above a flux-density threshold of 2 mJy, restricted to cells with local rms noise below the survey median, is described by $w(\theta)=A(\theta/1\,\mathrm{deg})^{-\gamma}$ with $A=(5.1\pm0.6)\times10^{-3}$ and $\gamma=0.74\pm0.16$, and that between 0.1 deg and 6 deg this matches the theoretical $w(\theta)$ computed from the Planck 2018 best-fit cosmology, the observed photometric redshift distribution, and the bias relation $b(z)=1.6+0.85z+0.33z^2$, without adjusting any model parameter. The same analysis finds $w(\theta)<10^{-2}$ at angular scales above 1 deg and a radio sky that is statistically isotropic at the percent level. A second, independent claim is that the counts-in-cells are non-Poissonian: a compound Poisson distribution fits the data well, with a clustering parameter $n_c$ that exceeds unity at low flux densities and approaches unity above roughly 1 mJy.
Load-bearing premise
The standard-model comparison stands or falls on the assumption that the photometric redshifts for the roughly half of sources that have them faithfully represent the true redshift distribution of the 2 mJy sample, since the paper does not propagate redshift errors or account for the missing half.
Editorial extensions
If this is right
- The most reliable clustering measurement is the 2 mJy, low-noise sample, with amplitude $A=(5.1\pm0.6)\times10^{-3}$ and slope $\gamma=0.74\pm0.16$ at 1 deg.
- Below 2 mJy, pointing-to-pointing flux-scale errors contaminate the correlation function; above 4 mJy, shot noise dominates.
- The counts-in-cell distribution is non-Poissonian and well fitted by a compound Poisson distribution, with $n_c$ above unity at sub-mJy fluxes.
- The radio sky is statistically isotropic at the percent level for angular scales above 1 deg.
- With the larger sky coverage and better flux calibration of future LoTSS releases, the same statistical pipeline can begin to constrain cosmological parameters such as $\sigma_8$ and the evolution of radio-source bias.
Reading between the lines
- I infer that the agreement with the standard model is only as strong as the photo-$z$ window: since half the sources lack redshifts and the paper does not propagate photo-$z$ errors, a selection bias in which sources receive a redshift could shift the predicted $w(\theta)$ by more than the quoted uncertainties.
- I read the low-redshift overprediction as evidence that mixed AGN and star-forming samples need separate bias functions; a direct extension would fit bias per redshift bin after accounting for photo-$z$ scatter.
- A testable corollary is that weighting sources by photo-$z$ uncertainties, or repeating the analysis with a spectroscopic subsample as it becomes available, should keep the predicted curve inside the measured band if the claimed agreement is robust.
Signed reviews
Editorial analysis
A structured set of objections, weighed in public.
Referee Report
Summary. This paper uses the LOFAR Two-metre Sky Survey first data release (LoTSS-DR1) to measure one- and two-point statistics of 144 MHz radio sources over 424 square degrees. The authors estimate point-source completeness by injecting sources into residual maps, define a set of masks and flux-density thresholds, and find that the counts-in-cell distribution is not Poissonian and is well described by a compound Poisson distribution. The differential source counts agree with earlier low-frequency surveys and with the SKADS and T-RECS simulations. The angular two-point correlation function, estimated with the Landy-Szalay estimator and TreeCorr, is fitted by a power law with best-fit values A = (5.1 +/- 0.6) x 10^-3 and gamma = 0.74 +/- 0.16 for the 2 mJy, low-noise ('mask 1') sample. The paper then compares w(theta) in the redshift-selected 'Anyz' sample with CAMB predictions based on Planck 2018 parameters, the z_best photometric-redshift histogram, and the Nusser and Tiwari (2016) bias model, reporting agreement between 0.1 and 6 degrees and concluding that the radio sky is statistically isotropic at the percent level.
Significance. If the conclusions hold, this paper establishes LoTSS-DR1 as a usable cosmological data set and provides one of the first robust measurements of the angular two-point correlation function at 144 MHz over a few hundred square degrees. The data-quality analysis is a clear strength: completeness is assessed by injecting sources and re-running PyBDSF, the random catalogues are built from local rms noise maps, five estimators are compared in Appendix B, and TreeCorr is validated against a brute-force code in Appendix C. The authors are also commendably explicit about their limitations. However, the headline cosmological consistency claim is conditional: the theoretical prediction depends on an external bias model and on the photometric-redshift distribution of only about half of the sources, with no propagation of photo-z errors. The measurement itself is solid, but the cosmological interpretation needs to be either strengthened by sensitivity tests or clearly downgraded to a consistency check under stated assumptions.
major comments (3)
- [Section 6.3, Eqs. (14) and (32), Fig. 25] The central claim that the measured w(theta) 'agrees well with the expectation of the cosmological standard model' is not yet established at the claimed precision, because the theoretical curve is computed from the z_best histogram as the source window function without propagating photometric-redshift errors, and with the external bias model b(z) = 1.6 + 0.85z + 0.33z^2 from Nusser and Tiwari (2016). The authors state in Section 6.2 that 'we did not estimate and propagate errors on the redshift estimation'; a biased or smeared N(z) shifts the predicted w(theta) directly, so the agreement shown in Fig. 25 could be fortuitous. I request a sensitivity analysis, such as convolving N(z) with the photo-z error distribution or repeating the prediction with an alternative redshift or bias model, and a correspondingly softened statement in the abstract and conclusions.
- [Section 5.3, Table 5, and Section 6.2] Only 24,420 out of 50,977 sources above 2 mJy in mask z (47.9%) have a z_best value, and Section 7 explicitly states that it is currently unclear how representative these sources are of the full sample. The agreement of the clustering parameter nc between sources with and without redshifts (Fig. 18) is a one-point statistic and does not guarantee that the two-point clustering of the 'Anyz' subsample equals that of the full LoTSS-DR1 population. To support the conclusion that LoTSS-DR1 sources as a whole are consistent with the standard model, the paper should either measure w(theta) for the No-z sample or model the selection function; otherwise the consistency statement should be restricted to the redshift-selected subsample.
- [Section 6.3, Fig. 26] The binned-redshift comparison shows that the adopted bias model fails in the lowest-redshift bin: the authors must reduce b1 from 1.6 to 1.2 to bring the model into agreement with the data. This demonstrates that the 'no adjusted parameters' agreement in the full Anyz sample is not a clean test of the standard model, since it can be an average over populations with different bias and redshift selection. The full-sample comparison should be presented as a consistency check under an assumed bias model, with the dependence of the conclusion on the bias assumption quantified.
minor comments (4)
- [Abstract and Section 7] The phrase 'The deviation from a nmhg distribution' contains a typographical error; it should presumably read 'Poisson' or 'compound Poisson distribution'.
- [Section 6.3] The text says the CAMB window function uses the observed redshift distribution 'for sources with z <= 2', but Fig. 16 shows counts up to z ~ 4; please clarify how the z > 2 tail is treated and whether omitting it could bias the prediction at small angular scales.
- [Table 6] The column labelled 'z' is used for both the redshift-binned rows and the rows with 'n.a.' for full samples; the caption should state explicitly that the reported A and gamma parameters are power-law fits to the angular correlation function, not constraints on cosmological parameters.
- [Fig. 5 caption] The caption refers to 'see also text in Sec. 5.3' for mask z, but mask z is first described in Section 6.2; the cross-reference should be corrected.
Circularity Check
Derivation is self-contained: prediction uses external Planck parameters, external NVSS bias model, and measured N(z); no fitted parameter is relabeled as a prediction.
full rationale
The central claim—that the measured angular two-point correlation of the LoTSS-DR1 2 mJy sample is consistent with the Planck 2018 ΛCDM expectation—is a genuine parameter-free comparison. The inputs to the CAMB prediction are the Planck 2018 best-fit parameters (external), the photometric redshift histogram from the LoTSS-DR1 value-added catalogue, and the bias model b(z) = 1.6 + 0.85z + 0.33z^2 from Nusser & Tiwari (2015)/Tiwari & Nusser (2016), a fit to NVSS data external to this paper. The paper states explicitly that 'we did not adjust any model parameter' (Sec. 6.3), and the power-law amplitudes and slopes in Table 6 are descriptive fits to the data, not inputs to the prediction. Using the same catalogue to provide both N(z) and w(θ) is not tautological: it is a conditional consistency test with fixed external cosmology and bias. The paper also flags its limitations honestly, noting in Sec. 6.2 that 'We did not estimate and propagate errors on the redshift estimation' and that only half the sources have redshifts, which is a systematic-uncertainty concern, not circular reasoning. The cited companion papers with overlapping authorship (Williams et al. 2019 for the value-added catalogue, Duncan et al. 2019 for photometric redshifts, Hale et al. 2018 for the mock-generation method) are data-products and methodology references, not self-citations carrying the theoretical argument; the mock is used only to build the random catalogue for the Landy-Szalay estimator and is verified to have negligible auto-correlation. No derivation step reduces by construction to its own inputs, and no fitted parameter is renamed as a prediction. Hence the circularity score is 0.
Assumptions & free parameters
free parameters (2)
- Power-law amplitude A (mask 1, 2 mJy) =
5.1 +/- 0.6 x 10^-3
- Power-law slope gamma (mask 1, 2 mJy) =
0.74 +/- 0.16
assumptions (4)
- domain assumption The theoretical angular power spectrum from CAMB sources, with Planck 2018 cosmological parameters and Halofit, is a correct prediction of the angular clustering of matter.
- domain assumption The bias model b(z) = 1.6 + 0.85z + 0.33z^2 (Nusser & Tiwari 2016, fitted to NVSS) approximately describes the bias of LoTSS radio sources at 144 MHz.
- domain assumption The photometric redshifts 'z_best' in the LoTSS-DR1 value-added catalogue are accurate enough for the redshift-split correlation measurements.
- domain assumption The mock catalogue generated from SKADS flux densities and LoTSS noise maps is an unbiased random catalogue for the Landy-Szalay estimator.
Cite this review
Pith. "Pith review of One- and Two-point Source Statistics from the LOFAR Two-metre Sky Survey First Data Release." pith.science (2026). https://pith.science/paper/CVSSXG2J
@misc{pith2026190810309,
  author       = {Pith},
  title        = {Pith review of: One- and Two-point Source Statistics from the LOFAR Two-metre Sky Survey First Data Release},
  year         = {2026},
  howpublished = {\url{https://pith.science/paper/CVSSXG2J}},
  note         = {Machine review of arXiv:1908.10309}
}
abstract
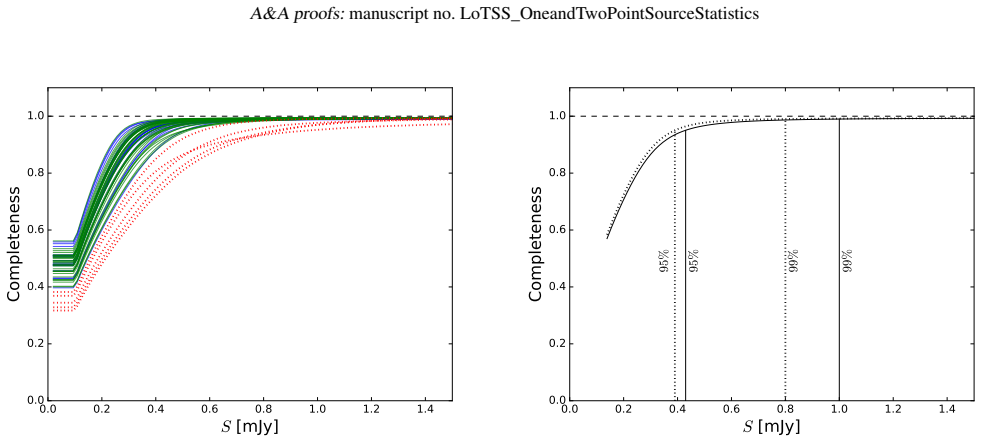
The LOFAR Two-metre Sky Survey (LoTSS) will map the complete Northern sky and provide an excellent opportunity to study the distribution and evolution of the large-scale structure of the Universe. We study the completeness of the LoTSS first data release (DR1) and find a point-source completeness of 99 % above flux densities of 0.8 mJy and define a suite of quality cuts. We determine the count-in-cell statistics and differential source counts statistic and measure the angular two-point correlation function of the LoTSS radio sources. The counts-in-cell statistic reveals that the distribution of radio sources cannot be described by a spatial Poisson process. Instead, a good fit is provided by a compound Poisson distribution. The differential source counts are in good agreement with previous findings in deep fields at low radio frequencies and with simulated catalogues from the SKA design study sky and the Tiered Radio Extragalactic Continuum Simulation. The angular two-point correlation is $<10^{-2}$ at angular scales $> 1$ deg. Restricting the value added source catalogue to low-noise regions and a flux density threshold of 2 mJy provides our most reliable estimate of the angular two-point correlation. For smaller flux density thresholds systematic issues are identified, most likely related to the flux density calibration of the individual pointings. Based on the distribution of photometric redshifts of LoTSS sources and the Planck 2018 best-fit cosmological model, the theoretically predicted angular two-point correlation between 0.1 deg and 6 deg agrees with the measured clustering for a subsample of radio sources with redshift information. We find agreement with the expectation of large-scale statistical isotropy of the radio sky at the per cent level. The angular two-point correlation agrees well with the expectation of the cosmological standard model. (abbreviated)
Figures


Figures from the paper (22 more)






Reference graph
Works this paper leans on
-
[1]
, " * write output.state after.block = add.period write newline
ENTRY address archiveprefix author booktitle chapter edition editor howpublished institution eprint journal key month note number organization pages publisher school series title type volume year label extra.label sort.label short.list INTEGERS output.state before.all mid.sentence after.sentence after.block FUNCTION init.state.consts #0 'before.all := #1 ...
-
[2]
write newline
" write newline "" before.all 'output.state := FUNCTION n.dashify 't := "" t empty not t #1 #1 substring "-" = t #1 #2 substring "--" = not "--" * t #2 global.max substring 't := t #1 #1 substring "-" = "-" * t #2 global.max substring 't := while if t #1 #1 substring * t #2 global.max substring 't := if while FUNCTION word.in bbl.in " " * FUNCTION format....
-
[3]
2008, Journal of Cosmology and Astro-Particle Physics, 2008, 013
Amendola , L., Kunz , M., & Sapone , D. 2008, Journal of Cosmology and Astro-Particle Physics, 2008, 013
2008
-
[4]
P., Tollerud , E
Astropy Collaboration , Robitaille , T. P., Tollerud , E. J., et al. 2013, , 558, A33
2013
-
[5]
& Maartens , R
Ballardini , M. & Maartens , R. 2019, , 485, 1339
2019
-
[6]
Bengaly , C. A. P., Maartens , R., & Santos , M. G. 2018, Journal of Cosmology and Astro-Particle Physics, 2018, 031
2018
-
[7]
Bengaly , C. A. P., Siewert , T. M., Schwarz , D. J., & Maartens , R. 2019, , 486, 1350
2019
-
[8]
Berlind , A. A. & Weinberg , D. H. 2002, , 575, 587
2002
Show all 92 references
-
[9]
2019, Master's thesis, Bielefeld University, Bielefeld, Germany
Biermann, M. 2019, Master's thesis, Bielefeld University, Bielefeld, Germany
2019
-
[10]
Blake , C., Mauch , T., & Sadler , E. M. 2004, , 347, 787
2004
-
[11]
& Wall , J
Blake , C. & Wall , J. 2002, , 337, 993
2002
-
[12]
2018, ArXiv e-prints [ [arXiv] 1805.05222 ]
Bonaldi , A., Bonato , M., Galluzzi , V., et al. 2018, ArXiv e-prints [ [arXiv] 1805.05222 ]
2018 arXiv
-
[13]
G., Bacon , D
Camera , S., Santos , M. G., Bacon , D. J., et al. 2012, , 427, 2079
2012
-
[14]
& Lewis , A
Challinor , A. & Lewis , A. 2011, , 84, 043516
2011
-
[15]
& Polarski , D
Chevallier , M. & Polarski , D. 2001, International Journal of Modern Physics D, 10, 213
2001
-
[16]
Condon , J. J. 1988, Radio sources and cosmology , ed. K. I. Kellermann & G. L. Verschuur , 641--678
1988
-
[17]
J., Cotton , W
Condon , J. J., Cotton , W. D., Greisen , E. W., et al. 1998, , 115, 1693
1998
-
[18]
M., Helfand , D
Cress , C. M., Helfand , D. J., Becker , R. H., Gregg , M. D., & White , R. L. 1996, , 473, 7
1996
-
[19]
2008, , 77, 123514
Dalal , N., Dor \'e , O., Huterer , D., & Shirokov , A. 2008, , 77, 123514
2008
-
[20]
& Peebles , P
Davis , M. & Peebles , P. J. E. 1983, The Astrophysical Journal, 267, 465
1983
-
[21]
T., & Frail , D
de Gasperin , F., Intema , H. T., & Frail , D. A. 2018, , 474, 5008
2018
-
[22]
2019, , 623, A148
Dolfi , A., Branchini , E., Bilicki , M., et al. 2019, , 623, A148
2019
-
[23]
J., Sabater , J., R \"o ttgering , H
Duncan , K. J., Sabater , J., R \"o ttgering , H. J. A., et al. 2019, , 622, A3
2019
-
[24]
Ellis , G. F. R. & Baldwin , J. E. 1984, , 206, 377
1984
-
[25]
Fanaroff , B. L. & Riley , J. M. 1974, , 167, 31P
1974
-
[26]
D., Santos , M
Ferramacho , L. D., Santos , M. G., Jarvis , M. J., & Camera , S. 2014, , 442, 2511
2014
-
[27]
Franzen , T. M. O., Jackson , C. A., Offringa , A. R., et al. 2016, , 459, 3314
2016
-
[28]
M., Hivon , E., Banday , A
G \'o rski , K. M., Hivon , E., Banday , A. J., et al. 2005, , 622, 759
2005
-
[29]
L., Jarvis , M
Hale , C. L., Jarvis , M. J., Delvecchio , I., et al. 2018, , 474, 4133
2018
-
[30]
Hamilton , A. J. S. 1993, , 417, 19
1993
-
[31]
J., Williams , W
Hardcastle , M. J., Williams , W. L., Best , P. N., et al. 2019, Astronomy and Astrophysics, 622, A12
2019
-
[32]
Hatfield , P. W. & Jarvis , M. J. 2017, , 472, 3570
2017
-
[33]
W., Lindsay , S
Hatfield , P. W., Lindsay , S. N., Jarvis , M. J., et al. 2016, , 459, 2618
2016
-
[34]
Hewett , P. C. 1982, , 201, 867
1982
-
[35]
J., & Condon , J
Heywood , I., Jarvis , M. J., & Condon , J. J. 2013, , 432, 2625
2013
-
[36]
R., Hancock , P
Hurley-Walker , N., Callingham , J. R., Hancock , P. J., et al. 2017, , 464, 1146
2017
-
[37]
J., Arnalte-Mur , P., et al
Hurtado-Gil , L., Mart \' nez , V. J., Arnalte-Mur , P., et al. 2017, , 601, A40
2017
-
[38]
T., Jagannathan , P., Mooley , K
Intema , H. T., Jagannathan , P., Mooley , K. P., & Frail , D. A. 2017, , 598, A78
2017
-
[39]
2006, Statistical methods in experimental physics, 2nd edn
James, F. 2006, Statistical methods in experimental physics, 2nd edn. (Hackensack, NJ: World Scientific)
2006
-
[40]
2015, in PoS(AASKA14), 018
Jarvis , M., Bacon , D., Blake , C., et al. 2015, in PoS(AASKA14), 018
2015
-
[41]
2004, , 352, 338
Jarvis , M., Bernstein , G., & Jain , B. 2004, , 352, 338
2004
-
[42]
Kerscher , M., Szapudi , I., & Szalay , A. S. 2000, , 535, L13
2000
-
[43]
L., Burns , J
Kooiman , B. L., Burns , J. O., & Klypin , A. A. 1995, , 448, 500
1995
-
[44]
Landy , S. D. & Szalay , A. S. 1993, , 412, 64
1993
-
[45]
Limber , D. N. 1953, , 117, 134
1953
-
[46]
Linder , E. V. 2003, Physical Review Letters, 90, 091301
2003
-
[47]
N., Barrow , J
Ling , E. N., Barrow , J. D., & Frenk , C. S. 1986, , 223, 21
1986
-
[48]
B., Jarvis , M., & Santos , M
Maartens , R., Abdalla , F. B., Jarvis , M., & Santos , M. G. 2015, PoS(AASKA14), 016
2015
-
[49]
J., Lahav , O., & Wall , J
Magliocchetti , M., Maddox , S. J., Lahav , O., & Wall , J. V. 1998, , 300, 257
1998
-
[50]
K., Morganti , R., Prandoni , I., et al
Mahony , E. K., Morganti , R., Prandoni , I., et al. 2016, , 463, 2997
2016
-
[51]
& Verde , L
Matarrese , S. & Verde , L. 2008, , 677, L77
2008
-
[52]
2015, , 454, 1958
Mead, A., Peacock, J., Heymans, C., Joudaki, S., & Heavens, A. 2015, , 454, 1958
2015
-
[53]
Mo , H. J. & White , S. D. M. 1996, , 282, 347
1996
-
[54]
& Rafferty , D
Mohan , N. & Rafferty , D. 2015, PyBDSF: Python Blob Detection and Source Finder , Astrophysics Source Code Library
2015
-
[55]
B., et al
Newville , M., Stensitzki , T., Allen , D. B., et al. 2016 [ [ascl] 1606.014 ]
2016
-
[56]
& Tiwari , P
Nusser , A. & Tiwari , P. 2015, , 812, 85
2015
-
[57]
A., R \"o ttgering , H
Overzier , R. A., R \"o ttgering , H. J. A., Rengelink , R. B., & Wilman , R. J. 2003, , 405, 53
2003
-
[58]
Peebles , P. . E. & Hauser , M. G. 1974, , 28, 19
1974
-
[59]
Peebles , P. J. E. 1980, The large-scale structure of the universe (Princeton University Press)
1980
-
[60]
Peebles , P. J. E. 1993, Principles of Physical Cosmology (Princeton University Press)
1993
-
[61]
Planck Collaboration , Ade , P. A. R., Aghanim , N., et al. 2016, , 594, A16
2016
-
[62]
2018 a , arXiv e-prints [ [arXiv] 1807.06209 ]
Planck Collaboration , Aghanim , N., Akrami , Y., et al. 2018 a , arXiv e-prints [ [arXiv] 1807.06209 ]
2018 arXiv
-
[63]
2018 b , arXiv e-prints [ [arXiv] 1807.06205 ]
Planck Collaboration , Akrami , Y., Arroja , F., et al. 2018 b , arXiv e-prints [ [arXiv] 1807.06205 ]
2018 arXiv
-
[64]
2019, arXiv e-prints [ [arXiv] 1906.02552 ]
Planck Collaboration , Akrami , Y., Ashdown , M., et al. 2019, arXiv e-prints [ [arXiv] 1906.02552 ]
2019 arXiv
-
[65]
J., Stoyan , D., Stoyan , H., & Saar , E
Pons-Border \' a , M.-J., Mart \' nez , V. J., Stoyan , D., Stoyan , H., & Saar , E. 1999, The Astrophysical Journal, 523, 480
1999
-
[66]
J., et al
Raccanelli , A., Dor \'e , O., Bacon , D. J., et al. 2015, , 2015, 042
2015
-
[67]
J., et al
Raccanelli , A., Zhao , G.-B., Bacon , D. J., et al. 2012, , 424, 801
2012
-
[68]
& Bagla , J
Rana , S. & Bagla , J. S. 2019, , 485, 5891
2019
-
[69]
1999, in The Most Distant Radio Galaxies, ed
Rengelink , R. 1999, in The Most Distant Radio Galaxies, ed. H. J. A. R \"o ttgering , P. N. Best , & M. D. Lehnert , 399
1999
-
[70]
Rottgering , H. J. A. 2010, in ISKAF2010 Science Meeting, 50
2010
-
[71]
& Schwarz , D
Rubart , M. & Schwarz , D. J. 2013, Astronomy and Astrophysics, 555, A117
2013
-
[72]
N., Hardcastle , M
Sabater , J., Best , P. N., Hardcastle , M. J., et al. 2019, Astronomy and Astrophysics, 622, A17
2019
-
[73]
Sheth , R. K. & Tormen , G. 1999, , 308, 119
1999
-
[74]
W., R \"o ttgering , H
Shimwell , T. W., R \"o ttgering , H. J. A., Best , P. N., et al. 2017, , 598, A104
2017
-
[75]
W., Tasse , C., Hardcastle , M
Shimwell , T. W., Tasse , C., Hardcastle , M. J., et al. 2019, , 622, A1
2019
-
[76]
Smith , D. J. B., Best , P. N., Duncan , K. J., et al. 2016, in SF2A-2016: Proceedings of the Annual meeting of the French Society of Astronomy and Astrophysics, ed. C. Reyl \'e , J. Richard , L. Cambr \'e sy , M. Deleuil , E. P \'e contal , L. Tresse , & I. Vauglin , 271--280
2016
-
[77]
J., Battye , R
Square Kilometre Array Cosmology Science Working Group , Bacon , D. J., Battye , R. A., et al. 2018, arXiv e-prints [ [arXiv] 1811.02743 ]
2018 arXiv
-
[78]
2012, , 761, 152
Takahashi, R., Sato, M., Nishimichi, T., Taruya, A., & Oguri, M. 2012, , 761, 152
2012
-
[79]
2016, arXiv e-prints [ [arXiv] 1609.01308 ]
Tiwari , P. 2016, arXiv e-prints [ [arXiv] 1609.01308 ]
2016 arXiv
-
[80]
& Nusser , A
Tiwari , P. & Nusser , A. 2016, Journal of Cosmology and Astro-Particle Physics, 2016, 062
2016
-
[81]
& Kihara , T
Totsuji , H. & Kihara , T. 1969, , 21, 221
1969
-
[82]
P., Wise , M
van Haarlem , M. P., Wise , M. W., Gunst , A. W., et al. 2013, , 556, A2
2013
-
[83]
E., Hamilton , J
Vargas-Maga \ n a , M., Bautista , J. E., Hamilton , J. C., et al. 2013, , 554, A131
2013
-
[84]
L., Hardcastle , M
Williams , W. L., Hardcastle , M. J., Best , P. N., et al. 2019, , 622, A2
2019
-
[85]
L., van Weeren , R
Williams , W. L., van Weeren , R. J., R \"o ttgering , H. J. A., et al. 2016, , 460, 2385
2016
-
[86]
J., Jarvis , M
Wilman , R. J., Jarvis , M. J., Mauch , T., Rawlings , S., & Hickey , S. 2010, , 405, 447
2010
-
[87]
J., Miller , L., Jarvis , M
Wilman , R. J., Miller , L., Jarvis , M. J., et al. 2008, , 388, 1335
2008
-
[88]
J., & van den Bosch , F
Yang , X., Mo , H. J., & van den Bosch , F. C. 2003, , 339, 1057
2003
-
[89]
H., Zheng , Z., et al
Zehavi , I., Weinberg , D. H., Zheng , Z., et al. 2004, , 608, 16
2004
-
[90]
2010, , 81, 103510
Zhao , G.-B., Giannantonio , T., Pogosian , L., et al. 2010, , 81, 103510
2010
-
[91]
A., Weinberg , D
Zheng , Z., Berlind , A. A., Weinberg , D. H., et al. 2005, , 633, 791
2005
-
[92]
& Kokoska, S
Zwillinger, D. & Kokoska, S. 2000, CRC standard probability and statistics tables and formulae (Boca Raton: Chapman and Hall/CRC)
2000
Reviewed August 14, 2026 · model on record in the stance chip above.
Discussion (0). Continue with ORCID to comment.