REVIEW 2 major objections 6 minor 4 cited by
Carbon, oxygen, and iron abundances in disk and halo stars. Implications of 3D non-LTE spectral line formation
T0 review · 2 major / 6 minor · reviewed 2026-08-14 · deepseek-v4-flash
Pith's one-line read Corrected abundances show C/O falling steadily in metal-poor stars
desk verdict This paper resets the baseline for C/O trends with the first 3D non-LTE grids for C I and 3D LTE grids for Fe II, and the central conclusion is probably right, but the metal-poor C I corrections rest on UV pumping that is only indirectly validated. read the letter →
The pith
A machine-rendered reading of the paper's core claim, the machinery that carries it, and where it could break.
The reading
What carries the argument
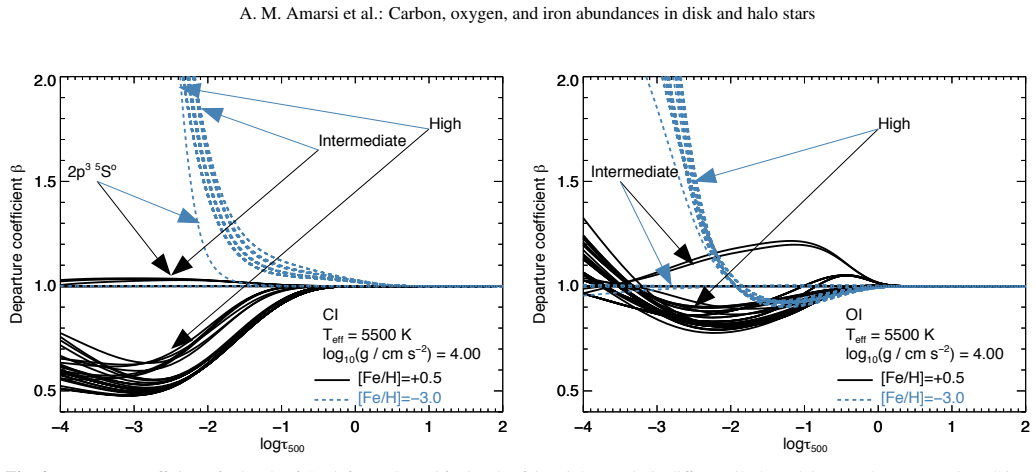
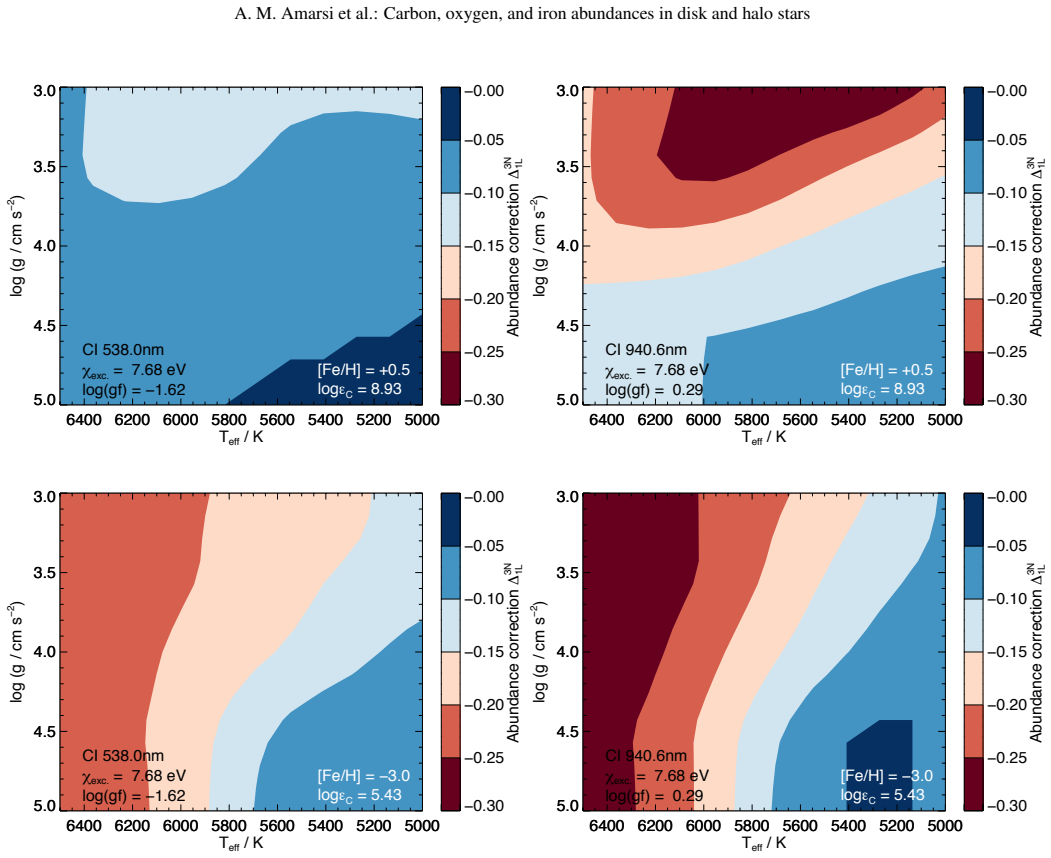
The departure coefficients $\beta = n_{NLTE}/n_{LTE}$ computed for the levels of C I and O I in 3D model atmospheres. Two competing mechanisms set them: at high metallicity, photon losses in strong permitted lines drain level populations and strengthen the lines; at low metallicity, UV photons between 160 and 250 nm pump C I low-excitation levels into intermediate levels, overpopulating them and again strengthening lines. The abundance correction $\Delta = \log\epsilon_{3D,NLTE} - \log\epsilon_{1D,LTE}$ for each line carries these effects into abundance space.
What would settle it
Measure abundances of a metal-poor F dwarf ($T_{\rm eff}\approx 6000$ K, $[Fe/H]\approx -2$) from the permitted C I 940.6 nm and O I 777 nm lines and from the forbidden $[C I]$ 872.7 nm and $[O I]$ 630.0 nm lines; the 3D non-LTE corrections predict that both sets agree after correction, whereas 1D LTE predicts offsets of several tenths of a dex. A direct test is also possible from solar observations: compare predicted and observed center-to-limb behaviour of the UV C I lines around 160-250 nm.
Extended reading notes
Core claim
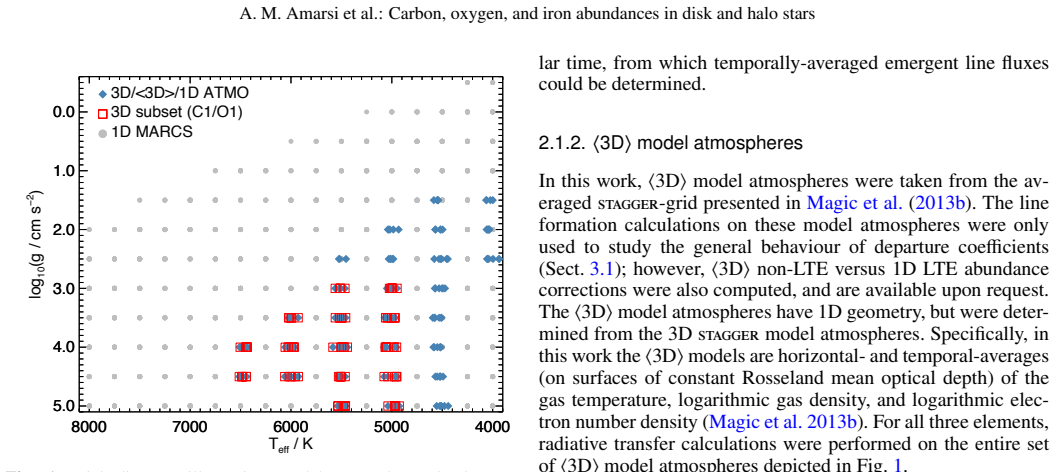
Using 3D hydrodynamic model atmospheres and non-LTE statistical equilibrium for C I and O I, the paper computes line-by-line abundance corrections relative to the standard 1D LTE approximation. The corrections are negative almost everywhere: up to $-0.3$ dex for C I in low-metallicity F dwarfs and $-0.6$ dex for O I in high-metallicity F dwarfs, with Fe II corrections below $+0.15$ dex. Applied to 187 F and G dwarfs, they reduce scatter in $[C/Fe]$, $[O/Fe]$, and $[C/O]$, and change the mean trends: the 1D LTE turnover in $[C/O]$ at $[O/H]\approx -1$ disappears, replaced by a monotonic decrease to a plateau of $[C/O]\approx -0.6$ below $[O/H]\approx -1$. The paper concludes that the previously reported minimum is a line-formation artifact, not a nucleosynthesis signature, and that thin-disk stars with confirmed planets have higher C/O at fixed $[O/H]$.
Load-bearing premise
The correction grids are only as good as the atomic data, specifically the ab initio inelastic hydrogen and electron collision cross-sections and the UV line opacities in the atomic models, and these are validated only against solar disk-centre-to-limb measurements, not against metal-poor stars.
Editorial extensions
If this is right
- Galactic chemical evolution conclusions for C and O in FGK dwarfs shift: plateau values of $[O/Fe]\approx 0.6$ and the monotonic $[C/O]$ trend supersede the 1D LTE picture.
- The public correction grids make it cheap to upgrade abundances in large surveys, including planned and ongoing surveys of more than $10^6$ stars, from 1D LTE values.
- For permitted C I and O I lines, 1D non-LTE modelling should replace 1D LTE when 3D non-LTE is unavailable, since 3D effects mostly enhance non-LTE effects.
- The apparent C/O-planet connection is only visible after the corrections; this motivates using corrected abundances in exoplanet host-star characterisation.
- Stellar ages based on isochrones are expected to change, since C and O influence CNO burning and interior opacity.
Reading between the lines
- If CH-line 3D LTE corrections are as severe as $-1$ dex, as the paper notes, the reported fraction of carbon-enhanced metal-poor stars in the Galaxy may be substantially overestimated by 1D LTE analyses.
- The same correction logic should apply to oxygen in dwarf satellite galaxies; applying it to those stellar populations would make the comparison with the low-$\alpha$ halo more direct.
- Because differential O I corrections relative to the Sun become positive at low metallicity, $[O/Fe]$ and $[C/O]$ trends from any survey that uses 1D LTE with a solar reference will be systematically tilted; this paper's grids quantify that tilt.
- One could test the mechanism's extrapolation by checking whether ultraviolet pumping of C I is similarly strong in hotter subgiants, where the corrections are predicted to grow.
Signed reviews
Editorial analysis
A structured set of objections, weighed in public.
Referee Report
Summary. The manuscript presents 3D non-LTE abundance correction grids for C I and O I lines and 3D LTE grids for Fe II lines, computed on the STAGGER grid of hydrodynamic model atmospheres, and applies these corrections to 1D LTE literature abundances of 187 F and G dwarfs in the Milky Way disk and halo. The corrections reach about -0.3 dex for C I lines in low-metallicity F dwarfs and about -0.6 dex for O I lines in high-metallicity F dwarfs. After correction, the authors report reduced scatter in abundance trends, a monotonic decrease of [C/O] with [O/H] down to a plateau near [C/O] ≈ -0.6, and a tentative enhancement of C/O among planet-hosting thin-disk stars. The correction grids are made publicly available.
Significance. If the corrections are accurate, this is a valuable contribution: it provides a reusable grid of line-by-line abundance corrections for late-type stars, demonstrates the impact of 3D non-LTE effects on Galactic chemical evolution trends, and offers a falsifiable prediction that removes the need for exotic nucleosynthesis to explain the [C/O] turnover at [O/H] ≈ -1. Strengths include the use of ab initio inelastic collision data, solar centre-to-limb validation of the atomic models, public release of the correction grids, and a careful re-analysis of a homogeneous literature sample. The central risk is that the low-metallicity C I corrections, which set the [C/O] plateau, rest on a UV pumping mechanism not directly validated outside the solar photon-loss regime.
major comments (2)
- [Sect. 3.1.1 and Sect. 5.5] The low-metallicity C I corrections that drive the claimed [C/O] plateau rely on non-thermal UV photon pumping through C I lines near 160-250 nm, as described in Sect. 3.1.1. The only external test cited (Sect. 1; Amarsi et al. 2019a) is solar centre-to-limb variation, which probes the high-metallicity photon-loss regime rather than the metal-poor pumping regime. The pumping rate depends on background UV opacities and on inelastic H-collision rates that are not directly benchmarked at [Fe/H] ≈ -2 to -3. A systematic error of order 0.1-0.2 dex in these corrections would alter the slope and plateau level of [C/O] versus [O/H] and could restore the 1D LTE turnover at [O/H] ≈ -1. The authors should present a sensitivity test (for example, varying the inelastic H-collision rates or the UV background opacities within plausible bounds) and report the resulting spread in the final abundance trends.
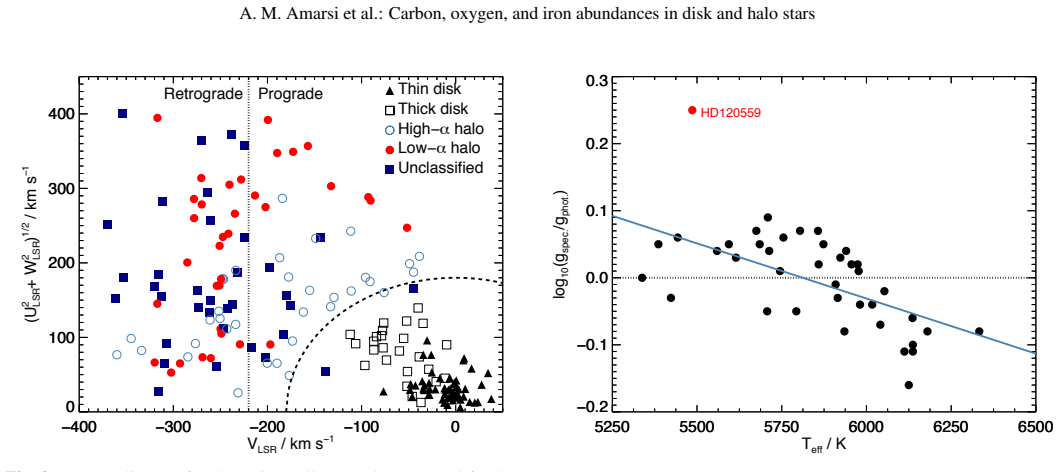
- [Sect. 4.2 and Sect. 5.5] The stellar parameters used to apply the correction grids are adopted from 1D LTE analyses (Sect. 4.2) and are not re-derived self-consistently under the 3D non-LTE line formation models. For the UVES-FIES sample, Teff and log g come from differential 1D LTE analyses of Fe I and Fe II lines; Sect. 4.3 discusses only the surface-gravity side and shows that 0.1 dex uncertainties in log g have a small effect. However, the effective temperature also enters the interpolated corrections, and given that Fe I lines are subject to 3D non-LTE effects (as argued in Sect. 4.3), a Teff bias of order 100 K is not excluded. Such a bias changes the low-metallicity C I corrections by a few hundredths of a dex (Fig. 5) and, more importantly, changes the differential correction between the Sun and metal-poor stars. The authors should quantify the sensitivity of the final [C/O] versus [O/H] trend to correlated shifts in Teff, log g, and [Fe/H], or re-derive parameters for a subset of stars using 3D non-LTE Fe II and C I lines.
minor comments (6)
- [Sect. 3.2.4] The text states that the 3D LTE versus 1D LTE abundance corrections for Fe II lines are 'positive' but then gives a typical range that includes -0.05 dex for lines of intermediate excitation potential; please reconcile these statements.
- [Sect. 3.1.1] The sentence beginning 'Non-thermal UV photons pump...' is a run-on after the preceding clause and should be broken into a separate sentence.
- [Sect. 5.4] In the text 'C /O2 versus [O/H]' should read 'C/O versus [O/H]'.
- [Fig. 2 caption and Sect. 2.1.3] The parameter written as '3conv' appears to be a typo for the mixing-length parameter (likely αconv); please correct it in the figure caption and text.
- [Throughout] The formatting of chemical species is inconsistent, with 'Ci', 'Oi', and 'Feii' appearing in several places; please use 'C I', 'O I', and 'Fe II' consistently.
- [Sect. 6] The citation 'Amarsi et al. 2019b' in the final paragraph should include a comma after 'al.'.
Circularity Check
No circularity: the abundance corrections are forward model predictions benchmarked externally, and the stellar abundance trends are outputs rather than fitted inputs.
full rationale
The paper's core claim is the set of 3D non-LTE versus 1D LTE abundance corrections defined in Eq. 1 and the resulting C, O, Fe abundance trends in Sect. 5. These corrections are computed from radiative transfer on STAGGER-grid model atmospheres using C I and O I atomic models with ab initio collisional data cited from prior work (Amarsi et al. 2018a, 2019a); they are not fitted to the 187-star sample or to any adopted [C/Fe], [O/Fe], or [C/O] trend. The re-analysis in Sect. 4 simply interpolates these precomputed correction grids and applies them to literature 1D LTE abundances, with no feedback from the resulting abundances into the models. The claimed monotonic decrease of [C/O] to a plateau near -0.6 (Sect. 5.5 and Conclusion) is a consequence of the differential corrections, not an input to them. The self-citations that provide the atomic models are supported by independent solar center-to-limb variation measurements, which are an external benchmark and do not depend on the stellar sample or the derived Galactic chemical evolution trends. The skeptic's concern that low-metallicity C I corrections are driven by UV pumping that is not directly validated outside the Sun is a legitimate accuracy/robustness limitation, but it is not circularity: the magnitude and metallicity dependence of the corrections are not tuned to reproduce the observed stellar abundance patterns. Therefore no step in the derivation chain reduces to its own inputs by construction.
Assumptions & free parameters
free parameters (1)
- Unsöld broadening enhancement factor =
2.0 for C I and O I; 1.5 for Fe II
assumptions (4)
- domain assumption 3D hydrodynamic STAGGER-grid model atmospheres represent the real atmospheres of late-type stars more accurately than 1D hydrostatic models.
- domain assumption Fe II lines have negligible non-LTE effects in 3D atmospheres for the considered parameter range, based on 1D non-LTE calculations of Lind et al. 2012.
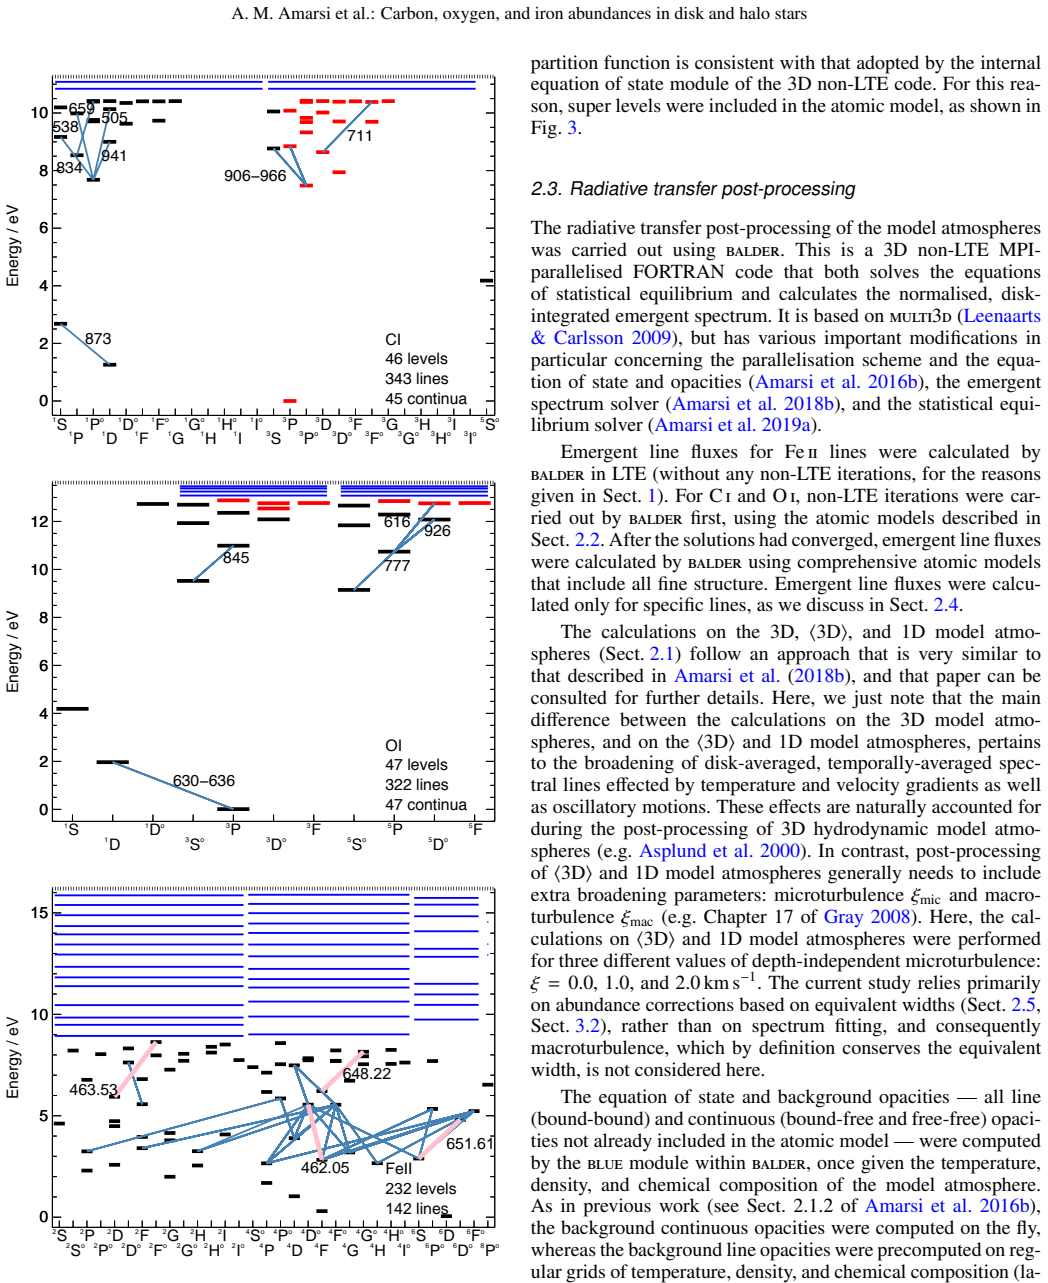
- domain assumption The C I 'No-FS' and O I 'reduced' atomic models with ab initio hydrogen collision data are accurate across the parameter grid.
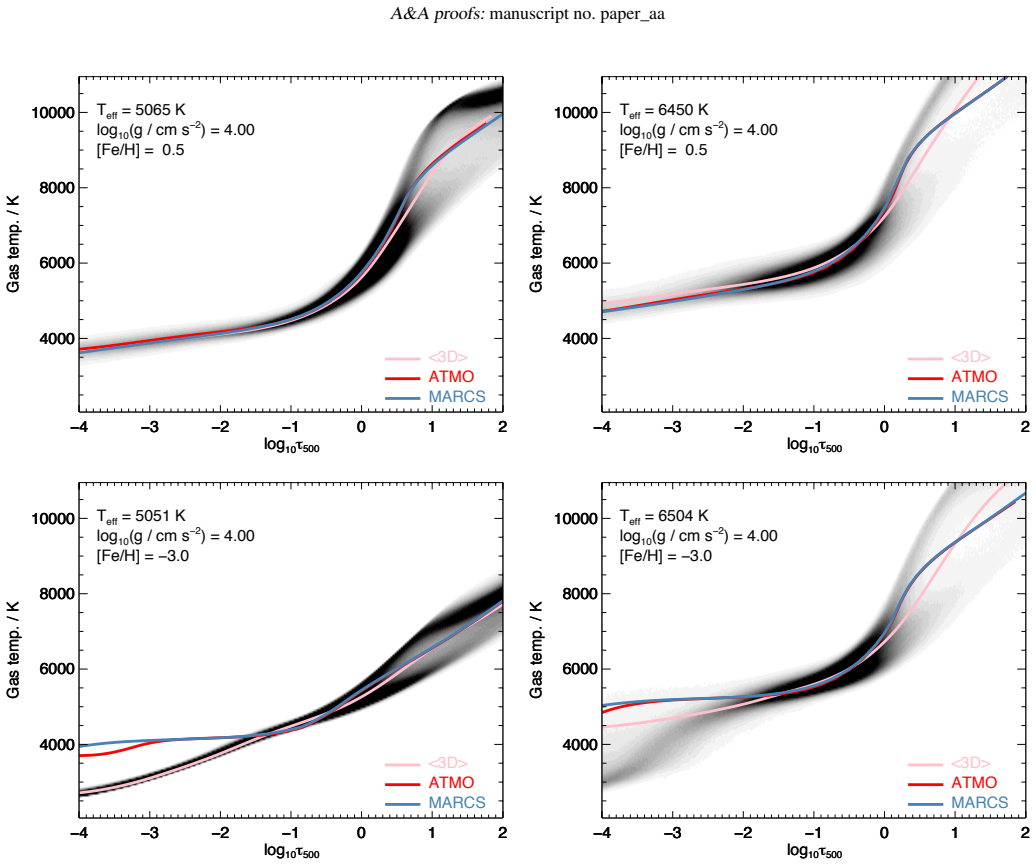
- domain assumption The mixing-length theory parameters in the 1D models (alpha_MLT = 1.5, y = 0.076, conv = 8.0) reproduce the 3D grid's mean stratification sufficiently well.
Cite this review
Pith. "Pith review of Carbon, oxygen, and iron abundances in disk and halo stars. Implications of 3D non-LTE spectral line formation." pith.science (2026). https://pith.science/paper/W7ZH42MC
@misc{pith2026190810319,
  author       = {Pith},
  title        = {Pith review of: Carbon, oxygen, and iron abundances in disk and halo stars. Implications of 3D non-LTE spectral line formation},
  year         = {2026},
  howpublished = {\url{https://pith.science/paper/W7ZH42MC}},
  note         = {Machine review of arXiv:1908.10319}
}
abstract
The abundances of carbon, oxygen, and iron in late-type stars are important parameters in exoplanetary and stellar physics, as well as key tracers of stellar populations and Galactic chemical evolution. We carried out three-dimensional (3D) non-LTE radiative transfer calculations for CI and OI, and 3D LTE radiative transfer calculations for FeII, across the STAGGER-grid of 3D hydrodynamic model atmospheres. The absolute 3D non-LTE versus 1D LTE abundance corrections can be as severe as $-0.3$ dex for CI lines in low-metallicity F dwarfs, and $-0.6$ dex for OI lines in high-metallicity F dwarfs. The 3D LTE versus 1D LTE abundance corrections for FeII lines are less severe, typically less than $+0.15$ dex. We used the corrections in a re-analysis of carbon, oxygen, and iron in $187$ F and G dwarfs in the Galactic disk and halo. Applying the differential 3D non-LTE corrections to 1D LTE abundances visibly reduces the scatter in the abundance plots. The thick disk and high-$\alpha$ halo population rise in carbon and oxygen with decreasing metallicity, and reach a maximum of [C/Fe]$\approx0.2$ and a plateau of [O/Fe]$\approx0.6$ at [Fe/H]$\approx-1.0$. The low-$\alpha$ halo population is qualitatively similar, albeit offset towards lower metallicities and with larger scatter. Nevertheless, these populations overlap in the [C/O] versus [O/H] plane, decreasing to a plateau of [C/O]$\approx-0.6$ below [O/H]$\approx-1.0$. In the thin-disk, stars having confirmed planet detections tend to have higher values of C/O at given [O/H]; this potential signature of planet formation is only apparent after applying the abundance corrections to the 1D LTE results. Our grids of line-by-line abundance corrections are publicly available and can be readily used to improve the accuracy of spectroscopic analyses of late-type stars.
Figures
Figures from the paper (11 more)




Forward citations
Cited by 4 Pith papers
-
Why is GN-z11 Bright, Compact, and Nitrogen Enhanced? Insights from UV Absorption and Emission Diagnostics
The UV continuum of the early galaxy GN-z11 is dominated by massive stars, and its extreme nitrogen enhancement is likely localized to dense gas enriched by stellar winds.
-
Evidence for elemental diffusion in the eclipsing binary star AI Phoenicis
In the eclipsing binary AI Phe, the hotter component is depleted in Fe and Mg relative to its cooler subgiant companion by about 0.1 dex, matching the atomic-diffusion signature seen in the open cluster M67.
-
Is the composition of the Solar atmosphere unusual, and if so, why? Possible interpretations
A review of the 10-20% solar volatile-to-refractory excess relative to solar twins, weighing galactic, protoplanetary, and planetary-ingestion explanations and finding no decisive answer.
-
3D Non-LTE radiation transfer: theory and applications to stars, exoplanets, and kilonovae
A field review of 3D non-LTE radiative transfer argues that 1D LTE treatments of stellar, exoplanet, and kilonova spectra carry systematic abundance biases that 3D NLTE modeling can now remove.
Reference graph
Works this paper leans on
-
[1]
2019, Geosciences, 9, 105
Adibekyan, V . 2019, Geosciences, 9, 105
2019
-
[2]
Z., Figueira, P., Santos, N
Adibekyan, V . Z., Figueira, P., Santos, N. C., et al. 2013, A&A, 554, A44
2013
-
[3]
J., Carigi, L., Nissen, P
Akerman, C. J., Carigi, L., Nissen, P. E., Pettini, M., & Asplund, M. 2004, A&A, 414, 931
2004
-
[4]
L., Chen, X., Ciardi, D., et al
Akeson, R. L., Chen, X., Ciardi, D., et al. 2013, PASP, 125, 989 Allende Prieto, C., Asplund, M., & Fabiani Bendicho, P. 2004, A&A, 423, 1109 Allende Prieto, C., Lambert, D. L., & Asplund, M. 2001, ApJ, 556, L63
2013
-
[5]
Amarsi, A. M. & Asplund, M. 2017, MNRAS, 464, 264
2017
-
[6]
M., Asplund, M., Collet, R., & Leenaarts, J
Amarsi, A. M., Asplund, M., Collet, R., & Leenaarts, J. 2015, MNRAS, 454, L11
2015
-
[7]
Amarsi, A. M. & Barklem, P. S. 2019, A&A, 625, A78
2019
-
[8]
& Francis, C
Anderson, E. & Francis, C. 2012, Astronomy Letters, 38, 331
2012
Show all 109 references
-
[9]
Anstee, S. D. & O’Mara, B. J. 1995, MNRAS, 276, 859
1995
-
[10]
C., Christlieb, N., et al
Aoki, W., Beers, T. C., Christlieb, N., et al. 2007, ApJ, 655, 492
2007
-
[11]
2005, ARA&A, 43, 481
Asplund, M. 2005, ARA&A, 43, 481
2005
-
[12]
J., & Scott, P
Asplund, M., Grevesse, N., Sauval, A. J., & Scott, P. 2009, ARA&A, 47, 481
2009
-
[13]
Asplund, M., Nordlund, Å., Trampedach, R., Allende Prieto, C., & Stein, R. F. 2000, A&A, 359, 729
2000
-
[14]
Asplund, M., Nordlund, Å., Trampedach, R., & Stein, R. F. 1999, A&A, 346, L17
1999
-
[15]
Barklem, P. S. 2018, A&A, 610, A57
2018
-
[16]
S., Belyaev, A
Barklem, P. S., Belyaev, A. K., Guitou, M., et al. 2011, A&A, 530, A94
2011
-
[17]
Barklem, P. S. & O’Mara, B. J. 1997, MNRAS, 290, 102
1997
-
[18]
S., O’Mara, B
Barklem, P. S., O’Mara, B. J., & Ross, J. E. 1998, MNRAS, 296, 1057
1998
-
[19]
S., Osorio, Y ., Fursa, D
Barklem, P. S., Osorio, Y ., Fursa, D. V ., et al. 2017, A&A, 606, A11
2017
-
[20]
& Antia, H
Basu, S. & Antia, H. M. 2008, Phys. Rep., 457, 217
2008
-
[21]
L., Meléndez, J., et al
Bedell, M., Bean, J. L., Meléndez, J., et al. 2018, ApJ, 865, 68
2018
-
[22]
K., V oronov, Y
Belyaev, A. K., V oronov, Y . V ., & Gadéa, F. X. 2018, ApJ, 867, 87
2018
-
[23]
Bensby, T., Feltzing, S., & Oey, M. S. 2014, A&A, 562, A71
2014
-
[24]
A., Erb, D
Berg, D. A., Erb, D. K., Henry, R. B. C., Skillman, E. D., & McQuinn, K. B. W. 2019, ApJ, 874, 93
2019
-
[25]
A., Skillman, E
Berg, D. A., Skillman, E. D., Henry, R. B. C., Erb, D. K., & Carigi, L. 2016, ApJ, 827, 126 Böhm-Vitense, E. 1958, ZAp, 46, 108
2016
-
[26]
E., Nelan, E
Bond, H. E., Nelan, E. P., VandenBerg, D. A., Schaefer, G. H., & Harmer, D. 2013, ApJ, 765, L12
2013
-
[27]
Brewer, J. M. & Fischer, D. A. 2016, ApJ, 831, 20
2016
-
[28]
2018, MNRAS, 478, 4513
Buder, S., Asplund, M., Duong, L., et al. 2018, MNRAS, 478, 4513
2018
-
[29]
K., et al
Buder, S., Lind, K., Ness, M. K., et al. 2019, A&A, 624, A19
2019
-
[30]
2005, ApJ, 623, 213
Carigi, L., Peimbert, M., Esteban, C., & García-Rojas, J. 2005, ApJ, 623, 213
2005
-
[31]
C., et al
Carollo, D., Freeman, K., Beers, T. C., et al. 2014, ApJ, 788, 180
2014
-
[32]
2010, A&A, 512, A54
Casagrande, L., Ramírez, I., Meléndez, J., Bessell, M., & Asplund, M. 2010, A&A, 512, A54
2010
-
[33]
2004, A&A, 416, 1117
Cayrel, R., Depagne, E., Spite, M., et al. 2004, A&A, 416, 1117
2004
-
[34]
2009, A&A, 505, 605
Cescutti, G., Matteucci, F., McWilliam, A., & Chiappini, C. 2009, A&A, 505, 605
2009
-
[35]
2006, A&A, 449, L27
Chiappini, C., Hirschi, R., Meynet, G., et al. 2006, A&A, 449, L27
2006
-
[36]
1997, ApJ, 477, 765
Chiappini, C., Matteucci, F., & Gratton, R. 1997, ApJ, 477, 765
1997
-
[37]
2001, ApJ, 554, 1044
Chiappini, C., Matteucci, F., & Romano, D. 2001, ApJ, 554, 1044
2001
-
[38]
2003, MNRAS, 339, 63 Co¸ skunoˇglu, B., Ak, S., Bilir, S., et al
Chiappini, C., Romano, D., & Matteucci, F. 2003, MNRAS, 339, 63 Co¸ skunoˇglu, B., Ak, S., Bilir, S., et al. 2011, MNRAS, 412, 1237
2003
-
[39]
2006, ApJ, 644, L121
Collet, R., Asplund, M., & Trampedach, R. 2006, ApJ, 644, L121
2006
-
[40]
2007, A&A, 469, 687
Collet, R., Asplund, M., & Trampedach, R. 2007, A&A, 469, 687
2007
-
[41]
2018, MN- RAS, 475, 3369
Collet, R., Nordlund, Ã., Asplund, M., Hayek, W., & Trampedach, R. 2018, MN- RAS, 475, 3369
2018
-
[42]
C., et al
Dalton, G., Trager, S., Abrams, D. C., et al. 2016, in Proc. SPIE, V ol. 9908, Ground-based and Airborne Instrumentation for Astronomy VI, 99081G de Jong, R. S., Agertz, O., Berbel, A. A., et al. 2019, The Messenger, 175, 3 Delgado Mena, E., Israelian, G., González Hernández, ...
2016 arXiv
-
[43]
2006, A&A, 458, 899
Fabbian, D., Asplund, M., Carlsson, M., & Kiselman, D. 2006, A&A, 458, 899
2006
-
[44]
Fischer, D. A. & Valenti, J. 2005, ApJ, 622, 1102 François, P., Depagne, E., Hill, V ., et al. 2007, A&A, 476, 935 Gaia Collaboration, Brown, A. G. A., Vallenari, A., et al. 2018, A&A, 616, A1
2005
-
[45]
J., Caffau, E., Bonifacio, P., et al
Gallagher, A. J., Caffau, E., Bonifacio, P., et al. 2017, A&A, 598, L10 Article number, page 19 of 20 A&A proofs: manuscript no. paper_aa
2017
-
[46]
J., Caffau, E., Bonifacio, P., et al
Gallagher, A. J., Caffau, E., Bonifacio, P., et al. 2016, A&A, 593, A48
2016
-
[47]
S., Bi, S
Ge, Z. S., Bi, S. L., Chen, Y . Q., et al. 2016, ApJ, 833, 161
2016
-
[48]
G., Sneden, C., Carretta, E., & Bragaglia, A
Gratton, R. G., Sneden, C., Carretta, E., & Bragaglia, A. 2000, A&A, 354, 169
2000
-
[49]
Gray, D. F. 2008, The Observation and Analysis of Stellar Photospheres (Cam- bridge Univ. Press, Cambridge)
2008
-
[50]
Grevesse, N., Asplund, M., & Sauval, A. J. 2007, The Solar Chemical Com- position, ed. R. von Steiger, G. Gloeckler, & G. M. Mason (Springer Sci- ence+Business Media), 105
2007
-
[51]
2008, A&A, 486, 951
Gustafsson, B., Edvardsson, B., Eriksson, K., et al. 2008, A&A, 486, 951
2008
-
[52]
J., Primas, F., Hartman, H., et al
Hansen, C. J., Primas, F., Hartman, H., et al. 2012, A&A, 545, A31
2012
-
[53]
2015, MNRAS, 453, 758
Hawkins, K., Jofré, P., Masseron, T., & Gilmore, G. 2015, MNRAS, 453, 758
2015
-
[54]
2011, A&A, 529, A158
Hayek, W., Asplund, M., Collet, R., & Nordlund, Å. 2011, A&A, 529, A158
2011
-
[55]
R., Majewski, S
Hayes, C. R., Majewski, S. R., Shetrone, M., et al. 2018, ApJ, 852, 49
2018
-
[56]
D., et al
Haywood, M., Di Matteo, P., Lehnert, M. D., et al. 2018, ApJ, 863, 113
2018
-
[57]
& Woosley, S
Heger, A. & Woosley, S. E. 2010, ApJ, 724, 341
2010
-
[58]
H., et al
Helmi, A., Babusiaux, C., Koppelman, H. H., et al. 2018, Nature, 563, 85
2018
-
[59]
S., & Bodenheimer, P
Henyey, L., Vardya, M. S., & Bodenheimer, P. 1965, ApJ, 142, 841
1965
-
[60]
2019, A&A, 626, A15
Hill, V ., Skúladóttir, Á., Tolstoy, E., et al. 2019, A&A, 626, A15
2019
-
[61]
& Müller, E
Holweger, H. & Müller, E. A. 1974, Sol. Phys., 39, 19
1974
-
[62]
Jacobson, H. R. & Frebel, A. 2015, ApJ, 808, 53
2015
-
[63]
A., Aller, K
Johnson, J. A., Aller, K. M., Howard, A. W., & Crepp, J. R. 2010, PASP, 122, 905
2010
-
[64]
V ., Mousis, O., Lunine, J
Johnson, T. V ., Mousis, O., Lunine, J. I., & Madhusudhan, N. 2012, ApJ, 757, 192 Jönsson, H., Allende Prieto, C., Holtzman, J. A., et al. 2018, AJ, 156, 126
2012
-
[65]
Karakas, A. I. & Lattanzio, J. C. 2014, PASA, 31, e030
2014
-
[66]
N., Guo, M., Zhang, A
Kirby, E. N., Guo, M., Zhang, A. J., et al. 2015, ApJ, 801, 125
2015
-
[67]
2006, ApJ, 653, 1145
Kobayashi, C., Umeda, H., Nomoto, K., Tominaga, N., & Ohkubo, T. 2006, ApJ, 653, 1145
2006
-
[68]
Kuchner, M. J. & Seager, S. 2005, ArXiv Astrophysics e-prints [astro-ph/0504214]
2005 arXiv
-
[69]
2017, AJ, 153, 75
Kunder, A., Kordopatis, G., Steinmetz, M., et al. 2017, AJ, 153, 75
2017
-
[70]
2016, A&A, 585, A70
Lardo, C., Battaglia, G., Pancino, E., et al. 2016, A&A, 585, A70
2016
-
[71]
& Carlsson, M
Leenaarts, J. & Carlsson, M. 2009, in Astronomical Society of the Pacific Con- ference Series, V ol. 415, The Second Hinode Science Meeting, ed. B. Lites, M. Cheung, T. Magara, J. Mariska, & K. Reeves, 87
2009
-
[72]
& Chieffi, A
Limongi, M. & Chieffi, A. 2018, ApJS, 237, 13
2018
-
[73]
M., Asplund, M., et al
Lind, K., Amarsi, A. M., Asplund, M., et al. 2017, MNRAS, 468, 4311
2017
-
[74]
S., & Belyaev, A
Lind, K., Asplund, M., Barklem, P. S., & Belyaev, A. K. 2011, A&A, 528, A103
2011
-
[75]
2012, MNRAS, 427, 50
Lind, K., Bergemann, M., & Asplund, M. 2012, MNRAS, 427, 50
2012
-
[76]
Maoz, D., Mannucci, F., & Brandt, T. D. 2012, MNRAS, 426, 3282 Meléndez, J. & Barbuy, B. 2009, A&A, 497, 611
2012
-
[77]
2019, ApJ, 873, 32
Molaverdikhani, K., Henning, T., & Mollière, P. 2019, ApJ, 873, 32
2019
-
[78]
2014, ApJ, 787, 81
Moriarty, J., Madhusudhan, N., & Fischer, D. 2014, ApJ, 787, 81
2014
-
[79]
& Sorahana, S
Nakajima, T. & Sorahana, S. 2016, ApJ, 830, 159
2016
-
[80]
E., Akerman, C., Asplund, M., et al
Nissen, P. E., Akerman, C., Asplund, M., et al. 2007, A&A, 469, 319
2007
-
[81]
E., Chen, Y
Nissen, P. E., Chen, Y . Q., Asplund, M., & Pettini, M. 2004, A&A, 415, 993
2004
-
[82]
E., Chen, Y
Nissen, P. E., Chen, Y . Q., Carigi, L., Schuster, W. J., & Zhao, G. 2014, A&A, 568, A25
2014
-
[83]
Nissen, P. E. & Gustafsson, B. 2018, A&A Rev., 26, 6
2018
-
[84]
E., Primas, F., Asplund, M., & Lambert, D
Nissen, P. E., Primas, F., Asplund, M., & Lambert, D. L. 2002, A&A, 390, 235
2002
-
[85]
Nissen, P. E. & Schuster, W. J. 2010, A&A, 511, L10
2010
-
[86]
Nissen, P. E. & Schuster, W. J. 2011, A&A, 530, A15
2011
-
[87]
Nissen, P. E. & Schuster, W. J. 2012, A&A, 543, A28
2012
-
[88]
E., Silva Aguirre, V ., Christensen-Dalsgaard, J., et al
Nissen, P. E., Silva Aguirre, V ., Christensen-Dalsgaard, J., et al. 2017, A&A, 608, A112
2017
-
[89]
2013, ARA&A, 51, 457
Nomoto, K., Kobayashi, C., & Tominaga, N. 2013, ARA&A, 51, 457
2013
-
[90]
M., Lind, K., et al
Nordlander, T., Amarsi, A. M., Lind, K., et al. 2017, A&A, 597, A6 Nordlund, Å. & Galsgaard, K. 1995, A 3D MHD code for Parallel Computers, Tech. rep., Niels Bohr Institute, University of Copenhagen
2017
-
[91]
Norris, J. E. & Yong, D. 2019, ApJ, 879, 37
2019
-
[92]
V ., Kaminsky, B
Pavlenko, Y . V ., Kaminsky, B. M., Jenkins, J. S., et al. 2019, A&A, 621, A112
2019
-
[93]
Perryman, M. A. C., Lindegren, L., Kovalevsky, J., et al. 1997, A&A, 323, L49
1997
-
[94]
M., Beers, T
Placco, V . M., Beers, T. C., Reggiani, H., & Meléndez, J. 2016, ApJ, 829, L24 Prša, A., Harmanec, P., Torres, G., et al. 2016, AJ, 152, 41 Ramírez, I., Allende Prieto, C., & Lambert, D. L. 2013, ApJ, 764, 78
2016
-
[95]
J., & Ventura, P
Romano, D., Matteucci, F., Zhang, Z.-Y ., Ivison, R. J., & Ventura, P. 2019, arXiv e-prints [arXiv:1907.09476]
2019
-
[96]
Rutten, R. J. 2003, Radiative Transfer in Stellar Atmospheres, 8th edn. (Utrecht University)
2003
-
[97]
1993, ApJ, 414, 580
Salaris, M., Chieffi, A., & Straniero, O. 1993, ApJ, 414, 580
1993
-
[98]
2010, A&A, 522, A26
Sbordone, L., Bonifacio, P., Caffau, E., et al. 2010, A&A, 522, A26
2010
-
[99]
J., Moreno, E., Nissen, P
Schuster, W. J., Moreno, E., Nissen, P. E., & Pichardo, B. 2012, A&A, 538, A21 Silva Aguirre, V ., Bojsen-Hansen, M., Slumstrup, D., et al. 2018, MNRAS, 475, 5487 Skúladóttir, Á., Tolstoy, E., Salvadori, S., et al. 2015, A&A, 574, A129
2012
-
[100]
2006, A&A, 455, 291 Steffen, M., Prakapaviˇcius, D., Caffau, E., et al
Spite, M., Cayrel, R., Hill, V ., et al. 2006, A&A, 455, 291 Steffen, M., Prakapaviˇcius, D., Caffau, E., et al. 2015, A&A, 583, A57 Suárez-Andrés, L., Israelian, G., González Hernández, J. I., et al. 2017, A&A, 599, A96 Suárez-Andrés, L., Israelian, G., González Hernández, J. I...
2006
-
[101]
K., Cunha, K., Smith, V
Teske, J. K., Cunha, K., Smith, V . V ., Schuler, S. C., & Griffith, C. A. 2014, ApJ, 788, 39
2014
-
[102]
2009, ARA&A, 47, 371
Tolstoy, E., Hill, V ., & Tosi, M. 2009, ARA&A, 47, 371
2009
-
[103]
2013, A&A, 557, A7 Unsöld, A
Tremblay, P.-E., Ludwig, H.-G., Freytag, B., Ste ffen, M., & Ca ffau, E. 2013, A&A, 557, A7 Unsöld, A. 1955, Physik der Sternatmospharen, MIT besonderer Berucksichti- gung der Sonne. (Springer-Verlag Berlin Heidelberg) van Leeuwen, F. 2007, A&A, 474, 653
2013
-
[104]
A., Bergbusch, P
VandenBerg, D. A., Bergbusch, P. A., Dotter, A., et al. 2012, ApJ, 755, 15
2012
-
[105]
A., Bond, H
VandenBerg, D. A., Bond, H. E., Nelan, E. P., et al. 2014, ApJ, 792, 110
2014
-
[106]
2019, arXiv e-prints [arXiv:1903.03465]
Vincenzo, F., Spitoni, E., Calura, F., et al. 2019, arXiv e-prints [arXiv:1903.03465]
2019 arXiv
-
[107]
E., Heger, A., & Weaver, T
Woosley, S. E., Heger, A., & Weaver, T. A. 2002, Reviews of Modern Physics, 74, 1015
2002
-
[108]
K., Kim, Y .-C., & Demarque, P
Yi, S. K., Kim, Y .-C., & Demarque, P. 2003, ApJS, 144, 259
2003
-
[109]
E., Bessell, M
Yong, D., Norris, J. E., Bessell, M. S., et al. 2013, ApJ, 762, 26 Article number, page 20 of 20
2013
Reviewed August 14, 2026 · model on record in the stance chip above.
Discussion (0). Continue with ORCID to comment.