REVIEW 3 major objections 6 minor 99 references
Non-parametric Morphologies of Galaxies in the EAGLE Simulation
T0 review · 3 major / 6 minor · reviewed 2026-08-14 · deepseek-v4-flash
Pith's one-line read Simulated EAGLE galaxies reproduce observed optical morphologies, except their asymmetry values are systematically too high.
desk verdict Solid validation of EAGLE optical morphologies with one honest but untested caveat: the asymmetry excess may be a mock-image smoothing artifact. read the letter →
The pith
A machine-rendered reading of the paper's core claim, the machinery that carries it, and where it could break.
The reading
What carries the argument
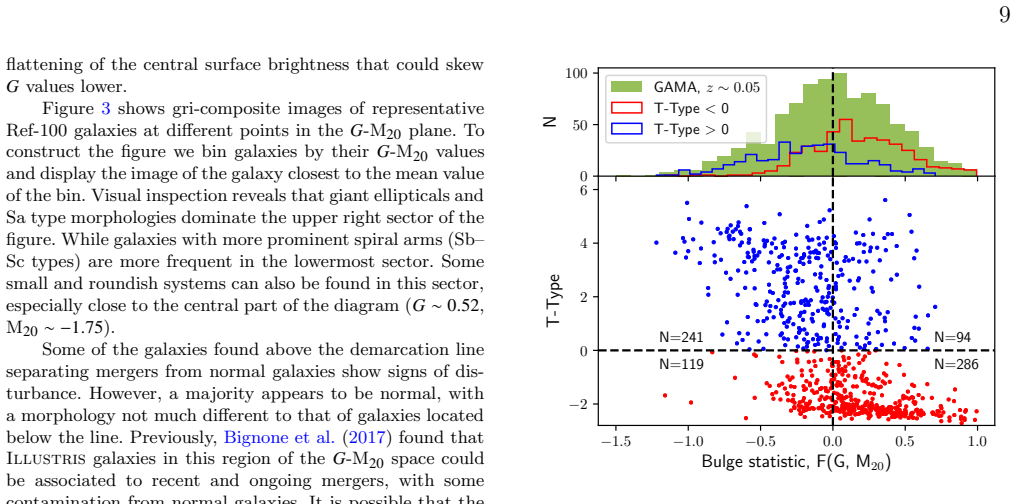
The argument runs through four non-parametric statistics computed from the light distribution of each galaxy image: Gini (how unevenly light is distributed among pixels), M20 (the logarithm of the ratio of the second-order moment of the brightest 20 per cent of light to the total second-order moment), Concentration (five times the base-10 logarithm of the ratio of radii containing 80 and 20 per cent of the light), and Asymmetry (the fractional difference between an image and its 180-degree rotation, with background asymmetry subtracted). The mock images are produced by a three-dimensional Monte Carlo radiative-transfer code that models absorption and scattering by dust, with young star-forming regions rendered as smoothed point sources, then convolved with a Gaussian point-spread function and rebinned to SDSS-like pixel scale with signal-to-noise ratio 25; the same measurement routine is applied to SDSS images of GAMA galaxies. Together with the bulge-strength statistic F, defined as five times the signed distance of a galaxy's (G, M20) point from the early/late-type separation line, these statistics carry the comparison: they translate particle data into quantities a survey would actually measure.
What would settle it
Regenerate the EAGLE mock images with a larger smoothing length for young stellar photon sources (for example, using the 128th nearest neighbours) and remeasure the Asymmetry statistic: if the high-$A$ tail disappears while $G$-$M_{20}$ and Concentration remain in agreement with GAMA, the discrepancy is an image-generation artifact; if it persists, EAGLE galaxies are intrinsically more asymmetric than observed.
Extended reading notes
Core claim
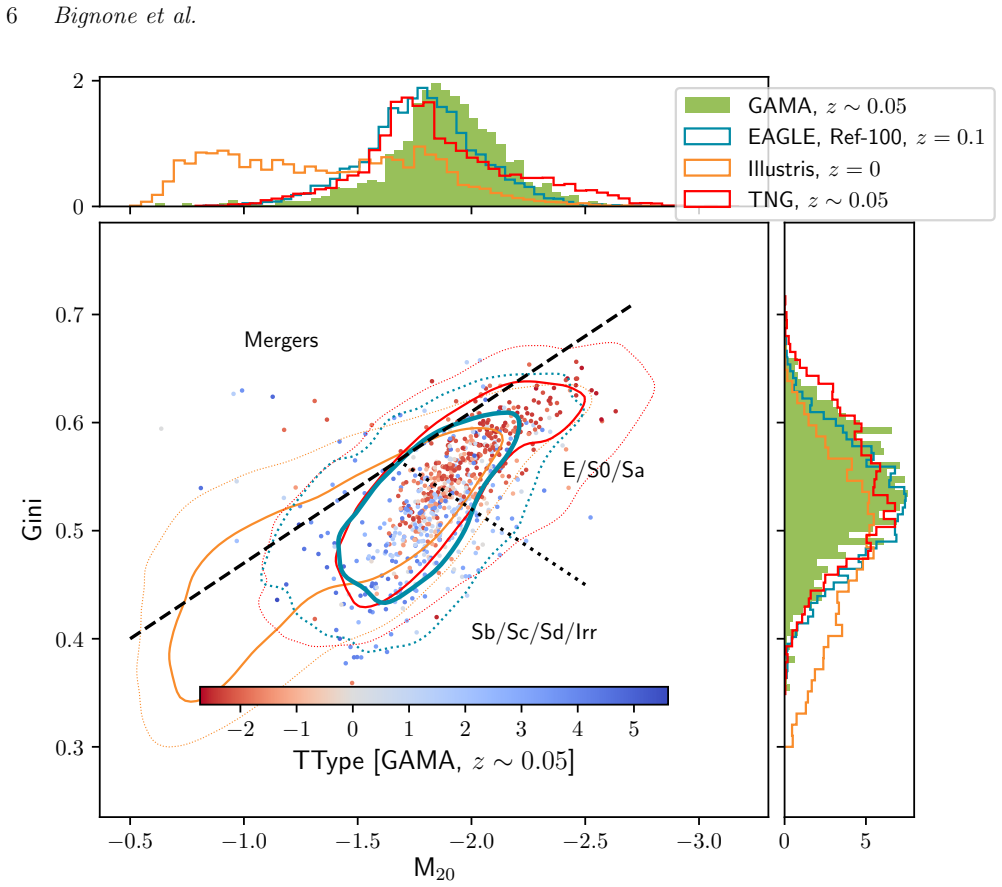
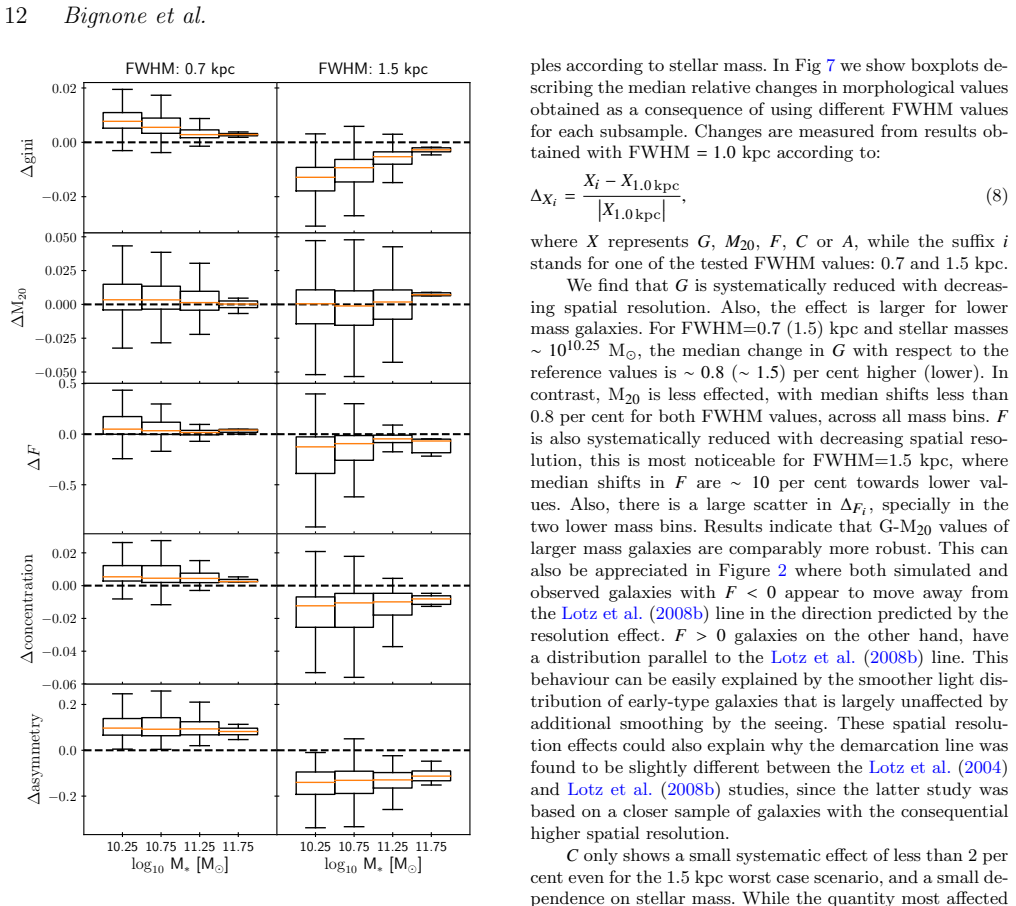
The paper's central claim is that the optical morphologies of EAGLE galaxies, once rendered as realistic g-band images, reproduce the observed morphologies of low-redshift galaxies in the GAMA survey, with one systematic exception: simulated galaxies are more asymmetric. On those terms, the Gini and M20 distributions of EAGLE galaxies at z=0.1 with stellar masses above $10^{10}$ solar masses nearly overlap those of GAMA galaxies with matched mass selection at z~0.05, and the Concentration distribution is also a close match. The Asymmetry distribution, however, develops a large tail of highly asymmetric galaxies with no observed counterpart, which the paper attributes to the point-like spatial distribution of young stellar photon sources in the mock-image generation rather than an intrinsic excess of disturbed galaxies. The paper also establishes that lowering image spatial resolution systematically reduces Gini and Asymmetry values, with the Gini of low-mass galaxies most affected, and that optical morphology correlates with kinematic morphology more strongly for central than for satellite galaxies.
Load-bearing premise
The load-bearing premise is that the mock-image pipeline faithfully represents the true light distribution of simulated galaxies, so the excess asymmetry is caused by how young star-forming regions are rendered rather than by an intrinsic overabundance of disturbed galaxies in EAGLE.
Editorial extensions
If this is right
- Because galaxy morphology was not used to calibrate EAGLE, the agreement in Gini-M20 and Concentration counts as an independent prediction of the simulation rather than a retuning of parameters.
- The asymmetry excess should be treated as a known bias when using mock EAGLE images to train or test morphological classifiers, merger identifications, or neural networks.
- Resolution corrections derived from the simulated sample could be applied to observed surveys with different seeing, though only after checking that the simulated light profiles are realistic at sub-kiloparsec scales.
- The correspondence of the kinematic threshold $\kappa_{co} = 0.4$ means kinematic morphology can serve as a proxy for optical morphology in EAGLE, even though the two criteria select different galaxy populations.
- The weaker optical-kinematic correlation in satellites indicates environmental quenching changes a galaxy's light distribution less than its internal dynamics, motivating separate evolutionary tracks for central and satellite galaxies.
Reading between the lines
- A direct test the paper implies but does not run: regenerate the mock images with a larger smoothing length for young stellar particles and check whether the asymmetry tail disappears while Gini-M20 and Concentration stay matched; if it does, the A excess is an image-rendering artifact.
- The resolution effects documented here could be converted into a practical calibration: apply the simulated mass- and FWHM-dependent shifts to observed Gini and Asymmetry measurements before comparing surveys with different seeing. The paper stops at reporting the effect.
- The excess of actively star-forming EAGLE galaxies above about $10^{11}$ solar masses, if it reflects weak feedback in the simulation, implies that morphology statistics could serve as an indirect constraint on feedback physics, an extension the paper does not make.
- The same mock-image pipeline could be extended to higher redshift or to LSST-like resolution to predict how observed morphology distributions evolve, testing whether the agreement holds beyond the z~0.05 comparison presented here.
Signed reviews
Editorial analysis
A structured set of objections, weighed in public.
Referee Report
Summary. The paper presents non-parametric optical morphologies (Gini, M20, Concentration, Asymmetry) for galaxies in the EAGLE Ref-100 simulation at z=0.1, computed from SKIRT mock images that are post-processed to approximate SDSS imaging. These are compared with morphologies measured from SDSS images of GAMA galaxies at z~0.05 with M*>10^10 M_sun, and with published morphologies for Illustris and IllustrisTNG. The authors report that the Gini-M20 distribution of EAGLE galaxies agrees well with GAMA observations, while the asymmetry statistic A is systematically larger in the simulations. They also study the effect of spatial resolution, finding that Gini and Asymmetry decrease with decreasing resolution, and examine trends between optical morphology and star formation rate, galaxy size, and kinematic morphology indicators. The paper concludes that EAGLE reproduces observed optical morphologies except for the asymmetry excess, which they tentatively attribute to the treatment of young stellar photon sources in the mock-image generation.
Significance. If the conclusions hold, this is a valuable benchmark for hydrodynamic simulations: it provides a like-for-like comparison of simulated and observed non-parametric morphologies using the same measurement code, and it demonstrates that EAGLE and IllustrisTNG produce broadly similar optical morphologies that match GAMA in G-M20 space. The paper also gives useful quantitative results on how non-parametric statistics depend on spatial resolution and viewing angle, which are relevant for future surveys such as LSST. Strengths include the use of publicly available EAGLE mock images, the consistent application of statmorph to both simulated and observed images, the explicit use of external GAMA/SDSS data as a validation target, and the inclusion of convergence and orientation tests in the appendices. The main weakness is that the central exception to the reproduction of observations, the asymmetry excess, is not conclusively separated from a plausible imaging artifact, and the paper itself flags but does not execute the decisive test.
major comments (3)
- [Sections 4.2 and 5(v)]
- [Section 5(i) and Figure 2]
- [Sections 3.3.4 and 4.2, Figure 5]
minor comments (6)
- [Section 3.3.4]
- [Section 3.3.2]
- [Section 4.2]
- [Section 4.3]
- [Section 3.1.3]
- [Section 5(v)]
Circularity Check
No load-bearing circularity: the morphology comparison is independent of EAGLE calibration, and the self-citations are methodological inputs, not definitional replacements.
full rationale
The paper's central validation target, optical morphology, was not used in calibrating EAGLE. The paper states this explicitly: "The morphologies of galaxies have not been taken into consideration on the calibration procedure and can therefore be contrasted fairly with GAMA, or other similar galaxy samples." The observational benchmark is external (GAMA/SDSS, with T-types from Dominguez Sanchez et al. 2018), and both simulated and observed images are processed with the same statmorph code. The self-citations (Trayford et al. 2017 for the mock images; Bignone et al. 2017 for an asymmetry-implementation detail) supply data and methodology, not the conclusion that EAGLE morphologies match observations. The one place where the analysis depends on a prior modeling choice, the 64th-neighbor smoothing of young stellar photon sources, is flagged by the authors as a likely cause of the A excess rather than hidden: Section 3.1.1 notes that the smoothing-length choice "can have an impact on non-parametric morphologies," and Section 5(v) proposes the mitigation experiment without claiming it was run. An unrun mitigation test is a limitation or correctness risk, not a circular reduction. No equation in the paper defines a predicted statistic in terms of a fitted parameter, and the modified A0 background procedure is applied symmetrically to simulated and observed samples, so it does not construct the simulated-versus-observed asymmetry offset. The score of 2 reflects only minor, non-load-bearing self-citations in the methods; the main comparison is externally benchmarked and independent.
Assumptions & free parameters
free parameters (5)
- Dust-to-metal ratio fdust =
0.3
- Photon source smoothing length =
64th nearest-neighbor distance
- Reference PSF FWHM =
1.0 kpc
- Signal-to-noise ratio per pixel =
25
- Galaxy aperture radius =
30 pkpc
assumptions (5)
- domain assumption EAGLE subgrid parameters were calibrated only to the z~0 GSMF and size-mass relation, not to galaxy morphology, so the morphology comparison is a genuine prediction.
- domain assumption The SKIRT mock-image pipeline, including dust, PSF convolution, rebinning, and noise, produces images equivalent to SDSS for morphology measurements.
- domain assumption GAMA photometric stellar masses (Taylor et al. 2011) rescaled to the EAGLE cosmology are accurate enough that the 10^10 Msun mass thresholds define comparable samples.
- domain assumption T-Type classifications from the CNN of Dominguez Sanchez et al. (2018) are reliable labels for testing the G-M20 separation.
- domain assumption The Lotz et al. (2008b) demarcation lines in G-M20 and C-A space, derived from observed galaxies at 0.2<z<1.2, apply to z~0.05 GAMA and z=0.1 simulated galaxies.
Cite this review
Pith. "Pith review of Non-parametric Morphologies of Galaxies in the EAGLE Simulation." pith.science (2026). https://pith.science/paper/BXGL3SJL
@misc{pith2026190810936,
  author       = {Pith},
  title        = {Pith review of: Non-parametric Morphologies of Galaxies in the EAGLE Simulation},
  year         = {2026},
  howpublished = {\url{https://pith.science/paper/BXGL3SJL}},
  note         = {Machine review of arXiv:1908.10936}
}
abstract
We study the optical morphology of galaxies in a large-scale hydrodynamic cosmological simulation, the EAGLE simulation. Galaxy morphologies were characterized using non-parametric statistics (Gini, $M_{20}$, Concentration and Asymmetry) derived from mock images computed using a 3D radiative transfer technique and post-processed to approximate observational surveys. The resulting morphologies were contrasted to observational results from a sample of $\log_{10}(M_{*}/M_\odot) > 10$ galaxies at $z \sim 0.05$ in the GAMA survey. We find that the morphologies of EAGLE galaxies reproduce observations, except for asymmetry values which are larger in the simulated galaxies. Additionally, we study the effect of spatial resolution in the computation of non-parametric morphologies, finding that Gini and Asymmetry values are systematically reduced with decreasing spatial resolution. Gini values for lower mass galaxies are especially affected. Comparing against other large scale simulations, the non-parametric statistics of EAGLE galaxies largely agree with those found in IllustrisTNG. Additionally, EAGLE galaxies mostly reproduce observed trends between morphology and star formation rate and galaxy size. Finally, We also find a significant correlation between optical and kinematic estimators of morphologies, although galaxy classification based on an optical or a kinematic criteria results in different galaxy subsets. The correlation between optical and kinematic morphologies is stronger in central galaxies than in satellites, indicating differences in morphological evolution.
Figures


Figures from the paper (9 more)




Reference graph
Works this paper leans on
-
[1]
Baes M., Verstappen J., De Looze I., Fritz J., Saftly W., Vidal P \'e rez E., Stalevski M., Valcke S., 2011, @doi [ApJS] 10.1088/0067-0049/196/2/22 , 196, 22
-
[2]
K., Glazebrook K., Brinkmann J., Ivezi \'c Z ., Lupton R
Baldry I. K., Glazebrook K., Brinkmann J., Ivezi \'c Z ., Lupton R. H., Nichol R. C., Szalay A. S., 2004, @doi [ApJ] 10.1086/380092 , 600, 681
doi:10.1086/380092 2004
-
[4]
E., et al., 2013, @doi [MNRAS] 10.1093/mnras/stt1011 , 434, 209
Bauer A. E., et al., 2013, @doi [MNRAS] 10.1093/mnras/stt1011 , 434, 209
-
[5]
F., et al., 2012, @doi [ApJ] 10.1088/0004-637X/753/2/167 , 753, 167
Bell E. F., et al., 2012, @doi [ApJ] 10.1088/0004-637X/753/2/167 , 753, 167
-
[6]
Data Anal
Bertin E., Mellier Y., Radovich M., Missonnier G., Didelon P., Morin B., 2002, Astron. Data Anal. Softw. Syst. XI, 281, 228
2002
-
[7]
Bignone L. A., Tissera P. B., Sillero E., Pedrosa S. E., Pellizza L. J., Lambas D. G., 2017, @doi [MNRAS] 10.1093/mnras/stw2788 , 465, 1106
-
[8]
R., Moustakas J., 2009, @doi [ARA&A] 10.1146/annurev-astro-082708-101734 , 47, 159
Blanton M. R., Moustakas J., 2009, @doi [ARA&A] 10.1146/annurev-astro-082708-101734 , 47, 159
-
[9]
L., 2017, @doi [MNRAS] 10.1093/mnras/stx017 , 467, 1033
Bottrell C., Torrey P., Simard L., Ellison S. L., 2017, @doi [MNRAS] 10.1093/mnras/stx017 , 467, 1033
Show all 99 references
-
[10]
Bourne N., et al., 2013, @doi [MNRAS] 10.1093/mnras/stt1584 , 436, 479
2013 doi
-
[11]
G., Schaye J., Frenk C
Bower R. G., Schaye J., Frenk C. S., Theuns T., Schaller M., Crain R. A., McAlpine S., 2017, @doi [MNRAS] 10.1093/mnras/stw2735 , 465, 32
2017 doi
-
[13]
Camps P., Baes M., 2015, @doi [A&C] 10.1016/j.ascom.2014.10.004 , 9, 20
2015 doi
-
[14]
W., Baes M., Theuns T., Schaller M., Schaye J., 2016, @doi [MNRAS] 10.1093/mnras/stw1735 , 462, 1057
Camps P., Trayford J. W., Baes M., Theuns T., Schaller M., Schaye J., 2016, @doi [MNRAS] 10.1093/mnras/stw1735 , 462, 1057
2016 doi
-
[16]
Chabrier G., 2003, @doi [PASP] 10.1086/376392; , 115, 763
2003 doi
-
[17]
G., 2018, @doi [MNRAS] 10.1093/mnras/sty1229 , 478, 3994
Clauwens B., Schaye J., Franx M., Bower R. G., 2018, @doi [MNRAS] 10.1093/mnras/sty1229 , 478, 3994
2018 doi
-
[18]
S., et al., 2009, ArXiv E-Prints, p
Collaboration L. S., et al., 2009, ArXiv E-Prints, p. arXiv:0912.0201
2009 arXiv
-
[19]
E., White M., 2009, @doi [ApJ] 10.1088/0004-637X/699/1/486 , 699, 486
Conroy C., Gunn J. E., White M., 2009, @doi [ApJ] 10.1088/0004-637X/699/1/486 , 699, 486
2009 doi
-
[20]
J., 2003, @doi [ApJS] 10.1086/375001 , 147, 1
Conselice C. J., 2003, @doi [ApJS] 10.1086/375001 , 147, 1
2003 doi
-
[21]
J., 2014, @doi [ARA&A] 10.1146/annurev-astro-081913-040037 , 52, 291
Conselice C. J., 2014, @doi [ARA&A] 10.1146/annurev-astro-081913-040037 , 52, 291
2014 doi
-
[22]
J., Bershady M
Conselice C. J., Bershady M. A., Jangren A., 2000, @doi [ApJ] 10.1086/308300 , 529, 886
2000 doi
-
[23]
A., Schaye J., Clauwens B., Bower R
Correa C. A., Schaye J., Clauwens B., Bower R. G., Crain R. A., Schaller M., Theuns T., Thob A. C. R., 2017, @doi [MNRAS] 10.1093/mnrasl/slx133 , 472, L45
2017 doi
-
[24]
A., Schaye J., Trayford J
Correa C. A., Schaye J., Trayford J. W., 2019, @doi [MNRAS] 10.1093/mnras/stz295 , 484, 4401
2019 doi
-
[25]
Cortese L., et al., 2016, @doi [MNRAS] 10.1093/mnras/stw1891 , 463, 170
2016 doi
-
[26]
Cortese L., et al., 2019, @doi [MNRAS] 10.1093/mnras/stz485 , 485, 2656
2019 doi
-
[27]
A., et al., 2015, @doi [MNRAS] 10.1093/mnras/stv725 , 450, 1937
Crain R. A., et al., 2015, @doi [MNRAS] 10.1093/mnras/stv725 , 450, 1937
2015 doi
-
[28]
Dalla Vecchia C., Schaye J., 2012, @doi [MNRAS] 10.1111/j.1365-2966.2012.21704.x , 426, 140
2012
-
[29]
S., White S
Davis M., Efstathiou G., Frenk C. S., White S. D. M., 1985, @doi [ApJ] 10.1086/163168 , 292, 371
1985 doi
-
[30]
Dickinson H., et al., 2018, @doi [ApJ] 10.3847/1538-4357/aaa250 , 853, 194
2018 doi
-
[31]
Doi M., et al., 2010, @doi [AJ] 10.1088/0004-6256/139/4/1628 , 139, 1628
2010 doi
-
[32]
L., 2018, @doi [MNRAS] 10.1093/mnras/sty338
Dom \'i nguez S \'a nchez H., Huertas-Company M., Bernardi M., Tuccillo D., Fischer J. L., 2018, @doi [MNRAS] 10.1093/mnras/sty338
2018 doi
-
[33]
Dressler A., 1984, @doi [ARA&A] 10.1146/annurev.astro.22.1.185 , 22, 185
1984 doi
-
[34]
P., et al., 2009, @doi [A&G] 10.1111/j.1468-4004.2009.50512.x , 50, 5.12
Driver S. P., et al., 2009, @doi [A&G] 10.1111/j.1468-4004.2009.50512.x , 50, 5.12
2009
-
[38]
E., Izbicki R., Lee A
Freeman P. E., Izbicki R., Lee A. B., Newman J. A., Conselice C. J., Koekemoer A. M., Lotz J. M., Mozena M., 2013, @doi [MNRAS] 10.1093/mnras/stt1016 , 434, 282
2013 doi
-
[39]
Furlong M., et al., 2015, @doi [MNRAS] 10.1093/mnras/stv852 , 450, 4486
2015 doi
-
[40]
Furlong M., et al., 2017, @doi [MNRAS] 10.1093/mnras/stw2740 , 465, 722
2017 doi
-
[41]
Genel S., et al., 2017, preprint, 1707, arXiv:1707.05327
2017 arXiv
-
[43]
L., et al., 2003, @doi [ApJ] 10.1086/345593 , 584, 210
G \'o mez P. L., et al., 2003, @doi [ApJ] 10.1086/345593 , 584, 210
2003 doi
-
[44]
A., Sutherland R
Groves B., Dopita M. A., Sutherland R. S., Kewley L. J., Fischera J., Leitherer C., Brandl B., van Breugel W., 2008, @doi [ApJS] 10.1086/528711 , 176, 438
2008 doi
-
[45]
Gunawardhana M. L. P., et al., 2013, @doi [MNRAS] 10.1093/mnras/stt890 , 433, 2764
2013 doi
- [46]
-
[47]
Ilbert O., et al., 2010, @doi [ApJ] 10.1088/0004-637X/709/2/644 , 709, 644
2010 doi
-
[48]
Jonsson P., 2006, @doi [MNRAS] 10.1111/j.1365-2966.2006.10884.x , 372, 2
2006
-
[49]
Kauffmann G., et al., 2003, @doi [MNRAS] 10.1046/j.1365-8711.2003.06292.x , 341, 54
2003
-
[50]
Kauffmann G., White S. D. M., Heckman T. M., M \'e nard B., Brinchmann J., Charlot S., Tremonti C., Brinkmann J., 2004, @doi [MNRAS] 10.1111/j.1365-2966.2004.08117.x , 353, 713
2004
-
[51]
E., 2010, @doi [ApJ] 10.1088/0004-637X/723/1/54 , 723, 54
Kormendy J., Drory N., Bender R., Cornell M. E., 2010, @doi [ApJ] 10.1088/0004-637X/723/1/54 , 723, 54
2010 doi
-
[53]
Lagos C. d. P., Schaye J., Bah \'e Y., Van de Sande J., Kay S. T., Barnes D., Davis T. A., Dalla Vecchia C., 2018, @doi [MNRAS] 10.1093/mnras/sty489 , 476, 4327
2018 doi
-
[54]
M., Primack J., Madau P., 2004, @doi [AJ] 10.1086/421849 , 128, 163
Lotz J. M., Primack J., Madau P., 2004, @doi [AJ] 10.1086/421849 , 128, 163
2004 doi
-
[56]
M., et al., 2008b, @doi [ApJ] 10.1086/523659 , 672, 177
Lotz J. M., et al., 2008b, @doi [ApJ] 10.1086/523659 , 672, 177
-
[57]
R., Fekete G., Hogg D
Lupton R., Blanton M. R., Fekete G., Hogg D. W., O'Mullane W., Szalay A., Wherry N., 2004, @doi [PASP] 10.1086/382245 , 116, 133
2004 doi
-
[58]
Marinacci F., et al., 2018, @doi [MNRAS] 10.1093/mnras/sty2206 , 480, 5113
2018 doi
-
[59]
McAlpine S., et al., 2016, @doi [A&C] 10.1016/j.ascom.2016.02.004 , 15, 72
2016 doi
-
[60]
P., et al., 2018, @doi [MNRAS] 10.1093/mnras/sty618 , 477, 1206
Naiman J. P., et al., 2018, @doi [MNRAS] 10.1093/mnras/sty618 , 477, 1206
2018 doi
-
[61]
Nelson D., et al., 2015, @doi [Astronomy and Computing] 10.1016/j.ascom.2015.09.003 , 13, 12
2015 doi
-
[62]
Nelson D., et al., 2018, @doi [MNRAS] 10.1093/mnras/stx3040 , 475, 624
2018 doi
-
[63]
Astrophys
Nelson D., et al., 2019, @doi [Comput. Astrophys. Cosmol.] 10.1186/s40668-019-0028-x , 6, 2
2019 doi
-
[64]
Obreschkow D., Glazebrook K., 2014, @doi [ApJ] 10.1088/0004-637X/784/1/26 , 784, 26
2014 doi
-
[65]
Omand C. M. B., Balogh M. L., Poggianti B. M., 2014, @doi [MNRAS] 10.1093/mnras/stu331 , 440, 843
2014 doi
-
[66]
M., Wild V., Walcher C
Pawlik M. M., Wild V., Walcher C. J., Johansson P. H., Villforth C., Rowlands K., Mendez-Abreu J., Hewlett T., 2016, @doi [MNRAS] 10.1093/mnras/stv2878 , 456, 3032
2016 doi
-
[67]
J., Wang L., Trayford J
Pearson W. J., Wang L., Trayford J. W., Petrillo C. E., van der Tak F. F. S., 2019, @doi [Astron. Astrophys.] 10.1051/0004-6361/201935355 , 626, A49
2019 doi
-
[68]
Pillepich A., et al., 2018a, @doi [MNRAS] 10.1093/mnras/stx2656 , 473, 4077
-
[69]
Pillepich A., et al., 2018b, @doi [MNRAS] 10.1093/mnras/stx3112 , 475, 648
-
[70]
Planck Collaboration et al., 2014, @doi [A&A] 10.1051/0004-6361/201321591 , 571, A16
2014 doi
-
[71]
P., 2011, @doi [A&A] 10.1051/0004-6361/201117150 , 536, A79
Robitaille T. P., 2011, @doi [A&A] 10.1051/0004-6361/201117150 , 536, A79
2011 doi
-
[72]
Robotham A., et al., 2010, @doi [PASA] 10.1071/AS09053 , 27, 76
2010 doi
-
[73]
Rodriguez-Gomez V., et al., 2019, @doi [MNRAS] 10.1093/mnras/sty3345 , 483, 4140
2019 doi
-
[74]
J., Fall S
Romanowsky A. J., Fall S. M., 2012, @doi [ApJS] 10.1088/0067-0049/203/2/17 , 203, 17
2012 doi
-
[75]
M., et al., 2015, @doi [MNRAS] 10.1093/mnras/stv2056 , 454, 1038
Rosas-Guevara Y. M., et al., 2015, @doi [MNRAS] 10.1093/mnras/stv2056 , 454, 1038
2015 doi
-
[76]
S., Tissera P
Rosito M. S., Tissera P. B., Pedrosa S. E., Rosas-Guevara Y., 2018a, ArXiv E-Prints, p. arXiv:1811.11062
-
[77]
S., Pedrosa S
Rosito M. S., Pedrosa S. E., Tissera P. B., Avila-Reese V., Lacerna I., Bignone L. A., Ibarra-Medel H. J., Varela S., 2018b, @doi [A&A] 10.1051/0004-6361/201732302 , 614, A85
-
[78]
V., Navarro J
Sales L. V., Navarro J. F., Schaye J., Dalla Vecchia C., Springel V., Booth C. M., 2010, @doi [MNRAS] 10.1111/j.1365-2966.2010.17391.x , 409, 1541
2010
-
[80]
A., Jonsson P., White S
Scannapieco C., Gadotti D. A., Jonsson P., White S. D. M., 2010, @doi [MNRAS] 10.1111/j.1745-3933.2010.00900.x , 407
2010
-
[81]
Schaye J., 2004, @doi [ApJ] 10.1086/421232 , 609, 667
2004 doi
-
[82]
Schaye J., Dalla Vecchia C., 2008, @doi [MNRAS] 10.1111/j.1365-2966.2007.12639.x , 383, 1210
2008
-
[83]
Schaye J., et al., 2015, @doi [MNRAS] 10.1093/mnras/stu2058 , 446, 521
2015 doi
-
[84]
F., Lotz J., Moody C., Peth M., Freeman P., Ceverino D., Primack J., Dekel A., 2015a, @doi [MNRAS] 10.1093/mnras/stv1231 , 451, 4290
Snyder G. F., Lotz J., Moody C., Peth M., Freeman P., Ceverino D., Primack J., Dekel A., 2015a, @doi [MNRAS] 10.1093/mnras/stv1231 , 451, 4290
-
[85]
F., et al., 2015b, @doi [MNRAS] 10.1093/mnras/stv2078 , 454, 1886
Snyder G. F., et al., 2015b, @doi [MNRAS] 10.1093/mnras/stv2078 , 454, 1886
-
[86]
Springel V., 2005, MNRAS, 364, 1105
2005
-
[87]
Springel V., White S. D. M., Tormen G., Kauffmann G., 2001, @doi [MNRAS] 10.1046/j.1365-8711.2001.04912.x , 328, 726
2001
-
[88]
Springel V., et al., 2018, @doi [MNRAS] 10.1093/mnras/stx3304 , 475, 676
2018 doi
-
[89]
D., 2013, @doi [ARA&A] 10.1146/annurev-astro-082812-141042 , 51, 63
Steinacker J., Baes M., Gordon K. D., 2013, @doi [ARA&A] 10.1146/annurev-astro-082812-141042 , 51, 63
2013 doi
-
[90]
N., et al., 2011, @doi [MNRAS] 10.1111/j.1365-2966.2011.19536.x , 418, 1587
Taylor E. N., et al., 2011, @doi [MNRAS] 10.1111/j.1365-2966.2011.19536.x , 418, 1587
2011
-
[91]
Thob A. C. R., et al., 2019, @doi [MNRAS] 10.1093/mnras/stz448 , 485, 972
2019 doi
-
[92]
B., Rosas-Guevara Y., Bower R
Tissera P. B., Rosas-Guevara Y., Bower R. G., Crain R. A., del P Lagos C., Schaller M., Schaye J., Theuns T., 2019, @doi [MNRAS] 10.1093/mnras/sty2817 , 482, 2208
2019 doi
-
[93]
Torrey P., Vogelsberger M., Genel S., Sijacki D., Springel V., Hernquist L., 2014, @doi [MNRAS] 10.1093/mnras/stt2295 , 438, 1985
2014 doi
-
[94]
Torrey P., et al., 2015, @doi [MNRAS] 10.1093/mnras/stu2592 , 447, 2753
2015 doi
-
[95]
W., et al., 2015, @doi [MNRAS] 10.1093/mnras/stv1461 , 452, 2879
Trayford J. W., et al., 2015, @doi [MNRAS] 10.1093/mnras/stv1461 , 452, 2879
2015 doi
-
[96]
W., Theuns T., Bower R
Trayford J. W., Theuns T., Bower R. G., Crain R. A., Lagos C. d. P., Schaller M., Schaye J., 2016, @doi [MNRAS] 10.1093/mnras/stw1230 , 460, 3925
2016 doi
-
[97]
W., et al., 2017, @doi [MNRAS] 10.1093/mnras/stx1051 , 470, 771
Trayford J. W., et al., 2017, @doi [MNRAS] 10.1093/mnras/stx1051 , 470, 771
2017 doi
-
[98]
W., Frenk C
Trayford J. W., Frenk C. S., Theuns T., Schaye J., Correa C., 2019, @doi [MNRAS] 10.1093/mnras/sty2860 , 483, 744
2019 doi
-
[99]
Vogelsberger M., Genel S., Sijacki D., Torrey P., Springel V., Hernquist L., 2013, @doi [MNRAS] 10.1093/mnras/stt1789 , 436, 3031
2013 doi
-
[100]
Vogelsberger M., et al., 2014, @doi [Nature] 10.1038/nature13316 , 509, 177
2014 doi
-
[101]
Weinberger R., et al., 2017, @doi [MNRAS] 10.1093/mnras/stw2944 , 465, 3291
2017 doi
-
[102]
E., van Dokkum P
Whitaker K. E., van Dokkum P. G., Brammer G., Franx M., 2012, @doi [ApJ] 10.1088/2041-8205/754/2/L29 , 754, L29
2012 doi
-
[103]
A., 2011, Bull
Whitney B. A., 2011, Bull. Astron. Soc. India, 39, 101
2011
-
[104]
Wiersma R. P. C., Schaye J., Smith B. D., 2009a, @doi [MNRAS] 10.1111/j.1365-2966.2008.14191.x , 393, 99
2008
-
[105]
Wiersma R. P. C., Schaye J., Theuns T., Dalla Vecchia C., Tornatore L., 2009b, @doi [MNRAS] 10.1111/j.1365-2966.2009.15331.x , 399
2009
-
[106]
Wuyts S., et al., 2011, @doi [ApJ] 10.1088/0004-637X/742/2/96 , 742, 96
2011 doi
-
[107]
G., 2004, @doi [ApJS] 10.1086/382351 , 152, 211
Zubko V., Dwek E., Arendt R. G., 2004, @doi [ApJS] 10.1086/382351 , 152, 211
2004 doi
-
[108]
de Vaucouleurs G., 1963, @doi [ApJS] 10.1086/190084 , 8, 31
1963 doi
-
[109]
write newline
" write newline "" before.all 'output.state := FUNCTION fin.entry write newline FUNCTION new.block output.state before.all = 'skip after.block 'output.state := if FUNCTION new.sentence output.state after.block = 'skip output.state before.all = 'skip after.sentence 'output.stat...
Reviewed August 14, 2026 · model on record in the stance chip above.
Discussion (0). Continue with ORCID to comment.