REVIEW 3 major objections 5 minor 1 cited by
Variability of the near-infrared extinction curve towards the Galactic centre
T0 review · 3 major / 5 minor · reviewed 2026-08-14 · deepseek-v4-flash
Pith's one-line read The near-infrared extinction curve toward the Galactic centre is not a single power law: the extinction index is 2.43 ± 0.03 for J–H but 2.23 ± 0.03 for H–Ks, Δα = 0.19 ± 0.05, with no line-of-sight or extinction variation.
desk verdict Plausible Δα, but the 4σ significance rests on an unquantified assumption about the red clump's intrinsic color–magnitude slope. read the letter →
The pith
A machine-rendered reading of the paper's core claim, the machinery that carries it, and where it could break.
The reading
What carries the argument
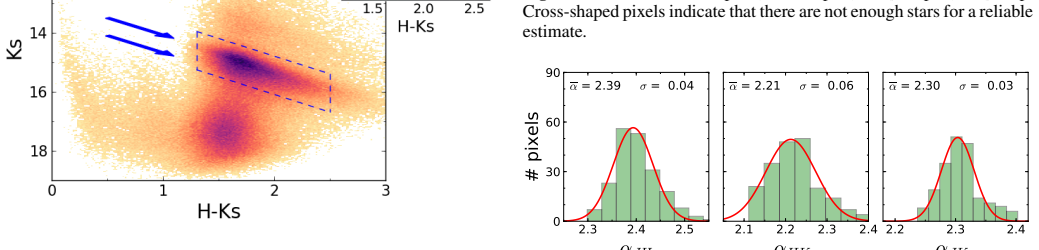
The argument runs on the extinction-index definition $A_\lambda \propto \lambda^{-\alpha}$ and on red clump stars as a standard stellar population whose spread along the reddening vector traces differential extinction. Two independent estimators are combined. The grid method reddens synthetic red clump magnitudes, built from atmosphere models with adopted effective temperature, surface gravity, radius, metallicity and a Galactic-centre distance of $8.0 \pm 0.1$ kpc, over a fine grid of extinction $A_{1.61}$ and index $\alpha$, and minimises the corresponding $\chi^2$. The slope method instead measures the slope $m$ of the red clump feature in colour–magnitude diagrams and converts it to an extinction index through the identity $\alpha = -\log(1 + 1/m) / \log(\lambda_{\mathrm{eff},1}/\lambda_{\mathrm{eff},2})$, with $\lambda_{\mathrm{eff}}$ the effective wavelengths of the filters. The near-agreement of the two methods' $\Delta\alpha$, despite their different systematic sensitivities, is what lets the paper quote $\Delta\alpha = 0.19 \pm 0.05$ as its best estimate.
What would settle it
Observe the red clump feature in $K_s$ versus $H-K_s$ in a low-extinction field where differential extinction is negligible: a nonzero slope there would prove an intrinsic colour–magnitude correlation and break the slope method's premise. A complementary check is to compare spectroscopically measured extinctions of individual red clump stars with the values predicted by $\alpha_{JH} = 2.43$ and $\alpha_{HK_s} = 2.23$; a systematic offset that grows with colour would falsify the band-dependent indices.
Extended reading notes
Core claim
The central claim is that the NIR extinction index toward the Galactic centre depends on wavelength: $\alpha_{JH} = 2.43 \pm 0.03$ and $\alpha_{HK_s} = 2.23 \pm 0.03$, giving $\Delta\alpha = 0.19 \pm 0.05$ when the two methods are combined. The slope of the bright red clump feature alone yields $\Delta\alpha = 0.19 \pm 0.05$, a detection at roughly $4\sigma$ significance, and the fully independent grid method returns $\Delta\alpha = 0.22 \pm 0.13$; the authors take the agreement between these two systematically different estimators as the evidence for a real wavelength dependence. They also find the index constant, within uncertainties, across the studied region of the nuclear stellar disc and along the reddening vector, so the wavelength dependence is not a line-of-sight artefact. The paper further argues that this dependence reconciles the wide spread of $\alpha$ values in the literature (roughly 1.5 to 2.5), because a single-index fit over $JHK_s$ measures an average, here $\alpha_{JHK_s} = 2.32 \pm 0.09$, which sits between the two band-specific indices.
Load-bearing premise
The headline value $\Delta\alpha = 0.19 \pm 0.05$ rests on the slope method's premise that the slope of the red clump feature in the colour–magnitude diagram is caused entirely by differential extinction, with no intrinsic colour–magnitude correlation among red clump stars and with correctly adopted effective wavelengths; if either assumption fails, both $\alpha_{JH}$ and $\alpha_{HK_s}$ shift and $\Delta\alpha$ changes.
Editorial extensions
If this is right
- A single-index extinction correction toward the Galactic centre is systematically biased: fitting one power law across JHKs returns an average index (2.32 ± 0.09 in this paper) that lies between the true J–H and H–Ks indices.
- Distance moduli to the nuclear disc derived from NIR photometry can be biased by up to about 1 kpc if the wavelength dependence is ignored, since a 10–15% change in the extinction index shifts the absolute extinction by roughly 0.3 mag.
- Stellar classifications that use dereddened NIR colours can change type when a band-dependent extinction law is applied instead of a single index.
- Within the studied region of the nuclear stellar disc, a single constant extinction law can safely be adopted for structural studies, as long as the band pair used is specified.
- Published extinction indices toward the Galactic centre spanning roughly 1.5 to 2.5 need not contradict one another; they may reflect different effective band pairs convolved with a wavelength-dependent law.
Reading between the lines
- If the wavelength dependence is a property of the dust rather than of this particular sightline, a similar Δα between adjacent NIR bands should show up toward other heavily extincted inner-Galaxy fields, which could be checked by applying the slope method to existing catalogues.
- A natural physical cause would be a change in the dust grain population; comparing Δα across sightlines with different extinction curves would turn the effect into a probe of grain size or composition that needs no absolute photometric calibration.
- Because the slope method's output depends on the assumed effective wavelengths, calibrating intrinsic red clump colours spectroscopically in a low-extinction field would directly test the premise that the observed red clump slope is purely extinction-driven and could sharpen Δα below the current 0.05.
Signed reviews
Editorial analysis
A structured set of objections, weighed in public.
Referee Report
Summary. The paper uses the GALACTICNUCLEUS JHK_s survey of 14 fields covering ~90 pc x 20 pc around Sgr A* to study the near-infrared extinction index alpha toward the Galactic centre. Two red-clump-based methods are applied: a 'grid method' that reddens synthetic stellar atmosphere models over a grid of extinction and alpha, and a 'slope method' that measures the slope of the red-clump feature in colour-magnitude diagrams and converts it to alpha via Eq. (1). The authors report no significant line-of-sight or extinction dependence of alpha within the nuclear stellar disc, but a wavelength dependence Delta_alpha = alpha_JH - alpha_HKs = 0.19 +/- 0.05, with mean values alpha_JH = 2.43 +/- 0.03 and alpha_HKs = 2.23 +/- 0.03. They interpret the result as evidence that the NIR extinction curve towards the Galactic centre is not a single power law, and suggest this explains discrepancies in previously published alpha values.
Significance. If the result is robust, it is an important step for Galactic-centre studies: a wavelength-dependent NIR extinction index affects distance estimates and stellar classifications based on NIR photometry, and it offers a natural explanation for the spread of alpha values in the literature. The two methods agree on the sign and rough magnitude of Delta_alpha, and the high angular resolution of the GALACTICNUCLEUS survey is a genuine strength. However, the headline significance rests heavily on the slope method (Section 4.4), whose central assumption is not quantified, and the effective wavelengths enter the conversion without a propagated uncertainty. The paper is concise and readable, but the current form does not fully secure the central claim.
major comments (3)
- [Section 4.4, Eq. (1)] The slope method interprets the observed slope m of the red-clump feature as entirely due to differential extinction, i.e. it assumes a zero intrinsic colour-magnitude correlation for red-clump stars. The paper's best estimate, Delta_alpha = 0.19 +/- 0.05, is carried by this assumption, since the grid method alone yields only Delta_alpha = 0.22 +/- 0.13, a ~1.7 sigma signal. The manuscript's only caveat (Section 5) concerns completeness at the faint end and does not bound the intrinsic slope. A nonzero intrinsic slope, possibly different between the (J-H, H) and (H-Ks, Ks) planes, could shift alpha_JH and alpha_HKs in opposite directions and mimic a wavelength dependence even for a single true extinction index. Please quantify the intrinsic RC slope using synthetic populations or external estimates, or present the grid method as the primary result with the slope method as supporting evidence.
- [Section 4.4, Eq. (1)] The conversion from the measured slope to alpha uses adopted effective wavelengths lambda_eff, which enter logarithmically in the denominator of Eq. (1). The paper does not propagate uncertainties in lambda_eff or in the filter transmission curves into the quoted uncertainties on alpha_JH, alpha_HKs, or Delta_alpha. A systematic error in the ratio lambda_J/lambda_H relative to lambda_H/lambda_Ks would produce exactly the reported wavelength dependence. Please provide a quantitative estimate of this systematic term, or state explicitly why it is negligible compared with the quoted 0.05 uncertainty on Delta_alpha.
- [Sections 4.1-4.2 and Table 1] The grid method's systematic uncertainties are computed by varying parameters 'independently in their uncertainty ranges', but the adopted red-clump template parameters (Kurucz 1993 models, T_eff = 4750 K, log g = +2.5, R = 10 R_sun, twice-solar metallicity) are fixed inputs. The sensitivity of the derived Delta_alpha to the template choice, especially metallicity and effective temperature, is not shown. Since both methods use the same red-clump selection from the same survey data, their agreement is not a fully independent confirmation; please add a table or figure showing how Delta_alpha changes over the physically allowed parameter ranges.
minor comments (5)
- [Section 3] The text refers to 'blue dashed trapezoids' while Section 4.1 and the caption of Fig. 2 use 'blue dashed parallelograms'; please unify the terminology.
- [Section 4.4, Eq. (1)] Please state the sign convention for the slope m (e.g., m = d lambda_eff2 / d(lambda_eff1 - lambda_eff2)) and whether positive slopes correspond to features aligned with the reddening vector, so that readers can reproduce the calculation without consulting Nogueras-Lara et al. (2018b).
- [Table 3] Table 3 reports statistical and systematic uncertainties separately, but the combined values quoted in the text (alpha_HKs = 2.29 +/- 0.02, alpha_JH = 2.52 +/- 0.09, Delta_alpha = 0.23 +/- 0.09, and Delta_alpha = 0.19 +/- 0.05) do not state how the two components were combined; please make the propagation explicit.
- [Abstract and body] The abstract contains a 'Conclusions' heading with no following text, and the body has no separate conclusions section; either add a brief summary or remove the empty heading.
- [References] The references to 'Nogueras-Lara et al., submitted' should be updated to published or arXiv identifiers, and the two distinct submitted papers should be clearly distinguished.
Circularity Check
No significant circularity: the extinction-index measurements are direct inversions of photometric data, not fitted inputs renamed as predictions.
full rationale
The paper derives the NIR extinction indices from two independent methods rather than from a parameter fitted to the claimed conclusion. In the grid method (Sect. 4.1) the authors redden Kurucz synthetic stellar models over a grid of extinction and alpha values and minimize chi^2, so alpha is an output of an external stellar-atmosphere model and photometric data. In the slope method (Sect. 4.4) the observed slope m of the red-clump feature is converted to alpha via Eq. (1), alpha = -log(1 + 1/m) / log(lambda_eff1/lambda_eff2); this is a direct algebraic inversion of the assumed power-law extinction curve, not a fit that has been relabeled as a prediction. The two methods use the same survey data but different observables, and their agreement (Delta_alpha = 0.22 +/- 0.13 versus 0.19 +/- 0.05) is presented as a consistency check, not as a construction of the result. Self-citations to Nogueras-Lara et al. (2018a,b) provide the measurement techniques, but those techniques are restated in the present paper and are anchored by external inputs (Kurucz 1993 models, adopted stellar parameters, effective wavelengths); the cited prior work does not itself supply the wavelength-dependence claim as a premise. The assumption that the RC feature slope is entirely due to differential extinction, and possible systematic errors in the adopted effective wavelengths, are genuine astrophysical caveats that could bias alpha_JH and alpha_HKs, but they are not circularity: no equation in the paper defines the result in terms of itself, and no fitted parameter is subsequently presented as an independent prediction. Accordingly the derivation chain is self-contained with respect to the circularity criteria, and the appropriate score is 0.
Assumptions & free parameters
free parameters (3)
- Effective wavelengths λ_eff for J, H, Ks =
Not given in the paper; taken from filter curves
- Red clump synthetic model parameters (T_eff, log g, radius, metallicity) =
4750 K, 2.5, 10.0 R_sun, 2x solar
- Distance to the Galactic center =
8.0 kpc
assumptions (4)
- domain assumption The NIR extinction curve follows a power law A_λ ∝ λ^{-α} over JHKs
- domain assumption The slope of the red clump feature in the CMD is due entirely to differential extinction
- domain assumption The two red clump features can be separated with a two-Gaussian mixture and each traces a single stellar population
- domain assumption The GALACTICNUCLEUS photometric catalog is complete in the selected CMD region after masking
Cite this review
Pith. "Pith review of Variability of the near-infrared extinction curve towards the Galactic centre." pith.science (2026). https://pith.science/paper/SZCX42KN
@misc{pith2026190902494,
  author       = {Pith},
  title        = {Pith review of: Variability of the near-infrared extinction curve towards the Galactic centre},
  year         = {2026},
  howpublished = {\url{https://pith.science/paper/SZCX42KN}},
  note         = {Machine review of arXiv:1909.02494}
}
abstract
Due to the extreme extinction towards the Galactic centre ($A_{V} \sim 30$ mag), its stellar population is mainly studied in the near-infrared (NIR) regime. Therefore, a proper analysis of the NIR extinction curve is necessary to fully characterise the stellar structure and population of the inner part of the galaxy. We studied the dependence of the extinction index ($\alpha_\lambda$) in the NIR on the line of sight, wavelength, and extinction. We used the GALACTICNUCLEUS imaging survey, a high angular resolution catalogue ($0.2''$) for the inner part of the Galaxy in $JHK_s$, and studied the spatial variation in the extinction index. We also applied two independent methods based on red clump stars to compute the extinction index between different bands and its variation with wavelength. We did not detect any significant line-of-sight or extinction variation in $\alpha$ within the studied region in the nuclear stellar disc. The extinction index between $JH$ and $HK_s$ differs by $0.19 \pm 0.05$. We obtained mean values for the extinction indices $\alpha_{JH} = 2.43\pm0.03$ and $\alpha_{HK_s} = 2.23\pm0.03$. The dependence of the extinction index on the wavelength could explain the differences obtained for $\alpha_\lambda$ in the literature since it was assumed constant for the NIR regime.
Figures


Figures from the paper (1 more)

Forward citations
Cited by 1 Pith paper
-
Unveiling the Milky Way with a Gaia DR3 census of OB-type stars within 2 kpc. I. Tracing local Galactic structure, massive star-forming regions and core-collapse supernova progenitors
A Gaia DR3-based census of 105,971 OB stars within 2 kpc maps local Galactic structure and identifies over 4,200 core-collapse supernova or black hole progenitor candidates.
Reference graph
Works this paper leans on
-
[1]
Akaike, H. 1974, Automatic Control, IEEE Transactions on, 19, 716 Alonso-García, J., Minniti, D., Catelan, M., et al. 2017, ApJ, 849, L13
work page 1974
-
[2]
L., Rix, H.-W., et al
Bovy, J., Nidever, D. L., Rix, H.-W., et al. 2014, ApJ, 790, 127
2014
-
[3]
Chaplin, W. J. & Miglio, A. 2013, ARA&A, 51, 353
2013
-
[4]
Diolaiti, E., Bendinelli, O., Bonaccini, D., et al. 2000, A&AS, 147, 335
work page 2000
-
[5]
2019, arXiv e-prints, arXiv:1907.10731
Do, T., Hees, A., Ghez, A., et al. 2019, arXiv e-prints, arXiv:1907.10731
arXiv 2019
- [6]
-
[7]
2015, ApJ, 809, 143
Do, T., Kerzendorf, W., Winsor, N., et al. 2015, ApJ, 809, 143
2015
-
[8]
Draine, B. T. 1989, in ESA Special Publication, V ol. 290, Infrared Spectroscopy in Astronomy, ed. E. Böhm-Vitense, 93–98
work page 1989
Show all 30 references
-
[9]
2017, MNRAS, 464, 194
Feldmeier-Krause, A., Kerzendorf, W., Neumayer, N., et al. 2017, MNRAS, 464, 194
2017
-
[10]
K., Gillessen, S., Dodds-Eden, K., et al
Fritz, T. K., Gillessen, S., Dodds-Eden, K., et al. 2011, ApJ, 737, 73
2011
-
[11]
2016, ARA&A, 54, 95
Girardi, L. 2016, ARA&A, 54, 95
2016
-
[12]
J., Bandyopadhyay, R
Gosling, A. J., Bandyopadhyay, R. M., & Blundell, K. M. 2009, MNRAS, 394, 2247 Gravity Collaboration, Abuter, R., Amorim, A., et al. 2018, A&A, 615, L15
2009
-
[13]
R., Anderson, J., et al
Hosek, Matthew W., J., Lu, J. R., Anderson, J., et al. 2018, ApJ, 855, 13
2018
-
[14]
2008, A&A, 491, 941
Kissler-Patig, M., Pirard, J.-F., Casali, M., et al. 2008, A&A, 491, 941
2008
-
[15]
Kurucz, R. L. 1993, VizieR Online Data Catalog, 6039, 0
1993
-
[16]
W., Bono, G., et al
Matsunaga, N., Feast, M. W., Bono, G., et al. 2016, MNRAS, 462, 414
2016
-
[17]
2003, in Proc
Nagayama, T., Nagashima, C., Nakajima, Y ., et al. 2003, in Proc. SPIE, V ol. 4841, Instrument Design and Performance for Optical/Infrared Ground-based Telescopes, ed. M. Iye & A. F. M. Moorwood, 459–464
2003
-
[18]
2018, MNRAS, 478, 4374
Nandakumar, G., Ryde, N., Schultheis, M., et al. 2018, MNRAS, 478, 4374
2018
-
[19]
M., Udalski, A., Gould, A., & Pinsonneault, M
Nataf, D. M., Udalski, A., Gould, A., & Pinsonneault, M. H. 2011, ApJ, 730, 118
2011
-
[20]
2006, ApJ, 638, 839
Nishiyama, S., Nagata, T., Kusakabe, N., et al. 2006, ApJ, 638, 839
2006
-
[21]
2008, ApJ, 680, 1174
Nishiyama, S., Nagata, T., Tamura, M., et al. 2008, ApJ, 680, 1174
2008
-
[22]
T., et al
Nogueras-Lara, F., Schödel, R., Gallego-Calvente, A. T., et al. 2019, arXiv e- prints, arXiv:1908.10366
2019 arXiv
-
[23]
2011, Journal of Machine Learning Research, 12, 2825
Pedregosa, F., Varoquaux, G., Gramfort, A., et al. 2011, Journal of Machine Learning Research, 12, 2825
2011
-
[24]
Rieke, G. H. & Lebofsky, M. J. 1985, ApJ, 288, 618
1985
-
[25]
Z., Hosek, Matthew W., J., Lu, J
Rui, N. Z., Hosek, Matthew W., J., Lu, J. R., et al. 2019, arXiv e-prints, arXiv:1904.02395 Schödel, R., Najarro, F., Muzic, K., & Eckart, A. 2010, A&A, 511, A18+ Schödel, R., Yelda, S., Ghez, A., et al. 2013, MNRAS, 429, 1367
2019 arXiv
-
[26]
M., Origlia, L., et al
Schultheis, M., Rich, R. M., Origlia, L., et al. 2019, A&A, 627, A152
2019
-
[27]
1978, The Annals of Statistics, 6, 461
Schwarz, G. 1978, The Annals of Statistics, 6, 461
1978
-
[28]
Z., Stolovy, S
Scoville, N. Z., Stolovy, S. R., Rieke, M., Christopher, M., & Yusef-Zadeh, F. 2003, ApJ, 594, 294
2003
-
[29]
Stead, J. J. & Hoare, M. G. 2009, MNRAS, 400, 731
2009
-
[30]
& Gerhard, O
Wegg, C. & Gerhard, O. 2013, MNRAS, 435, 1874 Article number, page 5 of 5
2013
Reviewed August 14, 2026 · model on record in the stance chip above.
Discussion (0). Continue with ORCID to comment.