REVIEW 3 major objections 4 minor 86 references
Searching for the shadows of giants: characterising protoclusters with line of sight Lyman-{\alpha} absorption
T0 review · 3 major / 4 minor · reviewed 2026-08-14 · deepseek-v4-flash
Pith's one-line read Coherent strong Lyman-alpha absorption is not a reliable protocluster tracer: even with perfect cleaning, roughly half of such sightlines miss the clusters, and fewer than 0.1 per cent of protocluster sightlines pass the standard threshold.
desk verdict A careful hydro simulation study that credibly overturns the prior claim that CoSLAs are good protocluster tracers, though the quantitative fractions need more validation. read the letter →
The pith
A machine-rendered reading of the paper's core claim, the machinery that carries it, and where it could break.
The reading
What carries the argument
The machinery is a set of mock Lyman-$\alpha$ spectra generated from three independently calibrated cosmological hydrodynamic simulations, with protoclusters defined by tracing $z=0$ friends-of-friends haloes of mass $M_{\rm z=0}\ge10^{14}\,M_\odot$ back to $z\simeq2.4$. Each sightline is divided into $15\,h^{-1}\,\rm cMpc$ segments; the mass overdensity $\delta_{\rm m}$ of the surrounding cubic volume is then compared with the effective optical depth contrast $\delta_{\tau_{\rm eff}}$ of the spectrum. The CoSLA criterion ($\delta_{\tau_{\rm eff}}>3.5$ after removing segments containing SLLSs or DLAs) is the selection rule under test, and completeness and contamination are computed as functions of the $\delta_{\tau_{\rm eff}}$ threshold.
What would settle it
If observed CoSLA-selected fields at $z\sim2.3$ are followed up and the fraction that turns out to be associated with massive $z=0$ cluster descendants differs substantially from the roughly 55 per cent predicted here, the simulated clustering of high-column-density absorbers along sightlines would be ruled out. A more direct test is to measure the line-of-sight clustering of LLSs, SLLSs, and DLAs at $z\simeq2.4$ toward quasar pairs and compare it with the simulations' predictions.
Extended reading notes
Core claim
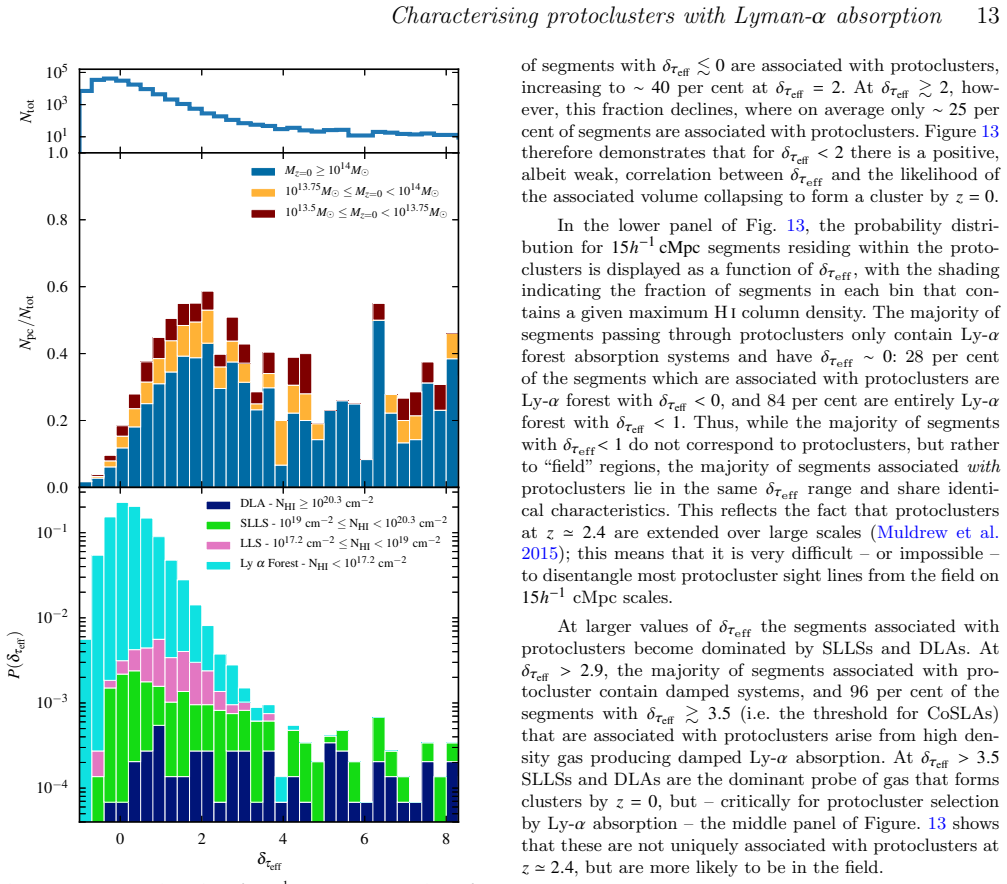
The central claim is that coherently strong intergalactic Lyman-$\alpha$ absorption (CoSLAs, defined as $15\,h^{-1}\,\rm cMpc$ spectral segments with $\delta_{\tau_{\rm eff}}>3.5$ after removing damped systems) is neither a unique nor a complete signpost for $M_{\rm z=0}\ge10^{14}\,M_\odot$ protoclusters at $z\simeq2.4$. In the primary simulation, CoSLAs are rare, cover a broad $\delta_{\rm m}$ range including underdense volumes, and $55$ per cent are associated with a protocluster. Conversely, $84$ per cent of sightlines through protoclusters contain only low-column-density Ly-$\alpha$ forest absorption with $\delta_{\tau_{\rm eff}}<1$, and fewer than $0.1$ per cent of protocluster sightlines reach the CoSLA threshold once damped systems are excluded. Raising the threshold to $\delta_{\tau_{\rm eff}}>4.1$ yields a completely clean protocluster sample, but completeness drops to about $17$ per cent; the authors note this is likely a lower limit because their volumes contain no $10^{15}\,M_\odot$ progenitors.
Load-bearing premise
The results assume the simulated incidence and line-of-sight clustering of high-column-density H I absorbers (LLSs, SLLSs, DLAs) at $z\sim2.4$ matches reality, since these systems dominate the high-$\delta_{\tau_{\rm eff}}$ tail; only the one-point column-density distribution is checked against observations, and the agreement at the highest columns is admitted to be possibly fortuitous.
Editorial extensions
If this is right
- Surveys that use CoSLAs to find protoclusters at $z\sim2$--$3$ will be heavily incomplete even in the ideal case of perfect damped-system removal; their selection functions must be calibrated before statistical use.
- Raising the threshold to $\delta_{\tau_{\rm eff}}\sim4.1$ after cleaning damped systems gives a pure but low-completeness protocluster sample (roughly 17 per cent of clusters), useful for studying individual extreme systems rather than populations.
- Coherent strong absorption is a better geometric tracer of matter aligned along the line of sight than of bound overdensity; it may be used to map intergalactic filaments at $z>2$.
- Correctly modelling both high-column-density absorbers and the opacity of underdense gas is necessary to predict the incidence of coherent absorption; low-resolution simulations overpredict CoSLA counts.
- Rare, very massive protoclusters ($M_{\rm z=0}>10^{15}\,M_\odot$) are absent from these volumes, so the relation could be more favourable for the most extreme structures; the quoted completeness is likely a lower limit.
Reading between the lines
- If CoSLAs preferentially select line-of-sight-aligned filamentary structures, their galaxy associations should differ from randomly chosen overdense regions: one would expect coherent absorption to correlate with elongated galaxy distributions and velocity caustics, a testable prediction for tomographic surveys.
- Real surveys cannot achieve perfect damped-system removal, so in practice contamination will be higher than the paper's roughly 45 per cent; the technique likely needs ancillary galaxy or metal-line information to be usable.
- The strong resolution dependence of CoSLA incidence implies that forecasts from older low-resolution dark-matter-only simulations need revisiting; observed CoSLA counts could be used to calibrate small-scale intergalactic-medium opacity models.
- The clean threshold at $\delta_{\tau_{\rm eff}}>4.1$ is model-dependent; a robust estimator should be calibrated in each observed data set using the distribution of $\delta_{\tau_{\rm eff}}$ itself.
Editorial analysis
A structured set of objections, weighed in public.
Referee Report
Summary. The paper uses three hydrodynamical simulations (Sherwood, EAGLE, Illustris) at z ~ 2.4 to test whether coherently strong Ly-alpha absorption on 15 h^-1 cMpc scales (CoSLAs, defined by delta_tau_eff > 3.5 after removing damped systems) traces z = 0 M >= 10^14 Msun protoclusters. It finds a weak delta_m - delta_tau_eff correlation with large scatter and shows that most sightlines through protoclusters are indistinguishable from the low-column-density Ly-alpha forest. In Sherwood, 12 of 22 post-DLA CoSLAs are associated with protoclusters; a threshold delta_tau_eff > 4.1 produces zero contamination but only 17% completeness, and fewer than 0.1% of sightlines through protoclusters meet the CoSLA threshold. The paper concludes that CoSLAs are incomplete and non-unique protocluster tracers and may instead trace filamentary structure.
Significance. If the quantitative results hold, this is an important correction to the Cai et al. (2016) picture and is directly relevant to upcoming DESI and WEAVE-QSO absorption surveys. Strengths of the paper include the use of three independent simulation codes with different feedback schemes, explicit tracking of z = 0 haloes back to z ~ 2.4, a CDDF validation, and resolution/box-size convergence tests. The paper is also careful to caveat its small box sizes and the absence of 10^15 Msun progenitors. The main quantitative claims, however, rest on small samples (22, 32 and 36 CoSLAs) and on the simulated line-of-sight clustering of LLSs/SLLSs, which is not validated; the central inference about non-uniqueness is therefore plausible but not yet fully pinned down.
major comments (3)
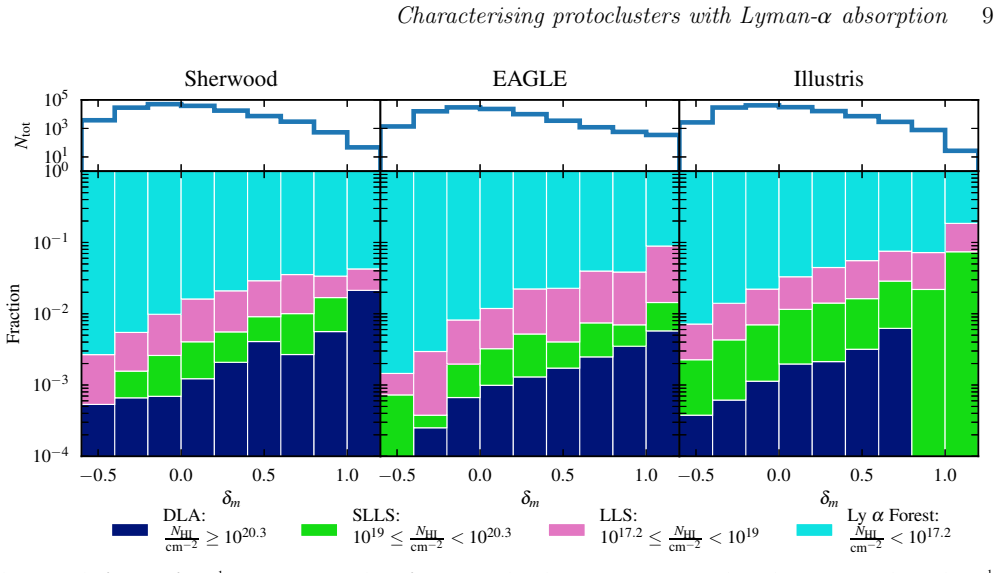
- [Section 3; Section 5.2, Figures 7 and 15] The central non-uniqueness result relies on the simulated population of LLSs and high-column Ly-alpha forest absorbers that remain after damped systems are removed, because these systems produce the CoSLA tail after DLA/SLLS removal. The only absorber validation, in Section 3 and Figure 1, is a one-point CDDF comparison with observational points displayed at N_HI < 10^17 cm^-2 and N_HI > 10^20 cm^-2, but not in the 10^17-10^20 cm^-2 interval that dominates the post-DLA CoSLA population; the authors themselves call the high-NHI agreement 'possibly fortuitous.' Because a 15 h^-1 cMpc segment is coherently strong only if these absorbers are aligned along the sightline, and no two-point or pair-sightline clustering test is provided, the 55/45 protocluster/field split in Figure 15 is not secure. I request either a quantitative clustering comparison (e.g., LLS/SLLS pair separations or quasar-pair statistics) or an explicit sensitivity test that varies LLS abundance and clustering while preserving the CDDF.
- [Section 5.3, Table 2, Figures 10-11] The resolution convergence test shows that the incidence of CoSLAs is not converged: N_CoSLA/V decreases from 4.9 x 10^-5 (80-512) to 3.1 x 10^-5 (80-1024) to 1.4 x 10^-5 (80-2048), and these tests use the QLy-alpha variant rather than the full-physics fiducial runs. Because the headline purity statement is based on only 22 CoSLAs in Sherwood, and the three full-physics simulations yield 22, 32 and 36 CoSLAs, the bootstrap uncertainties quoted in Section 5.2 understate the systematic uncertainty. The <0.1% completeness claim is more robust because it uses thousands of protocluster sightlines, but the quantitative 'approximately half' purity claim is not pinned down by the current tests.
- [Section 7, Figure 16] The zero-contamination threshold delta_tau_eff > 4.1 is selected post hoc from the same Sherwood sightlines used to evaluate it, and the evaluation sample contains only 22 CoSLAs. With such small numbers, the drop to zero contamination at delta_tau_eff = 4.1 may be a small-sample fluctuation rather than a stable prediction, and the threshold is explicitly model-dependent. I recommend presenting this as a proof-of-concept that a clean threshold exists in the simulations, with bootstrap or split-sample uncertainties, rather than as a predicted observable threshold.
minor comments (4)
- [Section 8] The conclusions contain duplicated 'per cent per cent' and describe the CoSLA threshold as '4.5 times the average' while the body defines it as delta_tau_eff > 3.5; both should be cleaned up for consistency.
- [Section 4.1, footnote 8] The association criterion 'at least one third of the segment passes within R95' is plausible but arbitrary; a brief sensitivity test (e.g., varying the required fraction between 1/4 and 1/2) would make the protocluster/field classification less binary.
- [Section 2.4] Please specify the numerical value(s) of the optical-depth rescaling constant applied to each simulation, since the delta_tau_eff thresholds depend sensitively on the calibration to the Becker et al. (2013) tau_eff measurement.
- [Figure 1] The caption should state explicitly that no observational CDDF data are displayed in the LLS/SLLS range 10^17-10^20 cm^-2; this is currently only clear from the body text.
Circularity Check
No significant circularity: the central results are measured coincidences between simulated Ly-alpha absorption and z=0 descendant protoclusters, not reductions of outputs to inputs.
full rationale
The paper's central claims — a weak delta_m-delta_tau_eff correlation, roughly 55 per cent of CoSLAs associated with protoclusters, and high incompleteness of CoSLA-selected samples — are derived by measuring mock absorption along sight lines through hydrodynamical simulations and comparing those sight lines with z=0 friends-of-friends descendant masses. None of these quantities is defined in terms of the others: delta_tau_eff is computed from mock spectra after a constant rescaling to match the observed mean effective optical depth (a calibration, not a prediction), and protocluster association is defined by R95 volumes of z=0 descendants. The CoSLA threshold delta_tau_eff > 3.5 is adopted from Cai et al. (2016) as an external baseline rather than fitted here. The clean-sample threshold delta_tau_eff > 4.1 is selected in-sample from the Sherwood contamination curve and explicitly labelled 'model dependent'; the paper does not present it as an independent prediction, so it does not meet the fitted-input-called-prediction criterion. The CDDF comparison in Section 3 and the use of three independent simulations (Sherwood, EAGLE, Illustris) provide external validation for the absorber population, and no load-bearing argument reduces to a self-citation or imported uniqueness theorem. The lack of a direct test of LLS/SLLS line-of-sight clustering is a validation gap and a correctness risk, but the manuscript itself flags the high-column-density CDDF agreement as 'possibly fortuitous'; this is an uncertainty, not a circular step.
Assumptions & free parameters
free parameters (2)
- Optical depth rescaling constant =
Normalized so mean effective optical depth tau_eff = 0.20 at z = 2.4
- Clean sample delta_tau_eff threshold =
4.1
assumptions (5)
- domain assumption Photo-ionization equilibrium with a spatially uniform UV background describes the IGM at z about 2.4.
- domain assumption Post-processing self-shielding from Rahmati et al. (2013) applied to Sherwood and EAGLE correctly captures LLS and DLA abundances.
- domain assumption z = 0 friends-of-friends groups with M >= 10^14 M_sun define the protocluster population, and their particle members at z about 2.4 mark the protocluster region.
- ad hoc to paper A 15 h^-1 cMpc segment is associated with a protocluster if at least one third of it passes within R95 of the protocluster.
- standard math Voigt profile approximation and SPH or mesh interpolation schemes produce realistic mock Ly-alpha spectra.
Cite this review
Pith. "Pith review of Searching for the shadows of giants: characterising protoclusters with line of sight Lyman-{\alpha} absorption." pith.science (2026). https://pith.science/paper/L2QKQ6LL
@misc{pith2026190902513,
  author       = {Pith},
  title        = {Pith review of: Searching for the shadows of giants: characterising protoclusters with line of sight Lyman-\alpha absorption},
  year         = {2026},
  howpublished = {\url{https://pith.science/paper/L2QKQ6LL}},
  note         = {Machine review of arXiv:1909.02513}
}
abstract
We use state of the art hydrodyamical simulations from the Sherwood, EAGLE and Illustris projects to examine the signature of $M_{\rm z=0}\simeq 10^{14}M_{\odot}$ protoclusters observed in Ly-$\alpha$ absorption at $z\simeq 2.4$. We find there is a weak correlation between the mass overdensity, $\delta_{\rm m}$, and the Ly-$\alpha$ effective optical depth relative to the mean, $\delta_{\tau_\textrm{eff}}$, averaged over $15~h^{-1}\rm\,cMpc$ scales, although scatter in the $\delta_{\rm m}$--$\delta_{\tau_\textrm{eff}}$ plane means it is not possible to uniquely identify large scale overdensities with strong Ly-$\alpha$ absorption. Although all protoclusters are associated with large scale mass overdensities, most sight lines through protoclusters in a $\sim 10^{6}$ $\rm cMpc^{3}$ volume probe the low column density Ly-$\alpha$ forest. A small subset of sight lines that pass through protoclusters exhibit coherent, strong Ly-$\alpha$ absorption on $15h^{-1}\rm\,cMpc$ scales, although these correspond to a wide range in mass overdensity. Assuming perfect removal of contamination by Ly-$\alpha$ absorbers with damping wings, more than half of the remaining sight lines with $\delta_{\tau_{\rm eff}}>3.5$ trace protoclusters. It is furthermore possible to identify a model dependent $\delta_{\tau_{\rm eff}}$ threshold that selects only protoclusters. However, such regions are rare: excluding absorption caused by damped systems, less than 0.1 per cent of sight lines that pass through a protocluster have $\delta_{\tau_{\rm eff}}>3.5$, meaning that any protocluster sample selected in this manner will also be highly incomplete. On the other hand, coherent regions of Ly-$\alpha$ absorption also provide a promising route for identifying and studying filamentary environments at high redshift.
Figures


Figures from the paper (14 more)





Reference graph
Works this paper leans on
-
[1]
write newline
" write newline "" before.all 'output.state := FUNCTION fin.entry write newline FUNCTION new.block output.state before.all = 'skip after.block 'output.state := if FUNCTION new.sentence output.state after.block = 'skip output.state before.all = 'skip after.sentence 'output.state := if if FUNCTION not #0 #1 if FUNCTION and 'skip pop #0 if FUNCTION or pop #1...
-
[2]
write newline
" write newline "" before.all 'output.state := FUNCTION fin.entry write newline FUNCTION new.block output.state before.all = 'skip after.block 'output.state := if FUNCTION new.sentence output.state after.block = 'skip output.state before.all = 'skip after.sentence 'output.state := if if FUNCTION not #0 #1 if FUNCTION and 'skip pop #0 if FUNCTION or pop #1...
-
[3]
Adams S. M., Martini P., Croxall K. V., Overzier R. A., Silverman J. D., 2015, @doi [Monthly Notices of the Royal Astronomical Society] 10.1093/mnras/stv065 , 448, 1335
-
[4]
Adelberger K. L., Steidel C. C., Shapley A. E., Pettini M., 2003, @doi [The Astrophysical Journal] 10.1086/345660 , 584, 45
doi:10.1086/345660 2003
-
[5]
Altay G., Theuns T., Schaye J., Crighton N. H., Dalla Vecchia C., 2011, @doi [Astrophysical Journal Letters] 10.1088/2041-8205/737/2/L37 , 737, 37
-
[6]
Altay G., Theuns T., Schaye J., Booth C. M., Vecchia C. D., 2013, @doi [Monthly Notices of the Royal Astronomical Society] 10.1093/mnras/stt1765 , 436, 2689
-
[7]
B a descu T., Yang Y., Bertoldi F., Zabludoff A., Karim A., Magnelli B., 2017, @doi [The Astrophysical Journal] 10.3847/1538-4357/aa8220 , 845, 172
-
[9]
Becker G. D., Hewett P. C., Worseck G., Prochaska J. X., 2013, @doi [Monthly Notices of the Royal Astronomical Society] 10.1093/mnras/stt031 , 430, 2067
Show all 86 references
-
[10]
Bird S., Vogelsberger M., Haehnelt M., Sijacki D., Genel S., Torrey P., Springel V., Hernquist L., 2014, @doi [Monthly Notices of the Royal Astronomical Society] 10.1093/mnras/stu1923 , 445, 2313
2014 doi
-
[11]
S., Becker G
Bolton J. S., Becker G. D., 2009, Resolving the high redshift Ly forest in smoothed particle hydrodynamics simulations , @doi 10.1111/j.1745-3933.2009.00700.x , https://academic.oup.com/mnrasl/article-abstract/398/1/L26/1039975
2009
-
[13]
S., Puchwein E., Sijacki D., Haehnelt M
Bolton J. S., Puchwein E., Sijacki D., Haehnelt M. G., Kim T. S., Meiksin A., Regan J. A., Viel M., 2017, @doi [Monthly Notices of the Royal Astronomical Society] 10.1093/mnras/stw2397 , 464, 897
2017 doi
-
[15]
Cai Z., et al., 2016, @doi [The Astrophysical Journal] 10.3847/1538-4357/833/2/135 , 833, 135
2016 doi
-
[16]
Cai Z., et al., 2017a, @doi [The Astrophysical Journal] 10.3847/1538-4357/aa5d14 , 837, 71
-
[17]
Cai Z., et al., 2017b, @doi [The Astrophysical Journal] 10.3847/1538-4357/aa6a1a , 839, 131
-
[18]
L., et al., 2011, @doi [Nature] 10.1038/nature09681 , 470, 233
Capak P. L., et al., 2011, @doi [Nature] 10.1038/nature09681 , 470, 233
2011 doi
-
[19]
Chabrier G., 2003, @doi [Publications of the Astronomical Society of the Pacific] 10.1086/376392 , 115, 763
2003 doi
-
[20]
K., Overzier R., Gebhardt K., 2013, @doi [Astrophysical Journal] 10.1088/0004-637X/779/2/127 , 779, 127
Chiang Y. K., Overzier R., Gebhardt K., 2013, @doi [Astrophysical Journal] 10.1088/0004-637X/779/2/127 , 779, 127
2013 doi
-
[21]
K., Overzier R., Gebhardt K., 2014, @doi [The Astrophysical Journal Letters] 10.1088/2041-8205/782/1/L3 , 782
Chiang Y. K., Overzier R., Gebhardt K., 2014, @doi [The Astrophysical Journal Letters] 10.1088/2041-8205/782/1/L3 , 782
2014 doi
-
[22]
K., et al., 2015, @doi [Astrophysical Journal] 10.1088/0004-637X/808/1/37 , 808
Chiang Y. K., et al., 2015, @doi [Astrophysical Journal] 10.1088/0004-637X/808/1/37 , 808
2015 doi
-
[23]
A., Hatch N
Cooke E. A., Hatch N. A., Muldrew S. I., Rigby E. E., Kurk J. D., 2014, @doi [Monthly Notices of the Royal Astronomical Society] 10.1093/mnras/stu522 , 440, 3262
2014 doi
-
[24]
A., et al., 2015, @doi [Monthly Notices of the Royal Astronomical Society] 10.1093/mnras/stv725 , 450, 1937
Crain R. A., et al., 2015, @doi [Monthly Notices of the Royal Astronomical Society] 10.1093/mnras/stv725 , 450, 1937
2015 doi
-
[25]
A., et al., 2017, @doi [Monthly Notices of the Royal Astronomical Society] 10.1093/mnras/stw2586 , 464, 4204
Crain R. A., et al., 2017, @doi [Monthly Notices of the Royal Astronomical Society] 10.1093/mnras/stw2586 , 464, 4204
2017 doi
-
[26]
Cucciati O., et al., 2014, @doi [Astronomy & Astrophysics] 10.1051/0004-6361/201423811 , 570, A16
2014 doi
-
[27]
Daddi E., et al., 2009, @doi [Astrophysical Journal] 10.1088/0004-637X/694/2/1517 , 694, 1517
2009 doi
-
[28]
Dalla Vecchia C., Schaye J., 2012, @doi [Monthly Notices of the Royal Astronomical Society] 10.1111/j.1365-2966.2012.21704.x , 426, 140
2012
-
[29]
S., et al., 2013, @doi [Astronomical Journal] 10.1088/0004-6256/145/1/10 , 145, 10
Dawson K. S., et al., 2013, @doi [Astronomical Journal] 10.1088/0004-6256/145/1/10 , 145, 10
2013 doi
-
[30]
A., Lidz A., Zaldarriaga M., Hernquist L., 2009, @doi [Astrophysical Journal] 10.1088/0004-637X/703/2/1416 , 703, 1416
Faucher-Gigu \` e re C. A., Lidz A., Zaldarriaga M., Hernquist L., 2009, @doi [Astrophysical Journal] 10.1088/0004-637X/703/2/1416 , 703, 1416
2009 doi
-
[31]
Finley H., Petitjean P., Noterdaeme P., P \^ a ris I., 2014, @doi [Astronomy & Astrophysics] 10.1051/0004-6361/201423961 , 572, 31
2014 doi
-
[32]
J., Hewett P
Francis P. J., Hewett P. C., 1993, @doi [The Astronomical Journal] 10.1086/116542 , 105, 1633
1993 doi
-
[33]
Francis P., et al., 1996, @doi [The Astrophysical Journal] 10.1086/176747 , 457, 490
1996 doi
-
[34]
Franx M., Illingworth G., de Zeeuw T., 1991, @doi [The Astrophysical Journal] 10.1086/170769 , 383, 112
1991 doi
-
[35]
D., Yee H
Gladders M. D., Yee H. K. C., 2000, Technical report, A New Method For Galaxy Cluster Detection I: The Algorithm , http://arxiv.org/abs/astro-ph/0004092 @doi 10.1086/301557. , http://arxiv.org/abs/astro-ph/0004092
2000 arXiv
-
[36]
Gurvich A., Burkhart B., Bird S., 2017, @doi [The Astrophysical Journal] 10.3847/1538-4357/835/2/175 , 835, 175
2017 doi
-
[37]
Haardt F., Madau P., 2001, ] 10.1038/nmat2978
2001 doi
-
[38]
Haardt F., Madau P., 2012, @doi [Astrophysical Journal] 10.1088/0004-637X/746/2/125 , 746
2012 doi
-
[39]
A., et al., 2011, @doi [Monthly Notices of the Royal Astronomical Society] 10.1111/j.1365-2966.2010.17538.x , 410, 1537
Hatch N. A., et al., 2011, @doi [Monthly Notices of the Royal Astronomical Society] 10.1111/j.1365-2966.2010.17538.x , 410, 1537
2011
-
[40]
Hinshaw G., et al., 2013, @doi [Astrophysical Journal, Supplement Series] 10.1088/0067-0049/208/2/19 , 208, 19
2013 doi
-
[41]
M., Carswell R
Kim T.-S., Partl A. M., Carswell R. F., M \" u ller V., 2013, @doi [Astronomy & Astrophysics] 10.1051/0004-6361/201220042 , 552, 77
2013 doi
-
[42]
Kravtsov A., Borgani S., 2012, @doi [Annual Review of Astronomy and Astrophysics] 10.1146/annurev-astro-081811-125502 , 50, 353
2012 doi
-
[43]
Krolewski A., et al., 2018, @doi [The Astrophysical Journal] 10.3847/1538-4357/aac829 , 861, 60
2018 doi
-
[44]
M., Crampton D., Dickinson M., 1996, @doi [The Astrophysical Journal] 10.1086/310319 , 471, L11
Le F \` e vre O., Deltorn J. M., Crampton D., Dickinson M., 1996, @doi [The Astrophysical Journal] 10.1086/310319 , 471, L11
1996 doi
-
[45]
G., Hennawi J
Lee K. G., Hennawi J. F., White M., Croft R. A., Ozbek M., 2014, @doi [Astrophysical Journal] 10.1088/0004-637X/788/1/49 , 788, 49
2014 doi
-
[46]
Lee K.-G., et al., 2016, @doi [The Astrophysical Journal] 10.3847/0004-637X/817/2/160 , 817, 160
2016 doi
-
[47]
Lee K.-G., et al., 2018, @doi [The Astronomical Journal Supplement Series] 10.3847/1538-4365/aace58 , 238
2018 doi
-
[48]
C., et al., 2014, @doi [Astronomy & Astrophysics] 10.1051/0004-6361/201423828 , 572, A41
Lemaux B. C., et al., 2014, @doi [Astronomy & Astrophysics] 10.1051/0004-6361/201423828 , 572, A41
2014 doi
-
[49]
C., et al., 2017, @doi [Astrophysics A & A] 10.1051/0004-6361/201730870 , 615, 77
Lemaux B. C., et al., 2017, @doi [Astrophysics A & A] 10.1051/0004-6361/201730870 , 615, 77
2017 doi
-
[50]
C., Thomas P
Lovell C. C., Thomas P. A., Wilkins S. M., 2018, @doi [Monthly Notices of the Royal Astronomical Society] 10.1093/mnras/stx3090 , 474, 4612
2018 doi
-
[51]
W., Nugent P., White M., Meiksin A
Luki \' c Z., Stark C. W., Nugent P., White M., Meiksin A. A., Almgren A., 2014, @doi [Monthly Notices of the Royal Astronomical Society] 10.1093/mnras/stu2377 , 446, 3697
2014 doi
-
[52]
Madau P., Dickinson M., 2014, @doi [Annual Review of Astronomy and Astrophysics] 10.1146/annurev-astro-081811-125615 , 52, 415
2014 doi
-
[53]
McAlpine S., et al., 2016, @doi [Astronomy and Computing] 10.1016/j.ascom.2016.02.004 , 15, 72
2016 doi
-
[54]
J., Lattanzio J
Monaghan J. J., Lattanzio J. C., 1985, @doi [Astronomy and Astrophysics] 10.1017/CBO9781107415324.004 , 149, 135
1985 doi
-
[55]
Morselli L., et al., 2014, @doi [Astronomy & Astrophysics] 10.1051/0004-6361/201423853 , 568, A1
2014 doi
-
[56]
Mukae S., et al., 2017, @doi [The Astrophysical Journal] 10.3847/1538-4357/835/2/281 , 835, 281
2017 doi
-
[57]
I., Hatch N
Muldrew S. I., Hatch N. A., Cooke E. A., 2015, @doi [Monthly Notices of the Royal Astronomical Society] 10.1093/mnras/stv1449 , 452, 2528
2015 doi
-
[58]
Nelson D., et al., 2015, @doi [Astronomy and Computing] 10.1016/j.ascom.2015.09.003 , 13, 12
2015 doi
-
[59]
Noterdaeme P., et al., 2012, @doi [Astronomy & Astrophysics] 10.1051/0004-6361/201220259 , 547, L1
2012 doi
-
[60]
A., 2016, @doi [The Astronomy and Astrophysics Review] 10.1007/s00159-016-0100-3 , 24, 14
Overzier R. A., 2016, @doi [The Astronomy and Astrophysics Review] 10.1007/s00159-016-0100-3 , 24, 14
2016 doi
-
[61]
H., Colombi S., Blaizot J., Dubois Y., Pichon C., 2014, @doi [The Astrophysical Journal] 10.1088/0004-637X/784/1/11 , 784, 11
Peirani S., Weinberg D. H., Colombi S., Blaizot J., Dubois Y., Pichon C., 2014, @doi [The Astrophysical Journal] 10.1088/0004-637X/784/1/11 , 784, 11
2014 doi
-
[62]
M., et al., 2016, Technical report, WEAVE-QSO: A Massive Intergalactic Medium Survey for the William Herschel Telescope , https://arxiv.org/pdf/1611.09388.pdf
Pieri M. M., et al., 2016, Technical report, WEAVE-QSO: A Massive Intergalactic Medium Survey for the William Herschel Telescope , https://arxiv.org/pdf/1611.09388.pdf . https://arxiv.org/pdf/1611.09388.pdf
2016 arXiv
-
[63]
Planck Collaboration et al., 2014, @doi [Astronomy & Astrophysics] 10.1051/0004-6361/201321591 , 571, A16
2014 doi
-
[64]
X., Wolfe A
Prochaska J. X., Wolfe A. M., 2009, @doi [The Astrophysical Journal] 10.1088/0004-637X/696/2/1543 , 696, 1543
2009 doi
-
[65]
Puchwein E., Springel V., 2013, @doi [Monthly Notices of the Royal Astronomical Society] 10.1093/mnras/sts243 , 428, 2966
2013 doi
-
[66]
H., Rai c evic̀ M., Schaye J., 2013, @doi [Monthly Notices of the Royal Astronomical Society] 10.1093/mnras/stt066 , 430, 2427
Rahmati A., Pawlik A. H., Rai c evic̀ M., Schaye J., 2013, @doi [Monthly Notices of the Royal Astronomical Society] 10.1093/mnras/stt066 , 430, 2427
2013 doi
-
[67]
Schaye J., Dalla Vecchia C., 2008, @doi [Monthly Notices of the Royal Astronomical Society] 10.1111/j.1365-2966.2007.12639.x , 383, 1210
2008
-
[68]
Schaye J., et al., 2015, @doi [Monthly Notices of the Royal Astronomical Society] 10.1093/mnras/stu2058 , 446, 521
2015 doi
-
[69]
Scoville N., et al., 2007, @doi [The Astrophysical Journal Supplement Series] 10.1086/516585 , 172, 1
2007 doi
-
[70]
Springel V., 2005, The cosmological simulation code GADGET-2 , @doi 10.1111/j.1365-2966.2005.09655.x , https://academic.oup.com/mnras/article-abstract/364/4/1105/1042826
2005
-
[71]
Springel V., 2010, @doi [Monthly Notices of the Royal Astronomical Society] 10.1111/j.1365-2966.2009.15715.x , 401, 791
2010
-
[72]
Springel V., Hernquist L., 2003, @doi [Monthly Notices of the Royal Astronomical Society] 10.1046/j.1365-8711.2003.06206.x , 339, 289
2003
-
[73]
Springel V., et al., 2005, @doi [Nature] 10.1038/nature03597 , 435, 629
2005 doi
-
[74]
W., White M., Lee K
Stark C. W., White M., Lee K. G., Hennawi J. F., 2015, @doi [Monthly Notices of the Royal Astronomical Society] 10.1093/mnras/stv1620 , 453, 311
2015 doi
-
[75]
C., Adelberger K
Steidel C. C., Adelberger K. L., Shapley A. E., Erb D. K., Reddy N. A., Pettini M., 2005, @doi [The Astrophysical Journal] 10.1086/429989 , 626, 44
2005 doi
-
[76]
Tepper-Garc \' i a T., 2006, @doi [Monthly Notices of the Royal Astronomical Society] 10.1111/j.1365-2966.2006.10450.x , 369, 2025
2006
-
[77]
R., Thomas P
Theuns T., Leonard A., Efstathiou G., Pearce F. R., Thomas P. A., 1998, @doi [Monthly Notices of the Royal Astronomical Society] 10.1046/j.1365-8711.1998.02040.x , 301, 478
1998
-
[78]
Toshikawa J., et al., 2018, @doi [Publications of the Astronomical Society of Japan] 10.1093/pasj/psx102 , 70, 12
2018 doi
-
[79]
D., Levi M
Vargas-Magana M., Brooks D. D., Levi M. M., Tarle G. G., 2019
2019
-
[80]
P., et al., 2007, @doi [A & A] 10.1051/0004-6361:20053941 , 461, 823
Venemans B. P., et al., 2007, @doi [A & A] 10.1051/0004-6361:20053941 , 461, 823
2007 doi
-
[81]
G., Springel V., 2004, @doi [Monthly Notices of the Royal Astronomical Society] 10.1111/j.1365-2966.2004.08224.x , 354, 684
Viel M., Haehnelt M. G., Springel V., 2004, @doi [Monthly Notices of the Royal Astronomical Society] 10.1111/j.1365-2966.2004.08224.x , 354, 684
2004
-
[82]
Villaescusa-Navarro F., et al., 2018, @doi [The Astrophysical Journal] 10.3847/1538-4357/aadba0 , 866, 135
2018 doi
-
[83]
Vogelsberger M., Genel S., Sijacki D., Torrey P., Springel V., Hernquist L., 2013, @doi [Monthly Notices of the Royal Astronomical Society] 10.1093/mnras/stt1789 , 436, 3031
2013 doi
-
[84]
Vogelsberger M., et al., 2014, @doi [Monthly Notices of the Royal Astronomical Society] 10.1093/mnras/stu1536 , 444, 1518
2014 doi
-
[85]
Wendland H., 1995, @doi [Advances in Computational Mathematics] 10.1007/BF02123482 , 4, 389
1995 doi
-
[86]
White M., 2000, @doi [Astronomy & Astrophysics] 10.1051/0004-6361:20000357 , 367, 27
2000 doi
-
[87]
H., Lehnert M
Wold M., Armus L., Neugebauer G., Jarrett T. H., Lehnert M. D., 2003, @doi [The Astronomical Journal] 10.1086/378362 , 126, 1776
2003 doi
-
[88]
Wylezalek D., et al., 2013, @doi [Astrophysical Journal] 10.1088/0004-637X/769/1/79 , 769, 79
2013 doi
-
[89]
Zheng W., et al., 2006, @doi [The Astrophysical Journal] 10.1086/500167 , 640, 574
2006 doi
Reviewed August 14, 2026 · model on record in the stance chip above.
Discussion (0). Continue with ORCID to comment.