REVIEW 4 major objections 8 minor 24 references
Simple and robust speckle detection method for fire and heat detection in harsh environments
T0 review · 4 major / 8 minor · reviewed 2026-08-14 · deepseek-v4-flash
Pith's one-line read A laser speckle pattern's flicker, not its brightness, carries the fire signal.
desk verdict A credible proof-of-concept for speckle-based fire detection with an honest limitation section; the 91% factory accuracy is not yet a field-validated fire-detection rate. read the letter →
The pith
A machine-rendered reading of the paper's core claim, the machinery that carries it, and where it could break.
The reading
What carries the argument
The central object is the retroreflected dynamic speckle pattern: a collimated 650 nm diode laser crosses the monitored region, reflects off rough tape, and a lens focuses a small portion of the back-reflected speckle field onto a PIN photodiode. Heat-convection-induced refractive-index fluctuations make the beam perform a random walk over the rough surface, turning phase noise into intensity modulation. Every three seconds the system records a time trace, computes its Fourier spectrum, and derives eight descriptors (time- and frequency-domain variance and Frobenius norm, 99th percentile, and linear-fit coefficients with goodness of fit); principal-component analysis reduces these to two or three dimensions, and a support-vector machine with radial-basis kernel draws the fire/no-fire boundary. The load-bearing physical identity is the refractive-index expansion with $\left(\partial n/\partial p\right)_0 = 1.914\times 10^{-9}\,\mathrm{Pa}^{-1}$ and $\left(\partial n/\partial T\right)_0 = -9.567\times 10^{-7}\,{}^\circ\mathrm{C}^{-1}$, which is why the noise spectrum, not the absolute optical power, is the informative quantity.
What would settle it
Run the identical sensor and classifier against a genuine small developing fire, such as smouldering material or a small pan fire, in a dusty site at roughly 50 m, and compare the two-or-three-principal-component separation with the heat-gun results. If the broadband 10 Hz to 5 kHz linear spectrum does not appear before smoke or flame, or if a non-fire hot exhaust vent produces the same spectral signature, the central claim of reliable early fire detection in harsh environments would be contradicted.
Extended reading notes
Core claim
The central claim is that a fire is best recognized by the broadband noise it imprints on a dynamic speckle pattern, not by the amount of light reaching the detector or its wavelength. Fire-generated heat convection produces random refractive-index fluctuations along the laser path, and the first-order expansion $n \approx n_0 + (\partial n/\partial p)_0 p' + (\partial n/\partial T)_0 T'$ shows that temperature changes dominate pressure changes by about a factor of 500. In practice, this means the beam wanders and defocuses on a rough retroreflector, converting phase fluctuations into intensity modulation of the speckle field. The authors demonstrate that this signature is broadband and roughly linear in the 10 Hz to 5 kHz band, while mechanical vibration produces narrow-line noise, so the spectral shape disambiguates fire from vibration. They report 91% classification accuracy on 221 simulated fires in a dusty waste plant, using two principal components of eight descriptors, with a small improvement to 94% using a third component.
Load-bearing premise
The factory trial assumes heat-gun-simulated fires produce the same refractive-index fluctuation signature as real developing fires; the authors themselves caution that a real live fire will certainly not give such separable data.
Editorial extensions
If this is right
- A partially obstructed beam can still alarm, because the classifier reads the shape of the noise spectrum rather than the absolute reflected power.
- Mechanical vibration, a common false-alarm source, is rejected by the linearity of the frequency spectrum, so heavy shaking raises variance but not the fire signature.
- Fires without visible flames can be detected, since the convective heat plume perturbs the refractive index before smoke or flame appears.
- The 101 m laboratory range was limited by building size rather than the method; with a 25–30 mW laser and a 75 mm collection lens, the authors project ranges beyond 500 m.
- Majority voting over three to five consecutive classifications would cut the 6% factory misclassification rate to roughly 1% or 0.2%, at the cost of a response-time increase by that factor.
Reading between the lines
- The paper leaves unexamined the single-beam geometry: because the beam defines a line, full area coverage would require multiple beams or a scanning mirror, but the same classifier and descriptors would transfer directly.
- A testable extension is separating a fire plume from a hot industrial exhaust or steam vent; because the temperature coefficient of refractive index is roughly 500 times the pressure coefficient, temperature-dominated plumes should be distinguishable from pressure-dominated acoustic signatures, though real exhaust contains both.
- The 10-second averaging window sets an unstated trade-off between early detection and spectral resolution; shorter windows could catch a fast-developing fire sooner but would degrade low-frequency detail and may increase sensitivity to vibration.
- The reported 91% comes from heat-gun data, so it should be read as an upper bound on field performance; the authors' admission that real fires yield less separable data implies the final operational threshold would trade sensitivity against false-alarm rate.
Signed reviews
Editorial analysis
A structured set of objections, weighed in public.
Referee Report
Summary. The manuscript proposes a fire/heat detection method based on dynamic speckle: a 650 nm laser beam is reflected from a rough retroreflective surface, and heat convection from a fire is said to cause random refractive-index fluctuations that modulate the detected speckle intensity. The authors argue that measuring the noise spectrum rather than absolute light amplitude makes the sensor robust to dust and smoke. They report laboratory measurements at 101 m using time-domain variance and the linearity of the Fourier-domain noise spectrum, a demonstration that the signal survives smoke/dust obscuration, and a factory acceptance test at a waste plant in which a PCA/SVM classifier is reported to achieve 91% accuracy on 221 heat-gun-simulated fires among 146,306 total samples. The paper concludes that the system can detect small fires in harsh, dusty environments.
Significance. If the fire-specificity claim were established, the method would be a useful, low-cost addition to fire detection in dusty industrial environments, since it targets a genuine limitation of beam-attenuation detectors. The 101-m laboratory range and the qualitative demonstration that the detection signal survives partial beam obscuration are concrete strengths. However, as it stands, the paper is a proof-of-concept for detecting heat convection from a single heat-gun source, not a validated fire detector; the validation gaps enumerated below directly affect the central claim. The authors' explicit admission that a real developing fire will not produce such separable data is an important and honest caveat that currently sets the limit of the paper's claim.
major comments (4)
- [III.B] The reported 91% accuracy is not interpretable without per-class metrics, and the feature-selection procedure leaks test information. With 221 positive samples out of 146,306, an always-negative classifier would achieve 99.85% overall accuracy, so a 91% overall accuracy would be below the trivial baseline; if 91% is instead the recall on fire samples, no false-alarm rate or confusion matrix is provided. Additionally, the PCA basis is computed from all 146,306 samples before the training/test split, so the test set influences the dimensionality reduction. The paper should report a confusion matrix, precision/recall, false-alarm rate, and a cross-validated pipeline in which PCA is fitted only on the training folds.
- [III.B] The claimed specificity to fire is not established. The only positive samples come from a single stationary 260°C heat-gun configuration, and the authors state that "A real live scenario with a developing fire will certainly not result in such separable data." Since the central claim is fire detection, the transfer from a heat-gun plume to a real fire is an unsupported load-bearing assumption. In addition, Section II lists ventilation, heating systems, steam, and industrial pressure releases as confounding non-fire events, but none of these are tested. The conclusions should either be narrowed to detection of heat-convection signatures, or the paper should provide tests with real fires or with multiple controlled non-fire heat sources.
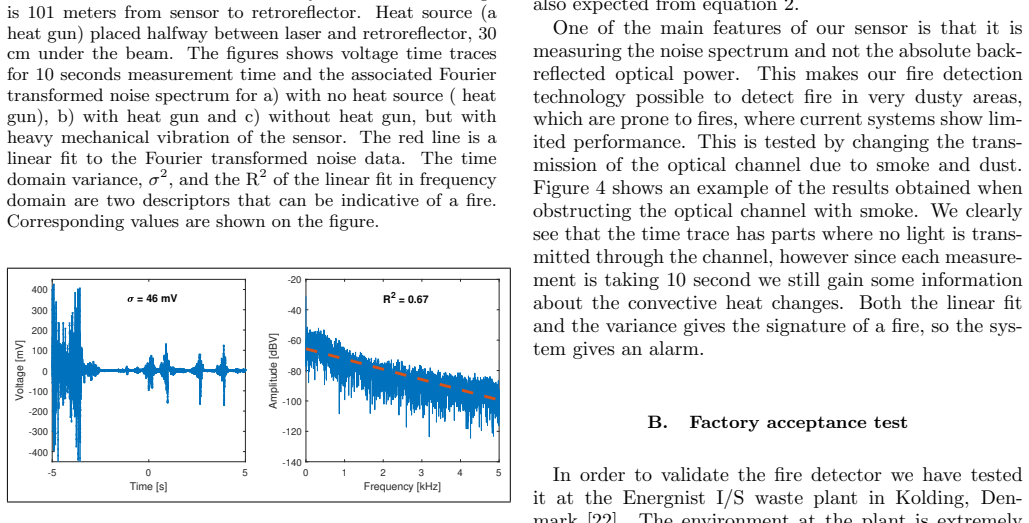
- [III.A] The laboratory discrimination thresholds are not independently validated. Figure 3 shows single 10-s traces for each of three conditions without repeated trials, error bars, or statistical tests, and the thresholds (variance above 400 mV^2 and R^2 above 0.45) appear to be chosen post hoc from the same traces they are used to interpret. This is a form of empirical fitting rather than an independent test. The paper should either report distributions over repeated recordings or clearly label these values as calibration examples rather than validated detection criteria.
- [I and III] The claimed ability to detect "very small temperature fluctuations" at an early fire stage is not quantified. The only positive tests use a 260°C heat gun producing a plume roughly 10°C above ambient at 25 cm below the laser beam, and no minimum temperature-fluctuation amplitude, heat-release rate, or sensitivity-versus-range curve is reported. Without such a characterization, the early-detection claim is unsupported by the presented data.
minor comments (8)
- [III.A / Fig. 3 caption] The caption for Fig. 3(a), "with no heat source ( heat gun)," is contradictory; it should read "without heat gun." Also, the text "R 2 ¿ 0.45" appears to be a typographical error for "R^2 > 0.45."
- [Abstract / III] The abstract states that time traces and frequency noise spectra are measured every 3 seconds, but the laboratory results use 10-second time traces and Section III.B says 1600 raw samples are acquired every 3 seconds. Please clarify the relationship between the 3-s sampling cycle and the 10-s analysis window.
- [III.B] The training/test split is described only as "the complete dataset has been split into a training and a test dataset"; the split ratio, stratification, and method for choosing the SVM hyperparameters are not given. Please provide these details so the reported accuracy is reproducible.
- [I] The sentence "Which requires reference noise traces of the background noise without any fire" is a fragment and leaves unclear whether the deployed system requires a per-site baseline reference. If it does, specify how the reference is obtained and updated.
- [III.B] The binomial majority-vote calculation assumes independent classification errors across samples, but consecutive samples in a time series are likely correlated. The predicted reduction from 6% to 1% or 0.2% should be described as an upper bound under independence, not a guaranteed performance gain.
- [II / Fig. 3] The text refers to a frequency band from 10 Hz to 5 kHz, but the plotted spectra appear to extend to 0 Hz. Please describe how the low-frequency cutoff is implemented in the preprocessing.
- [I] The claim that the sensor is "the first of its kind" should be supported by a more detailed comparison with prior dynamic-speckle and beam-wander fire-detection work; the related-work discussion is currently brief.
- [General] The paper does not state whether the dataset or classifier code will be made available. Given the machine-learning claims and the small number of positive samples, releasing the feature set and classifier parameters would substantially improve reproducibility.
Circularity Check
No significant circularity: the detection principle follows from standard refractive-index and speckle physics, and the reported validation is empirical rather than derived from its own output.
full rationale
The paper's detection principle starts from the standard first-order expansion n ≈ n0 + (∂n/∂p)_0 p' + (∂n/∂T)_0 T' (Eq. 1), with textbook values for the derivatives, and from standard dynamic-speckle physics; neither input contains the target result that speckle modulation indicates fire. The lab alarm rule (variance > 400 mV^2 and R^2 > 0.45) is a heuristic calibrated on the three displayed recordings, but it is presented only as 'the system could be set' to use such thresholds, not as an out-of-sample prediction, so it is not a fitted input renamed as a prediction. The factory SVM evaluation is an empirical train/test split (the paper says 'The complete dataset has been split into a training and a test dataset'), and the admitted heat-gun proxy ('A real live scenario with a developing fire will certainly not result in such separable data') is an external-validity caveat, not a circular step. The only self-citation, Ref. [15] (including co-author Lassen), is cited incidentally among general beam-displacement measurement schemes and is not load-bearing. Methodological concerns such as PCA computed on the full dataset and the absence of false-alarm rates are correctness/rigor issues, not circularity, because the reported 91% is not equivalent by construction to the training inputs. The derivation chain is therefore self-contained rather than circular.
Assumptions & free parameters
free parameters (5)
- Alarm variance threshold =
400 mV^2
- R^2 linearity threshold =
> 0.45
- Frequency analysis band =
10 Hz to 5 kHz
- PCA components used =
2 or 3
- SVM hyperparameters =
not disclosed
assumptions (5)
- domain assumption The local refractive index of air follows the first-order Taylor expansion in Eq. (1), with the coefficients in Eq. (2) for 20 C, 101.325 kPa, 50% humidity, and 0.05% CO2.
- domain assumption Heat convection from a fire produces random fluctuations in the refractive index along a beam path, causing measurable beam jitter, defocus, and speckle modulation.
- domain assumption Mechanical vibrations produce narrow linewidth spectral features, while fire heat produces broad-band noise with a linear spectrum.
- domain assumption Dust and smoke attenuate the beam but leave a detectable speckle intensity modulation as long as some light reaches the detector.
- domain assumption The retroreflected speckle intensity signal represents beam jitter rather than laser amplitude or detector noise.
Cite this review
Pith. "Pith review of Simple and robust speckle detection method for fire and heat detection in harsh environments." pith.science (2026). https://pith.science/paper/KHYENIW6
@misc{pith2026190912389,
  author       = {Pith},
  title        = {Pith review of: Simple and robust speckle detection method for fire and heat detection in harsh environments},
  year         = {2026},
  howpublished = {\url{https://pith.science/paper/KHYENIW6}},
  note         = {Machine review of arXiv:1909.12389}
}
read the original abstract
Standard laser based fire detection systems are often based on measuring variation of optical signal amplitude. However, mechanical noise interference and loss from dust and steam can obscure the detection signal, resulting in faulty results or inability to detect a potential fire. The presented fire detection technology will allow the detection of fire in harsh and dusty areas, which are prone to fires, where current systems show limited performance or are unable to operate. It is not the amount of light nor its wavelength that is used for detecting fire, but how the refractive index randomly fluctuates due to the heat convection from the fire. In practical terms this means that light obstruction from ambient dust particles will not be a problem as long as a small fraction of the light is detected and that fires without visible flames can still be detected. The standalone laser system consists of a Linux-based Red Pitaya system, a cheap 650 nm laser diode, and a PIN photo-detector. Laser light propagates through the monitored area and reflects off a retroreflector generating a speckle pattern. Every 3 seconds time traces and frequency noise spectra are measured and 8 descriptors are deduced to identify a potential fire. Both laboratory and factory acceptance tests have been performed with success.
Figures


Figures from the paper (2 more)

Reference graph
Works this paper leans on
-
[1]
R. Knox, K. Ajay, and K. Boettger, ”Particle detection”, US2011058167A1 (2011)
work page 2011
-
[2]
J. Li, S. Wang, Z. Dou, and Z. Yang, ”Discrimination of smoke particles using infrared photoelectrical detection. Int. J. Infrared Millim”, 22, 141–151 (2001)
work page 2001
-
[3]
D.D. Evans and D.W. Stroup, Methods to Calculate the Response Time of Heat and Smoke Detectors Installed Below Large Unobstructed Ceilings, Fire Technology,22, 54–65 (1986)
work page 1986
-
[4]
S.L.Lee and J.M.Hellman ”Heat and Mass Transfer in Fire Research”, Advances in Heat Transfer, 10, 219–284 (1974)
work page 1974
-
[5]
R. Chagger, and D. Smith, ”The Causes of False Fire Alarms in Buildings”, Briefing Paper BRE Global Ltd. Watford, UK, (2014)
work page 2014
-
[6]
D. I. Lawson, ”Laser Beam Fire Detector,” British Patent Application No. 52659/66, November 24, (1966)
work page 1966
-
[7]
E. D. Lancaster, K. L. McNesby, R. G. Daniel, and A. W. Miziolek, ”Spectroscopic analysis of fire suppressants and refrigerants by laser-induced breakdown spectroscopy,” Appl. Opt. 38, 1476–1480 (1999)
work page 1999
- [8]
Show all 24 references
-
[9]
Umar, L.C.D
M.M. Umar, L.C.D. Silva, M.S.A. Bakar,and M.I. Petra, ”State of the art of smoke and fire detection using image processing”, International Journal of Signal and Imaging Systems 10, 22–30 (2017)
2017
-
[10]
J. A. Milke, and T. J. McAvoy. ”Analysis of signature patterns for discriminating fire detection with multiple sensors”, Fire Technology 31 120–136 (1995)
1995
-
[11]
Chen, D.C
S.-J. Chen, D.C. Hovde, K.A. Peterson, and A.W. Mar- shall, ” Fire detection using smoke and gas sensors”, Fire Safety J. 42, 507–515 (2007)
2007
-
[12]
Atkinson and D.D
G.T. Atkinson and D.D. Drysdale, Convective Heat Transfer from Fire Gases, Fire Safety Journal, 19, 217– 245 (1992)
1992
-
[13]
Hollman, Heat Transfer, McGraw-Hill, New York (1976)
J.P. Hollman, Heat Transfer, McGraw-Hill, New York (1976)
1976
-
[14]
W. M. Isterling, B. B. Dally, Z. T. Alwahabi, M. Dubovinsky, and D. Wright, ”Beam displacement as a function of temperature and turbulence length scale at two different laser radiation wavelengths,” Appl. Opt.51, 55–63 (2012)
2012
-
[15]
Delaubert, N
V. Delaubert, N. Treps, M. Lassen, C. C. Harb, C. Fabre, P. K. Lam, and H.-A. Bachor, TEM10 homo- dyne detection as an optimal smalldisplacement and tilt- measurement scheme, Phys. Rev. A 74, 053823 (2006)
2006
-
[16]
J. W. Goodman, ”Some fundamental properties of speckle*,” J. Opt. Soc. Am. 66, 1145–1150 (1976)
1976
-
[17]
P. F. Almoro, A. Margarette S. Maallo, and S. G. Han- son, ”Fast-convergent algorithm for speckle-based phase retrieval and a design for dynamic wavefront sensing,” Appl. Opt. 48, 1485–1493 (2009)
2009
-
[18]
Nassif, C
R. Nassif, C. A. Nader, C. Afif, F. Pellen, G. Le Brun, B. Le Jeune, and M. Abboud, Detection of golden apples climacteric peak by laser biospeckle measurements, Appl. Opt. 53, 8276–8282 (2014)
2014
-
[19]
A. L. Buck, ”Effects of the Atmosphere on Laser Beam Propagation,” Appl. Opt. 6, 703–708 (1967)
1967
-
[20]
Chiba, Spot dancing of the laser beam propagated through the turbulent atmosphere, Appl
T. Chiba, Spot dancing of the laser beam propagated through the turbulent atmosphere, Appl. Opt. 10, 2456– 2461 (1971)
1971
-
[21]
R. J. Hill, S. F. Clifford, and R. S. Lawrence, Refractive- index and absorption fluctuations in the infrared caused by temperature, humidity, and pressure fluctutations, J. Opt. Soc. Am. 70, 1192–1205 (1980)
1980
-
[22]
http://www.energnist.dk/
-
[23]
Hastie, R
T. Hastie, R. Tibshirani, J. Friedman, and J. Franklin, ”The elements of statistical learning: data mining, in- ference and prediction”, The Mathematical Intelligencer 27, 83–85 (2005)
2005
-
[24]
R Gunn et
S. R Gunn et. al., ”Support vector machines for classi- fication and regression”, SIS technical report 14, 5–16 (1998)
1998
Reviewed August 14, 2026 · model on record in the stance chip above.
Discussion (0). Continue with ORCID to comment.