Φ index: A standardized scale-independent and field-normalized citation indicator
Pith reviewed 2026-05-24 04:31 UTC · model grok-4.3
The pith
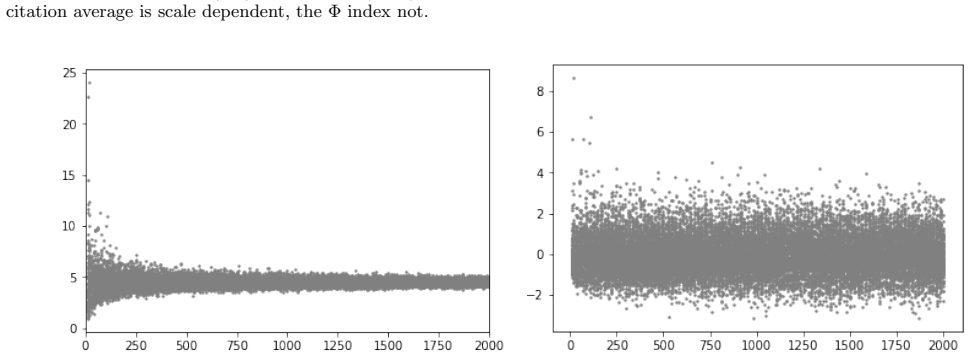
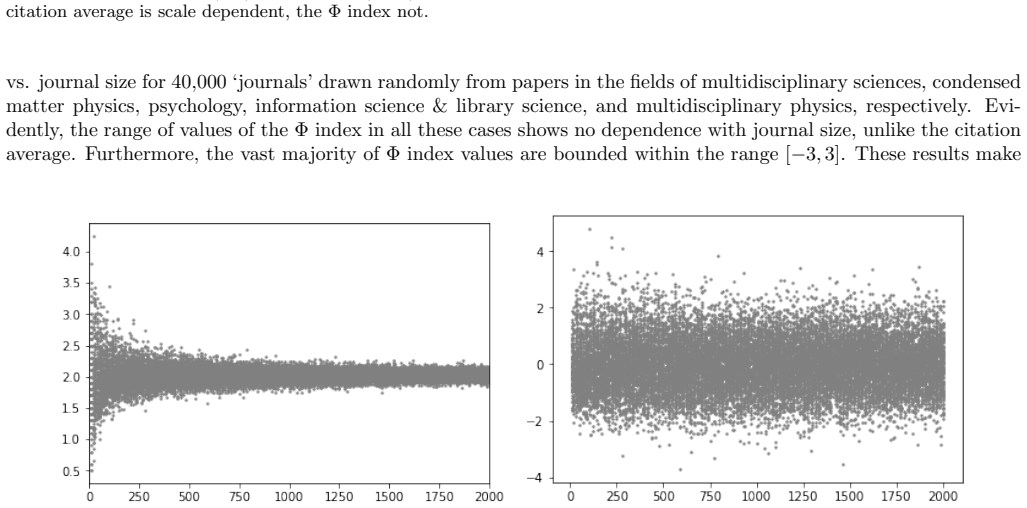
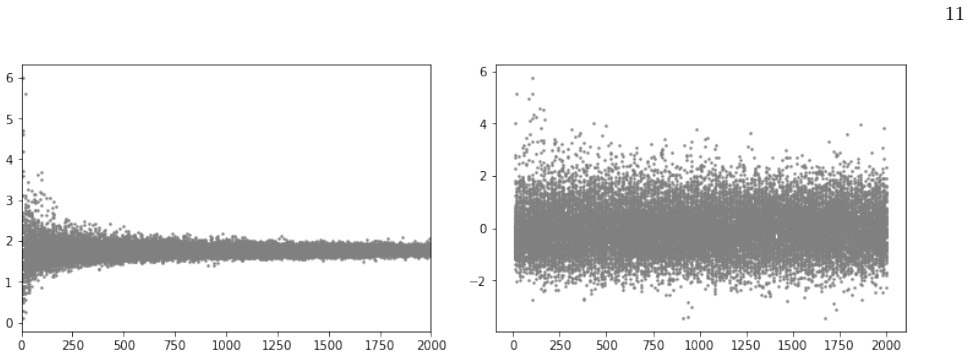
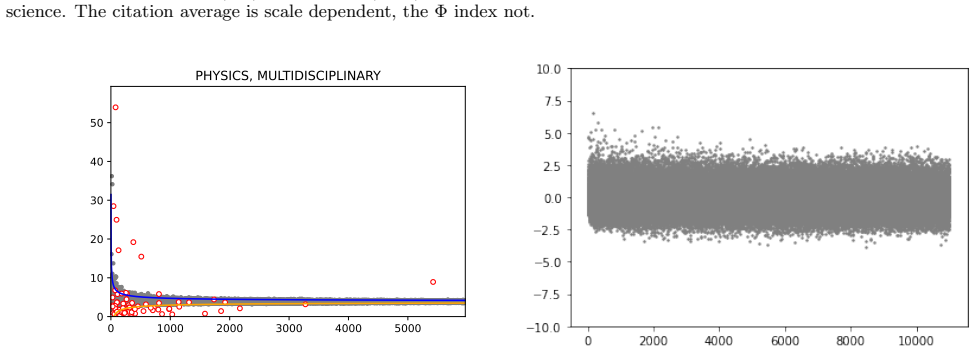
The Φ index standardizes journal citation averages to correct for size and field biases.
A machine-rendered reading of the paper's core claim, the machinery that carries it, and where it could break.
Core claim
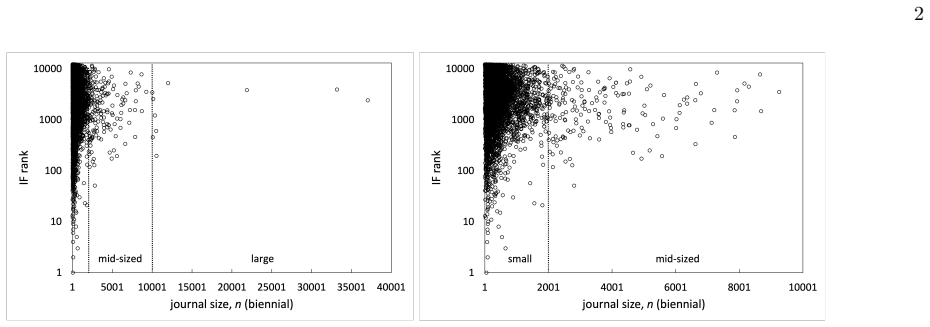
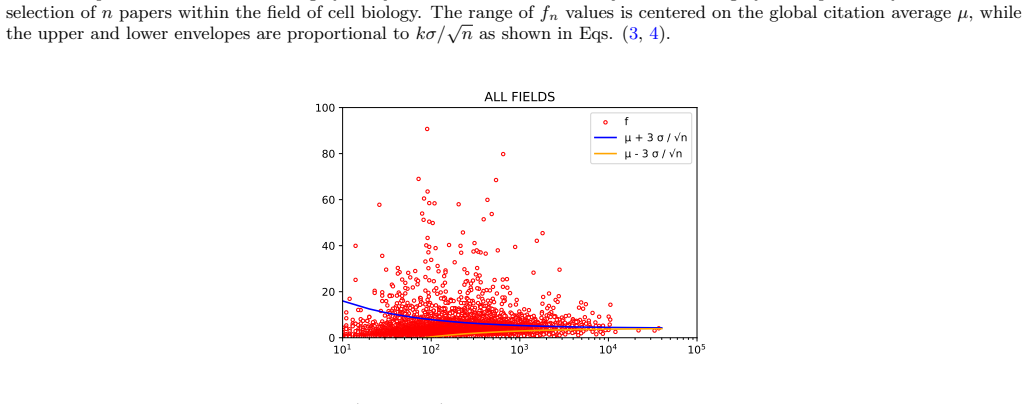
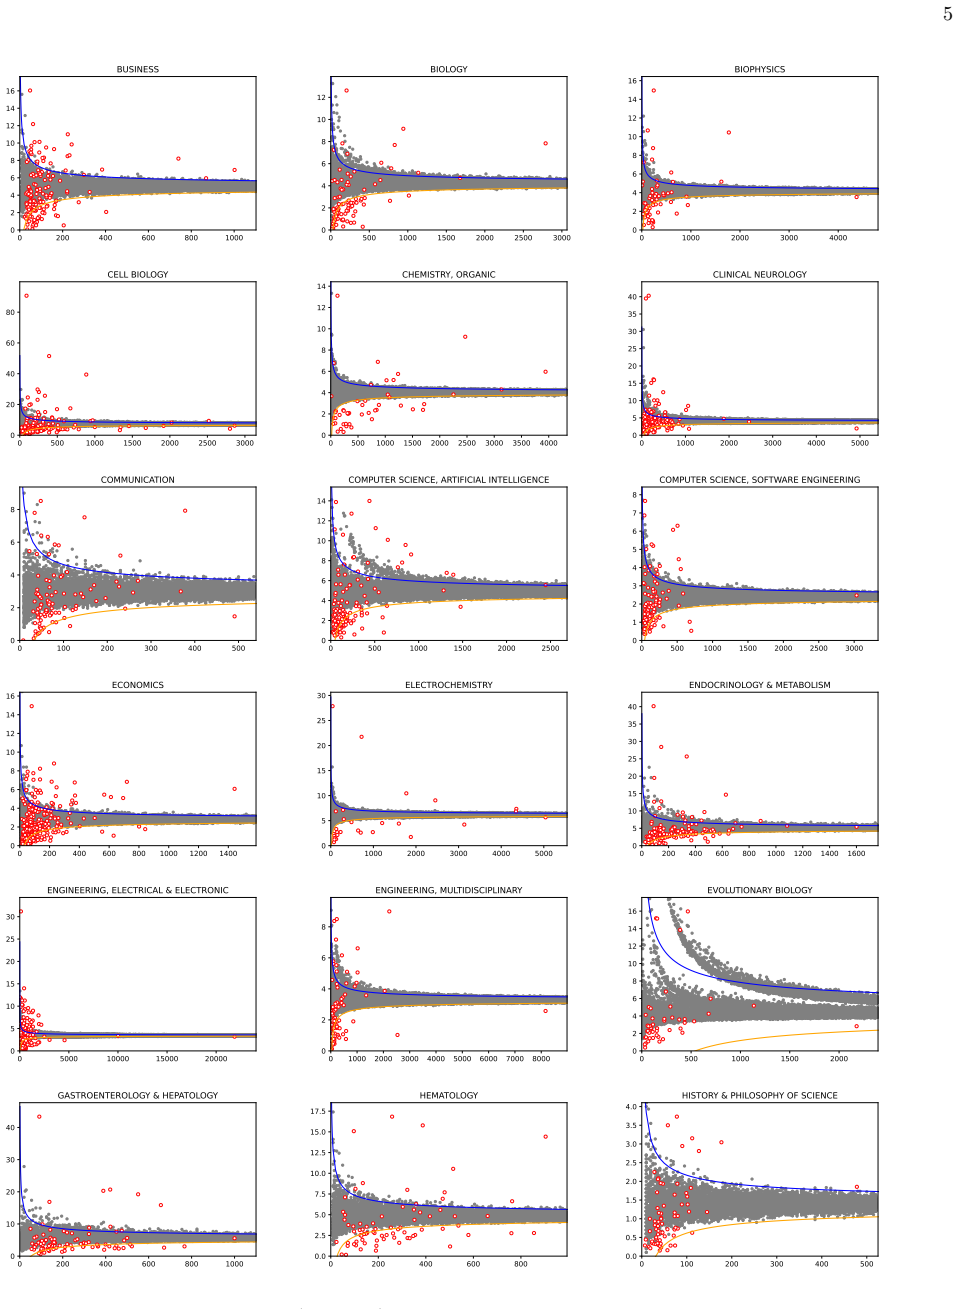
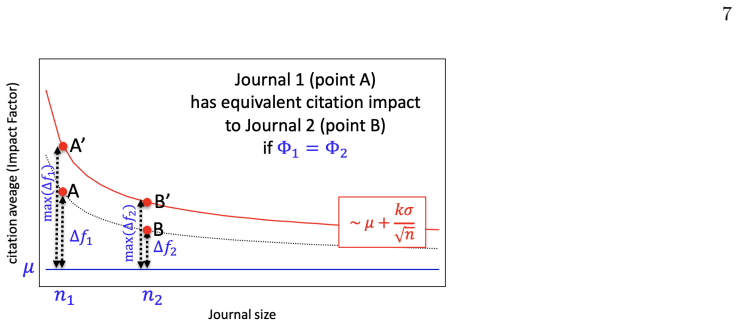
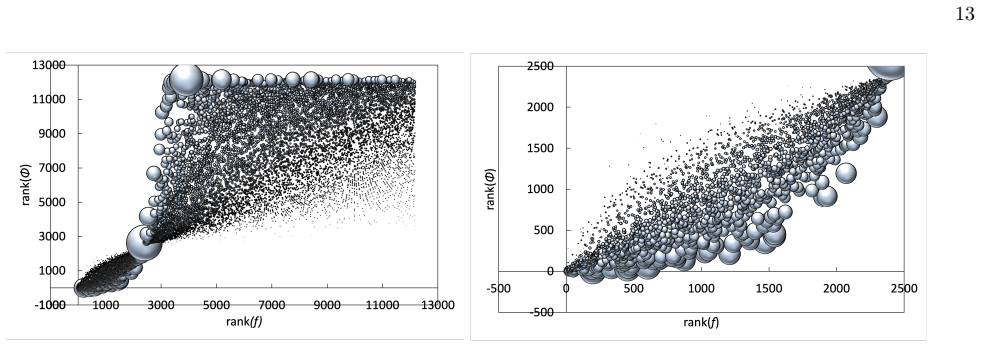
The Φ index, defined as Φ = (f - μ)√n / σ, is a standardized citation indicator that removes size bias from journal averages and normalizes across fields, yielding rankings that differ from traditional impact factors by elevating smaller and underrepresented journals.
What carries the argument
The Φ index, a z-score analogue for citation averages that scales the deviation from field mean by the square root of publication count divided by the field standard deviation.
If this is right
- Journal rankings change to correct size bias, elevating smaller journals and those in certain fields.
- The methodology applies to evaluating departments, universities, and countries.
- A Monte Carlo random sample test serves as a diagnostic for any citation indicator.
Where Pith is reading between the lines
- The index could be tested on article-level or researcher-level data to see if similar standardization applies.
- Similar size corrections might improve other bibliometric measures beyond journals.
- The Monte Carlo validation method could be adopted as a check for new citation indicators in general.
Load-bearing premise
Citation counts in each field have finite variance so that the central limit theorem applies to averages of n papers.
What would settle it
If applying the Φ index to the journal data does not produce rankings that reduce the observed size dependence in impact factors, or if the Monte Carlo test shows persistent bias.
Figures
read the original abstract
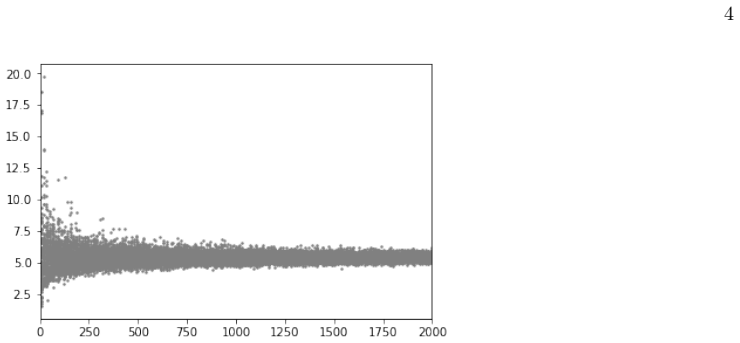
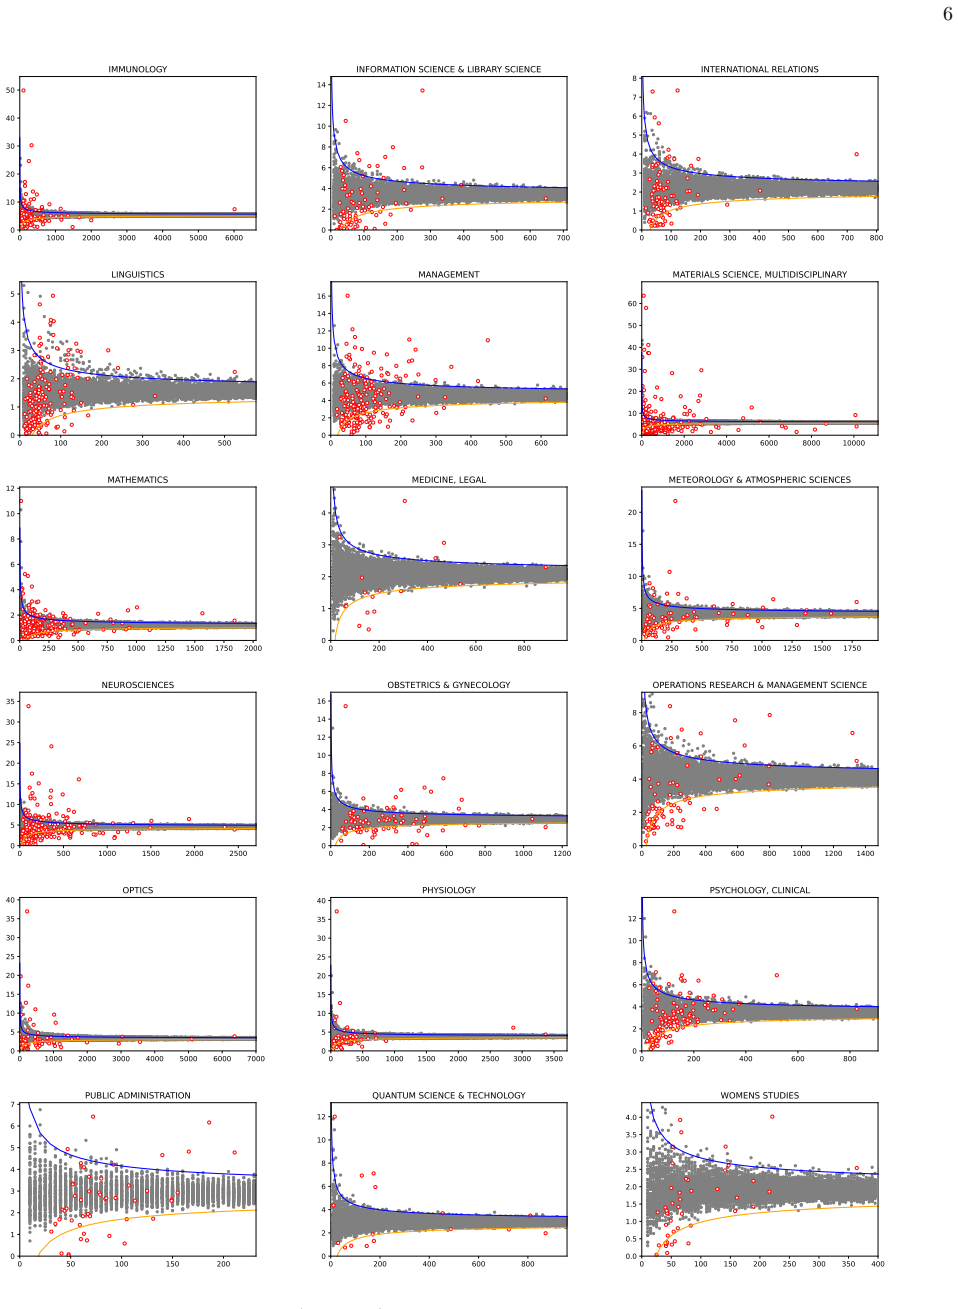
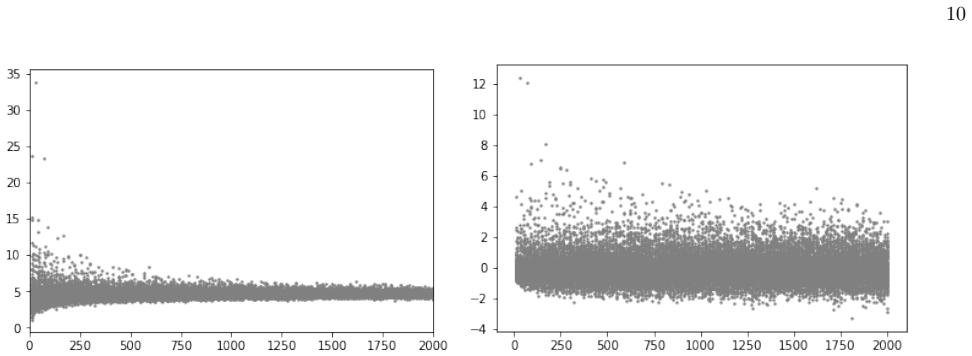
The Impact Factor (IF), despite its widespread use, suffers from well-known biases that remain incompletely addressed in practice -- most notably its sensitivity to journal size and its lack of field normalization. Because of size sensitivity, a randomly formed journal of $n$ papers can attain a range of IF values that decreases sharply with size, as $\sim 1/\sqrt{n}$. The Central Limit Theorem, which underlies this effect, also allows us to correct for it by standardizing citation averages for scale and field in a manner analogous to calculating the $z$-score in statistics. We thus introduce the $\Phi$ (Phi) index, defined as $\Phi = (f - \mu)\sqrt{n}/\sigma$, where $f$ is a journal's average citation count (akin to the IF), $n$ its publication count, and $\mu, \sigma$ the mean and standard deviation of citations in its field. Applying the $\Phi$ index to 12,173 journals in Clarivate's Journal Citation Reports, we obtain rankings that correct for size bias and elevate journals from underrepresented fields such as mathematics, law, and history. We validate the $\Phi$ index via a Monte Carlo random sample test, which we propose as a standard diagnostic for any citation indicator. The methodology extends readily to departments, universities, and countries.
Editorial analysis
A structured set of objections, weighed in public.
Referee Report
Summary. The paper claims that the Impact Factor suffers from size bias (with value ranges scaling as ~1/√n due to the Central Limit Theorem) and lacks field normalization. It introduces the Φ index defined as Φ = (f − μ)√n / σ, where f is a journal's average citations, n its paper count, and μ, σ the field mean and standard deviation of citations. The index is applied to 12,173 journals from Clarivate JCR to produce size-corrected and field-normalized rankings that elevate journals in fields such as mathematics, law, and history. Validation is performed via a proposed Monte Carlo random-sample diagnostic, with the method claimed to extend to other entities.
Significance. If the standardization is valid, the Φ index would provide a practical, parameter-free correction for size and field effects in journal evaluation, addressing longstanding criticisms of the IF. The explicit proposal of Monte Carlo validation as a standard diagnostic for citation indicators is a constructive methodological contribution that could be adopted more broadly.
major comments (2)
- [Abstract / derivation of Φ] Abstract and derivation of the scaling: the central claim that Φ removes size bias rests on the assertion that journal-mean fluctuations scale as 1/√n, which follows from the CLT only when the per-paper citation distribution within each field has finite variance. Citation counts are known to follow heavy-tailed distributions (power-law or log-normal with exponents often 2–3), for which the second moment is infinite or sample variance is unstable; in that regime the proper fluctuation scaling is slower than 1/√n and the z-score construction does not yield a size-independent statistic. The Monte Carlo validation performed under an empirical finite-σ distribution cannot detect this mismatch.
- [Application to JCR data] Application section (12,173 journals): the manuscript provides no explicit description of how fields are delimited, how journals with zero citations are treated when computing μ and σ, or whether the field statistics are computed over all papers or only journal-level aggregates. These choices directly affect the tail behavior and the resulting Φ values, yet are left unspecified in the abstract and appear only partially addressed in the full text.
minor comments (1)
- [Validation] The Monte Carlo diagnostic is presented as a general tool; a brief pseudocode or explicit description of the sampling procedure (e.g., how journals are randomly formed) would improve reproducibility.
Simulated Author's Rebuttal
We thank the referee for the thoughtful and constructive report. The comments highlight important methodological considerations regarding the applicability of the Central Limit Theorem and the need for explicit implementation details. We respond to each major comment below and indicate where revisions will be made.
read point-by-point responses
-
Referee: [Abstract / derivation of Φ] Abstract and derivation of the scaling: the central claim that Φ removes size bias rests on the assertion that journal-mean fluctuations scale as 1/√n, which follows from the CLT only when the per-paper citation distribution within each field has finite variance. Citation counts are known to follow heavy-tailed distributions (power-law or log-normal with exponents often 2–3), for which the second moment is infinite or sample variance is unstable; in that regime the proper fluctuation scaling is slower than 1/√n and the z-score construction does not yield a size-independent statistic. The Monte Carlo validation performed under an empirical finite-σ distribution cannot detect this mismatch.
Authors: We agree that citation distributions are frequently heavy-tailed and that for power-law tails with exponent α ≤ 2 the theoretical variance is infinite, implying that the 1/√n scaling of the CLT does not strictly hold. The Φ index, however, is defined empirically using the sample mean μ and standard deviation σ computed from the observed per-paper citation counts in each field. The Monte Carlo validation draws directly from these empirical distributions, thereby reflecting the actual tail behavior present in the JCR data rather than assuming a finite-variance model. While we acknowledge that this does not provide an asymptotic guarantee of size independence under infinite variance, the validation demonstrates that Φ values remain largely uncorrelated with journal size across the observed range. In the revised manuscript we will add an explicit discussion of this limitation, noting the empirical character of the standardization and the distinction between theoretical and practical performance. revision: partial
-
Referee: [Application to JCR data] Application section (12,173 journals): the manuscript provides no explicit description of how fields are delimited, how journals with zero citations are treated when computing μ and σ, or whether the field statistics are computed over all papers or only journal-level aggregates. These choices directly affect the tail behavior and the resulting Φ values, yet are left unspecified in the abstract and appear only partially addressed in the full text.
Authors: We appreciate the referee's request for greater transparency on these implementation choices. Fields are delimited using the primary Clarivate JCR subject categories to which each journal is assigned. All journals, including those with zero citations, are included when computing the field-level μ and σ. These statistics are calculated from the individual per-paper citation counts across every paper published in the field during the relevant window, not from journal-level aggregates. To ensure these details are fully explicit, we will expand the Methods section with dedicated paragraphs describing field assignment, treatment of zero-citation journals, and the precise level at which μ and σ are computed, together with a brief justification of each choice. revision: yes
Circularity Check
No circularity: Φ index is a direct standardization using external field statistics
full rationale
The paper defines Φ explicitly as Φ = (f − μ)√n / σ with μ and σ computed from the full field distribution (independent of any individual journal's fitted parameters). The 1/√n scaling is motivated by the CLT but is not obtained by fitting to the target journals or by reducing to a self-citation; the formula is constructed to implement the standardization rather than deriving a new result from the data it ranks. The Monte Carlo test is presented as a proposed diagnostic, not as part of the index derivation itself. No load-bearing step reduces the output to an input by construction.
Axiom & Free-Parameter Ledger
axioms (1)
- domain assumption Citation counts within each field have finite mean and variance so that the central limit theorem applies to journal averages.
Reference graph
Works this paper leans on
-
[1]
Adams, J., McVeigh, M., Pendlebury, D., & Szomszor, M. (2019). Profiles, not metrics. Available from:https://clarivate.com/webofsciencegroup/campaigns/profiles-not-metrics/
work page 2019
-
[2]
Amin, M., & Mabe, M. (2004). Impact factors: Use and abuse.International Journal of Environmental Science and Technology, 1,1–6
work page 2004
-
[3]
Antonoyiannakis, M., & Mitra, S. (2009). Editorial: Is PRL too large to have an ‘impact’? Physical Review Letters,102, 060001.https://doi.org/10.1103/PhysRevLett.102.060001
-
[4]
Antonoyiannakis, M. (2018). Impact Factors and the Central Limit Theorem: Why citation averages are scale dependent,Journal of Informetrics,12, 1072–1088.https://doi.org/10.1016/j.joi.2018.08.011
-
[5]
Antonoyiannakis, M. (2019). How a Single Paper Affects the Impact Factor: Implications for Scholarly Publishing,Proceedings of the 17th Conference of the International Society of Scientometrics and Informetrics, 26 vol. II,2306–2313. Available from:http://tinyurl.com/535s8sdn
work page 2019
-
[6]
Antonoyiannakis, M. (2020). Impact Factor volatility due to a single paper: A comprehensive analysis, Quantitative Science Studies,1, 639–663.https://direct.mit.edu/qss/article/1/2/639/96141
work page 2020
-
[7]
Antonoyiannakis, M. (2023). The journal Φ index and highly cited papers. APS March Meeting. Available from:https://ui.adsabs.harvard.edu/abs/2023APS..MARQ02004A/abstract
work page 2023
-
[8]
Antonoyiannakis, M. (2025). The Φ index and world university rankings. APS March Meeting. Available from:https://schedule.aps.org/smt/2025/events/MAR-C69/3
work page 2025
-
[9]
Campbell, P. (2008). Escape from the impact factor.Ethics in Science and Environmental Politics, 8, 5–7. https://doi.org/10.3354/esep00078 Clarivate. (2017). A Closer Look at the Eigenfactor TM Metrics. Available from: https://clarivate.com/academia-government/blog/closer-look-eigenfactor-metrics/ Clarivate. (2021). Introducing the Journal Citation Indica...
-
[11]
Gaind, N. (2018). Few UK universities have adopted rules against impact-factor abuse.Nature News. Available from:https://www.nature.com/articles/d41586-018-01874-w
work page 2018
-
[12]
Gingras, Y. (2016). Bibliometrics and Research Evaluation: Uses and Abuses (MIT Press)
work page 2016
-
[13]
Hicks, D., Wouters, P., Waltman, L., de Rijcke, S., & Rafols, I. (2015). Bibliometrics: The Leiden Manifesto for research metrics.Nature, 520, 429–431.https://doi.org/10.1038/520429a Journal Citation Reports, Clarivate Analytics. Available from:https://jcr.incites.thomsonreuters.com/ Larivi` ere, V., & Sugimoto, C. R. (2019). The Journal Impact Factor: A ...
-
[14]
Leydesdorff, L., Bornmann, L., and Adams, J. (2019). The integrated impact indicator revisited (I3*): A non-parametric alternative to the journal impact factor.Scientometrics, 119, 1669–1694. https://doi.org/10.1007/s11192-019-03099-8
-
[15]
MacRoberts, M.H., MacRoberts, B.R. Problems of citation analysis. (1996)Scientometrics 36, 435–444. https://doi.org/10.1007/BF02129604
-
[16]
Miranda, R., & Garcia-Carpintero, E. (2018). Overcitation and overrepresentation of review papers in the most cited papers,Journal of Informetrics, 12,1015–1030.https://doi.org/10.1016/j.joi.2018.08.006
- [17]
-
[18]
Moed, H. F. (2010). Measuring contextual citation impact of scientific journals,Journal of Informetrics, 4, 265–277, https://doi.org/10.1016/j.joi.2010.01.002
-
[19]
F., Colledge, L., Reedijk, J., Moya-Anegon, F., Guerrero-Bote, V., Plume, A., &Amin, M
Moed, H. F., Colledge, L., Reedijk, J., Moya-Anegon, F., Guerrero-Bote, V., Plume, A., &Amin, M. (2012). Citation-based metrics are appropriate tools in journal assessment provided that they are accurate and used in an informed way.Scientometrics,92, 367–376
work page 2012
-
[20]
Pulverer, B. (2013). Impact fact-or fiction?The EMBO Journal 32,1651–1652. https://doi.org/10.1038/emboj.2013.126
-
[21]
Rousseau, R. (2009). What does the Web of Science five-year synchronous impact factor have to offer?.Chinese Journal of Library and Information Science, 21–7. (2012). San Francisco Declaration on Research Assessment. Available from:https://sfdora.org/read/
work page 2009
-
[22]
Siler, K. & Larivi` ere, V. (2022). Who games metrics and rankings? Institutional niches and journal impact factor inflation.Research Policy 51, 104608.https://doi.org/10.1016/j.respol.2022.104608
-
[23]
Szomszor, M. (2021). Introducing the Journal Citation Indicator: A new, field-normalized measurement of journal citation impact. Available from:http://tinyurl.com/fzb4ut76
work page 2021
-
[24]
Spitzer, M., Wildenhain, J., Rappsilber, J., & Tyers, M. (2014). BoxPlotR: a web tool for generation of box plots. Nature Methods, 11, 121–122.https://doi.org/10.1038/nmeth.2811 Vˆ ıiu, GA., P˘ aunescu, M. The lack of meaningful boundary differences between journal impact factor quartiles undermines their independent use in research evaluation.Scientometr...
-
[25]
Waltman, L., van Eck, N. J., van Leeuwen, T. N., Visser, M. S. (2013). Some modifications to the SNIP journal impact indicator,Journal of Informetrics, 7, 272–285.https://doi.org/10.1016/j.joi.2012.11.011
-
[26]
Wouters, P., Sugimoto, C.R., Larivi` ere, V., McVeigh, M.E., Pulverer, B., de Rijcke, S., Waltman, L. (2019). Rethinking impact factors: better ways to judge a journal.Nature 569, 621-623. 27
work page 2019
discussion (0)
Sign in with ORCID, Apple, or X to comment. Anyone can read and Pith papers without signing in.