De-cluttering Scatterplots with Integral Images
Pith reviewed 2026-05-23 21:47 UTC · model grok-4.3
The pith
A mapping from integral images of point density transforms cluttered scatterplots into nearly uniform distributions while preserving neighborhood relations.
A machine-rendered reading of the paper's core claim, the machinery that carries it, and where it could break.
Core claim
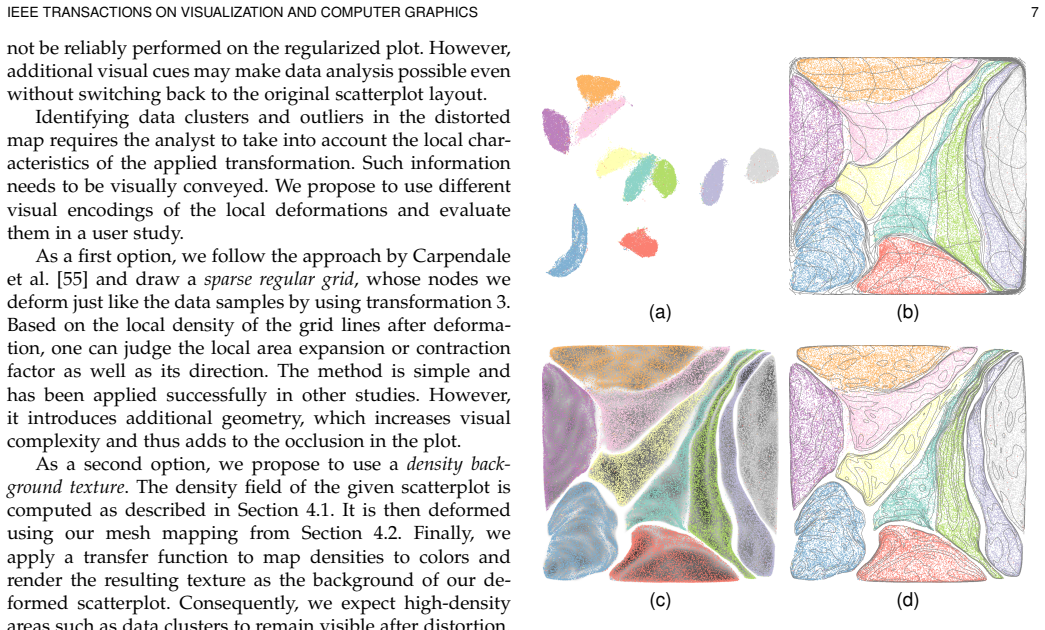
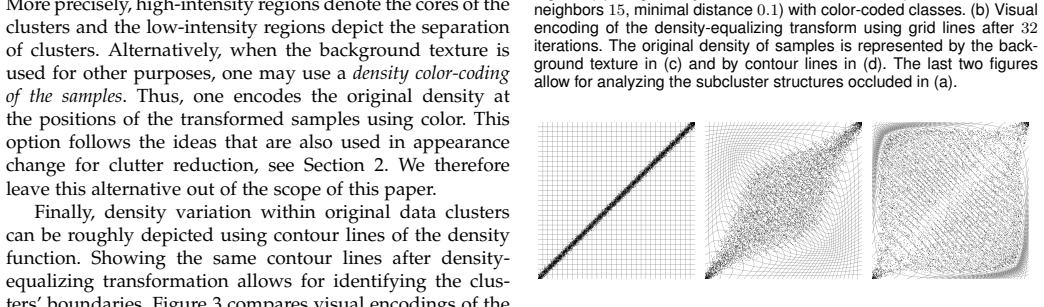
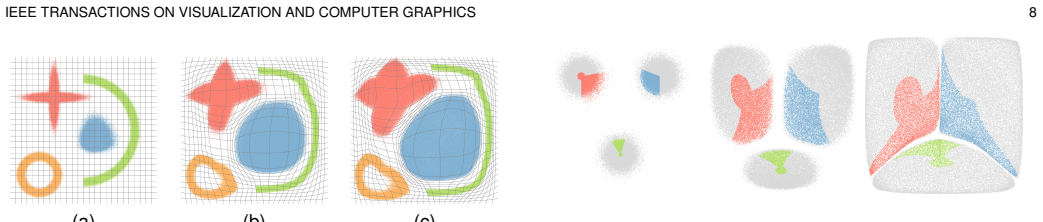
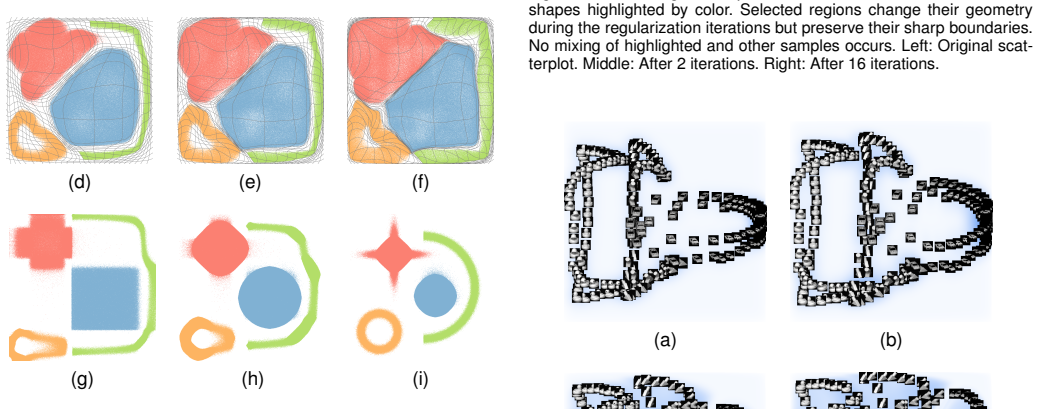
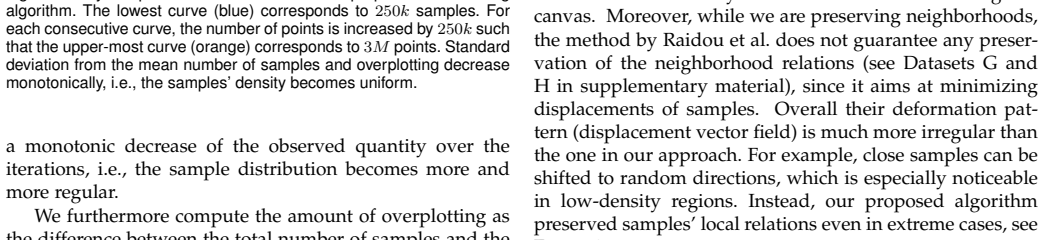
Our algorithm evaluates the scatterplot's density distribution to compute a regularization mapping based on integral images of the rasterized density function. The mapping preserves the samples' neighborhood relations. Few regularization iterations suffice to achieve a nearly uniform sample distribution that efficiently uses the available screen space.
What carries the argument
regularization mapping computed from integral images of the rasterized density function, which spreads points while keeping neighborhood order
If this is right
- Large scatterplots become readable because points occupy screen space more evenly.
- Local structures such as clusters and trends remain detectable after the transformation.
- The GPU implementation allows the method to run inside interactive visual analysis tools.
- Users can be shown the transformation itself through additional visual cues whose effectiveness can be tested.
Where Pith is reading between the lines
- The same integral-image approach might regularize other 2D layouts such as force-directed graphs or t-SNE embeddings.
- Because the mapping is built from cumulative sums, small changes in point density could be tracked over time for animated data.
- If the mapping proves invertible in practice, analysts could toggle between original and de-cluttered views without information loss.
Load-bearing premise
Rasterizing density on a fixed screen grid and integrating it produces a smooth invertible mapping that both removes overplotting and strictly preserves neighborhood relations for arbitrary point sets.
What would settle it
A point distribution where the resulting mapping either leaves visible overplotting or reverses the order of two originally neighboring points.
Figures
read the original abstract
Scatterplots provide a visual representation of bivariate data (or 2D embeddings of multivariate data) that allows for effective analyses of data dependencies, clusters, trends, and outliers. Unfortunately, classical scatterplots suffer from scalability issues, since growing data sizes eventually lead to overplotting and visual clutter on a screen with a fixed resolution, which hinders the data analysis process. We propose an algorithm that compensates for irregular sample distributions by a smooth transformation of the scatterplot's visual domain. Our algorithm evaluates the scatterplot's density distribution to compute a regularization mapping based on integral images of the rasterized density function. The mapping preserves the samples' neighborhood relations. Few regularization iterations suffice to achieve a nearly uniform sample distribution that efficiently uses the available screen space. We further propose approaches to visually convey the transformation that was applied to the scatterplot and compare them in a user study. We present a novel parallel algorithm for fast GPU-based integral-image computation, which allows for integrating our de-cluttering approach into interactive visual data analysis systems.
Editorial analysis
A structured set of objections, weighed in public.
Referee Report
Summary. The paper claims to introduce an algorithm that de-clutters scatterplots via a smooth regularization mapping derived from integral images of a rasterized density function; this mapping is asserted to preserve neighborhood relations, with few iterations yielding a nearly uniform distribution that uses screen space efficiently. It also presents a novel parallel GPU algorithm for integral-image computation to support interactive use and compares methods for visually conveying the applied transformation via a user study.
Significance. If the neighborhood-preservation property can be established, the approach would offer a practical, GPU-accelerated technique for handling overplotting in large bivariate visualizations while retaining local structure, which is relevant for interactive data analysis systems. The parallel integral-image algorithm is a concrete implementation contribution that could be reused beyond this application.
major comments (2)
- [Abstract] Abstract: the central claim that 'the mapping preserves the samples' neighborhood relations' is asserted without derivation, discretization-error analysis, or counter-example checks on how the integral-image summation of a fixed-grid rasterized density produces a bijective, non-crossing warp for arbitrary point distributions; this property is load-bearing for the method's correctness.
- [Abstract] Abstract: the statement that 'Few regularization iterations suffice to achieve a nearly uniform sample distribution' is presented without quantitative validation, convergence bounds, or empirical measurement of residual overplotting after each iteration, undermining assessment of the algorithm's practicality.
minor comments (1)
- The user study is mentioned but its design, participant count, tasks, and statistical analysis are not detailed in the abstract or high-level description, making it difficult to evaluate the strength of the comparison among transformation-visualization approaches.
Simulated Author's Rebuttal
We thank the referee for the constructive comments on our manuscript. We respond to each major comment below, clarifying the presentation in the abstract while noting supporting material in the body of the paper. Where appropriate, we indicate revisions to strengthen the claims.
read point-by-point responses
-
Referee: [Abstract] Abstract: the central claim that 'the mapping preserves the samples' neighborhood relations' is asserted without derivation, discretization-error analysis, or counter-example checks on how the integral-image summation of a fixed-grid rasterized density produces a bijective, non-crossing warp for arbitrary point distributions; this property is load-bearing for the method's correctness.
Authors: The abstract provides a concise summary of the method. The full manuscript derives the regularization mapping in Section 3 from the properties of integral images of the rasterized density, showing that the resulting warp is monotonic and thus preserves neighborhood relations and avoids crossings for the discrete case. We acknowledge that a more explicit statement of bijectivity and discretization considerations would strengthen the abstract. We will revise the abstract to reference the derivation in Section 3 and add a short empirical check on neighborhood preservation for representative distributions. revision: partial
-
Referee: [Abstract] Abstract: the statement that 'Few regularization iterations suffice to achieve a nearly uniform sample distribution' is presented without quantitative validation, convergence bounds, or empirical measurement of residual overplotting after each iteration, undermining assessment of the algorithm's practicality.
Authors: The claim in the abstract is based on the experimental results reported in Section 4, which include quantitative measurements of residual overplotting (via a density uniformity metric) after successive iterations across multiple datasets, demonstrating rapid convergence to near-uniform distributions. No theoretical convergence bounds are derived in the paper. To address the concern, we will revise the abstract to explicitly reference the empirical validation in Section 4. revision: partial
Circularity Check
No significant circularity; algorithmic construction is self-contained
full rationale
The paper describes a constructive algorithm that rasterizes a density function, computes integral images, and derives a regularization mapping from them. The neighborhood-preservation property is asserted as a consequence of the integral-image construction rather than being fitted to data or defined circularly in terms of itself. No self-citation chains, ansatzes smuggled via prior work, or renamings of known results appear in the provided text. The derivation chain consists of explicit algorithmic steps whose outputs are not forced by re-labeling their inputs, satisfying the criteria for a non-circular, self-contained method.
Axiom & Free-Parameter Ledger
Lean theorems connected to this paper
-
IndisputableMonolith/Cost/FunctionalEquation.leanwashburn_uniqueness_aczel unclear?
unclearRelation between the paper passage and the cited Recognition theorem.
Our algorithm evaluates the scatterplot's density distribution to compute a regularization mapping based on integral images of the rasterized density function. The mapping preserves the samples' neighborhood relations.
-
IndisputableMonolith/Foundation/AlexanderDuality.leanalexander_duality_circle_linking unclear?
unclearRelation between the paper passage and the cited Recognition theorem.
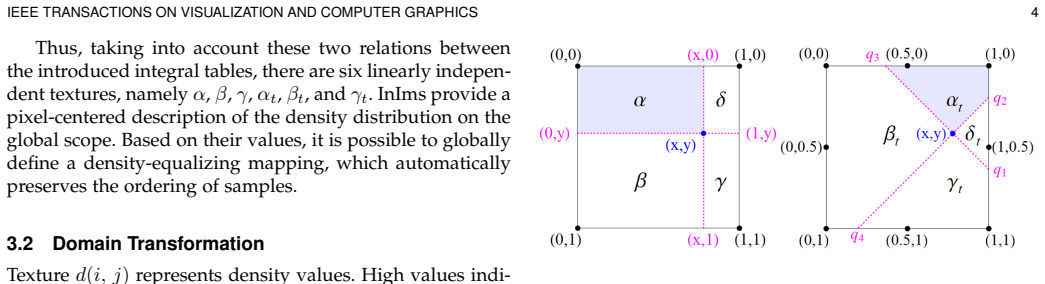
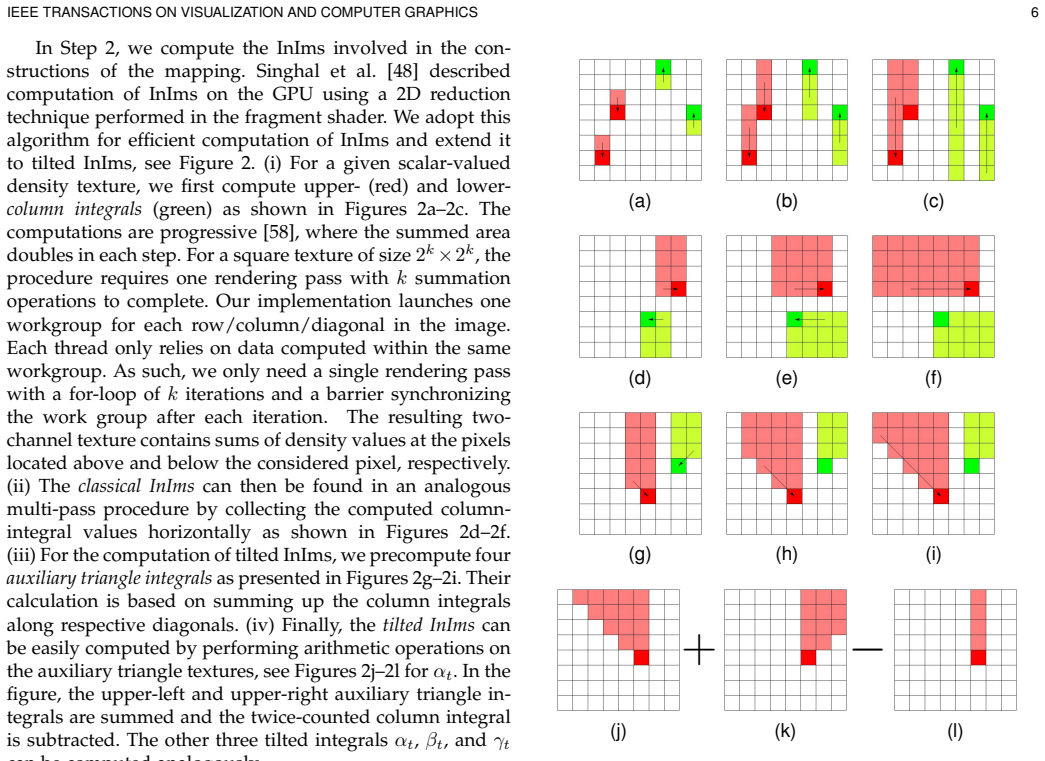
the deformation map computation is based on summed-area tables or integral images (InIms)
What do these tags mean?
- matches
- The paper's claim is directly supported by a theorem in the formal canon.
- supports
- The theorem supports part of the paper's argument, but the paper may add assumptions or extra steps.
- extends
- The paper goes beyond the formal theorem; the theorem is a base layer rather than the whole result.
- uses
- The paper appears to rely on the theorem as machinery.
- contradicts
- The paper's claim conflicts with a theorem or certificate in the canon.
- unclear
- Pith found a possible connection, but the passage is too broad, indirect, or ambiguous to say the theorem truly supports the claim.
Reference graph
Works this paper leans on
-
[1]
Visual analysis of image collections,
D. Eler, M. Nakazaki, F. Paulovich, D. Santos, G. Andery, M. C. Oliveira, J. a. Neto, and R. Minghim, “Visual analysis of image collections,” The Visual Computer, vol. 25, pp. 923–937, 10 2009
work page 2009
-
[2]
Towards perceptual optimization of the visual design of scatterplots,
L. Micallef, G. Palmas, A. Oulasvirta, and T. Weinkauf, “Towards perceptual optimization of the visual design of scatterplots,” IEEE Transactions on Visualization and Computer Graphics , vol. 23, no. 6, pp. 1588–1599, June 2017
work page 2017
-
[3]
By chance enhancing interaction with large data sets through statistical sampling,
A. Dix and G. Ellis, “By chance enhancing interaction with large data sets through statistical sampling,” in Proceedings of the Working Conference on Advanced Visual Interfaces , ser. AVI ’02. New York, NY, USA: Association for Computing Machinery, 2002, pp. 167—-176. [Online]. Available: https: //doi.org/10.1145/1556262.1556289
-
[4]
Data sampling in multi-view and multi-class scatterplots via set cover optimization,
R. Hu, T. Sha, O. Van Kaick, O. Deussen, and H. Huang, “Data sampling in multi-view and multi-class scatterplots via set cover optimization,” IEEE Transactions on Visualization and Computer Graphics, vol. 26, no. 1, pp. 739–748, 2020
work page 2020
-
[5]
Evaluation of sampling methods for scatterplots,
J. Yuan, S. Xiang, J. Xia, L. Yu, and S. Liu, “Evaluation of sampling methods for scatterplots,” IEEE Transactions on Visualization and Computer Graphics, vol. 27, no. 2, pp. 1720–1730, 2021
work page 2021
-
[6]
Toward a deeper understanding of the role of interaction in information visual- ization,
J. S. Yi, Y. a. Kang, J. Stasko, and J. A. Jacko, “Toward a deeper understanding of the role of interaction in information visual- ization,” IEEE Transactions on Visualization and Computer Graphics , vol. 13, no. 6, pp. 1224–1231, 2007
work page 2007
-
[7]
Smooth map deformation using integral images,
V . Molchanov and L. Linsen, “Smooth map deformation using integral images,” Journal of WSCG, vol. 28, no. 1–2, pp. 18–26, July 2020
work page 2020
-
[8]
The early origins and development of the scatterplot,
M. Friendly and D. Denis, “The early origins and development of the scatterplot,” Journal of the History of the Behavioral Sciences , vol. 41, pp. 103–130, Feb 2005
work page 2005
-
[9]
I. T. Jolliffe, Pincipal Component Analysis. Springer-Verlag, 1986
work page 1986
-
[10]
E. Kandogan, “Star coordinates: A multi-dimensional visualiza- tion technique with uniform treatment of dimensions,” in Proceed- ings of IEEE Information Visualization Symposium, 2000, pp. 4–8
work page 2000
-
[11]
Visualizing multi-dimensional clusters, trends, and outliers using star coordinates,
——, “Visualizing multi-dimensional clusters, trends, and outliers using star coordinates,” in Proceedings of the Seventh ACM SIGKDD International Conference on Knowledge Discovery and Data Mining , ser. KDD ’01. New York, NY, USA: ACM, 2001, pp. 107–116. [Online]. Available: http://doi.acm.org/10.1145/502512.502530
-
[12]
Multidimensional scaling by optimizing goodness of fit to a nonmetric hypothesis,
J. Kruskal, “Multidimensional scaling by optimizing goodness of fit to a nonmetric hypothesis,” Psychometrika, vol. 29, no. 1, pp. 1–27, 1964
work page 1964
-
[13]
J. B. Kruskal and M. Wish, Multidimensional scaling. Beverely Hills, California: Sage Publications, 1978
work page 1978
-
[14]
Visualizing high- dimensional data using t-SNE,
L. van der Maaten and G. E. Hinton, “Visualizing high- dimensional data using t-SNE,” Journal of Machine Learning Re- search, vol. 9, pp. 2579–2605, 2008
work page 2008
-
[15]
L. McInnes, J. Healy, N. Saul, and L. Großberger, “UMAP: Uniform Manifold Approximation and Projection,” Journal of Open Source Software , vol. 3, no. 29, p. 861, 2018. [Online]. Available: https://doi.org/10.21105/joss.00861
-
[16]
Empirical guidance on scatterplot and dimension reduction technique choices,
M. Sedlmair, T. Munzner, and M. Tory, “Empirical guidance on scatterplot and dimension reduction technique choices,” IEEE Transactions on Visualization and Computer Graphics, vol. 19, no. 12, pp. 2634–2643, Dec 2013
work page 2013
-
[17]
Flow-based scatterplots for sensitivity analysis,
Y.-H. Chan, C. D. Correa, and K.-L. Ma, “Flow-based scatterplots for sensitivity analysis,” 2010 IEEE Symposium on Visual Analytics Science and Technology, pp. 43–50, Oct 2010
work page 2010
-
[18]
Enhancing scatter plots using ellipsoid pixel placement and shading,
H. Janetzko, M. C. Hao, S. Mittelstadt, U. Dayal, and D. Keim, “Enhancing scatter plots using ellipsoid pixel placement and shading,” in 2014 47th Hawaii International Conference on System Sciences . Los Alamitos, CA, USA: IEEE Computer Society, Jan 2013, pp. 1522–1531. [Online]. Available: https://doi.ieeecomputersociety.org/10.1109/HICSS.2013.197
-
[19]
Enhancing scatterplots with multi-dimensional focal blur,
J. Staib, S. Grottel, and S. Gumhold, “Enhancing scatterplots with multi-dimensional focal blur,” Computer Graphics Forum , vol. 35, no. 3, pp. 11–20, 2016. [Online]. Available: https: //onlinelibrary.wiley.com/doi/abs/10.1111/cgf.12877
-
[20]
Scatterplots: Tasks, data, and de- signs,
A. Sarikaya and M. Gleicher, “Scatterplots: Tasks, data, and de- signs,” IEEE Transactions on Visualization and Computer Graphics , vol. 24, no. 1, pp. 402–412, Jan 2018
work page 2018
-
[21]
A taxonomy of clutter reduction for informa- tion visualisation,
G. Ellis and A. Dix, “A taxonomy of clutter reduction for informa- tion visualisation,” IEEE Transactions on Visualization and Computer Graphics, vol. 13, no. 6, pp. 1216–1223, Nov 2007
work page 2007
-
[22]
Matching visual saliency to confidence in plots of uncertain data,
D. Feng, L. Kwock, Y. Lee, and R. Taylor, “Matching visual saliency to confidence in plots of uncertain data,” IEEE Transactions on Visualization and Computer Graphics , vol. 16, no. 6, pp. 980–989, 2010
work page 2010
-
[23]
Using animation to alleviate overdraw in multiclass scatterplot matrices,
H. Chen, S. Engle, A. Joshi, E. D. Ragan, B. F. Yuksel, and L. Harrison, “Using animation to alleviate overdraw in multiclass scatterplot matrices,” in Proceedings of the 2018 CHI Conference on Human Factors in Computing Systems , ser. CHI ’18. New York, NY, USA: Association for Computing Machinery, 2018, pp. 1––12. [Online]. Available: https://doi.org/10...
-
[24]
J. Li, J.-B. Martens, and J. J. van Wijk, “A model of symbol size discrimination in scatterplots,” in Proceedings of the SIGCHI Conference on Human Factors in Computing Systems, ser. CHI ’10. New York, NY, USA: Association for Computing Machinery, 2010, pp. 2553—-2562. [Online]. Available: https://doi.org/10.1145/1753326.1753714
-
[25]
Dynamic opacity optimization for scatter plots,
J. Matejka, F. Anderson, and G. Fitzmaurice, “Dynamic opacity optimization for scatter plots,” in Proceedings of the 33rd Annual ACM Conference on Human Factors in Computing Systems, ser. CHI ’15. New York, NY, USA: Association for Computing Machinery, 2015, pp. 2707––2710. [Online]. Available: https://doi.org/10.1145/2702123.2702585
-
[26]
Reducing InfoVis cluttering through non uniform sampling, displacement, and user perception,
E. Bertini, L. Dell’Aquila, and G. Santucci, “Reducing InfoVis cluttering through non uniform sampling, displacement, and user perception,” in Visualization and Data Analysis 2006 – Proceedings of SPIE-IS and Electronic Imaging, vol. 6060, 2006
work page 2006
-
[27]
Splatterplots: Overcoming over- draw in scatter plots,
A. Mayorga and M. Gleicher, “Splatterplots: Overcoming over- draw in scatter plots,” IEEE Transactions on Visualization and Com- puter Graphics, vol. 19, no. 9, pp. 1526–1538, Sep 2013
work page 2013
-
[28]
Variable binned scatter plots,
M. C. Hao, U. Dayal, R. K. Sharma, D. Keim, and H. Janetzko, “Variable binned scatter plots,” Information Visualization , vol. 9, no. 3, pp. 194–203, 2010
work page 2010
-
[29]
F. V . Paulovich and R. Minghim, “HiPP: A novel hierarchical point placement strategy and its application to the exploration of document collections,” IEEE Transactions on Visualization and Computer Graphics, vol. 14, no. 6, pp. 1229–1236, Nov 2008
work page 2008
-
[30]
A review and taxonomy of distortion-oriented presentation techniques,
Y. K. Leung and M. D. Apperley, “A review and taxonomy of distortion-oriented presentation techniques,” ACM Transactions on Computer-Human Interaction, vol. 1, no. 2, pp. 126––160, Jun. 1994. [Online]. Available: https://doi.org/10.1145/180171.180173
-
[31]
Stretching the rubber sheet: A metaphor for viewing large layouts on small screens,
M. Sarkar, S. S. Snibbe, O. J. Tversky, and S. P . Reiss, “Stretching the rubber sheet: A metaphor for viewing large layouts on small screens,” in Proceedings of the 6th Annual ACM Symposium on User Interface Software and Technology , ser. UIST ’93. New York, NY, IEEE TRANSACTIONS ON VISUALIZATION AND COMPUTER GRAPHICS 13 USA: Association for Computing Ma...
-
[32]
D. A. Keim, M. C. Hao, U. Dayal, H. Janetzko, and P . Bak, “Generalized scatter plots,” Information Visualization , vol. 9, no. 4, pp. 301–311, 2010. [Online]. Available: https: //doi.org/10.1057/ivs.2009.34
-
[33]
His- toScale: An efficient approach for computing pseudo-cartograms,
D. A. Keim, C. Panse, M. Sch ¨afer, M. Sips, and S. C. North, “His- toScale: An efficient approach for computing pseudo-cartograms,” in 14th IEEE Visualization 2003 (VIS 2003). Piscataway, N.J: IEEE, 2003
work page 2003
-
[34]
Relaxing dense scatter plots with pixel-based mappings,
R. G. Raidou, M. E. Gr ¨oller, and M. Eisemann, “Relaxing dense scatter plots with pixel-based mappings,” IEEE Transactions on Visualization and Computer Graphics , vol. 25, no. 6, pp. 2205–2216, June 2019
work page 2019
-
[35]
2.5d dust & magnet visualization for large multivariate data,
J. O. Vollmer and J. D ¨ollner, “2.5d dust & magnet visualization for large multivariate data,” in Proceedings of the 13th International Symposium on Visual Information Communication and Interaction , ser. VINCI ’20. New York, NY, USA: Association for Computing Machinery, 2020. [Online]. Available: https://doi.org/10.1145/3430036.3430045
-
[36]
Hagrid —- gridify scatterplots with Hilbert and Gosper curves,
R. Cutura, C. Morariu, Z. Cheng, Y. Wang, D. Weiskopf, and M. Sedlmair, “Hagrid —- gridify scatterplots with Hilbert and Gosper curves,” in Proceedings of the 14th International Symposium on Visual Information Communication and Interaction, ser. VINCI ’21. New York, NY, USA: Association for Computing Machinery, 2021. [Online]. Available: https://doi.org/1...
-
[37]
Hagrid: using Hilbert and Gosper curves to gridify scatter- plots,
——, “Hagrid: using Hilbert and Gosper curves to gridify scatter- plots,” Journal of Visualization, vol. 25, pp. 1291––1307, 2022
work page 2022
-
[38]
A grid-based method for removing overlaps of dimensionality reduction scatterplot layouts,
G. M. Hilasaca, W. E. Marc ´ılio-Jr, D. M. Eler, R. M. Martins, and F. V . Paulovich, “A grid-based method for removing overlaps of dimensionality reduction scatterplot layouts,” IEEE Transactions on Visualization and Computer Graphics, pp. 1–14, 2023
work page 2023
-
[39]
CorrelatedMultiples: Spatially coherent small multiples with constrained multi- dimensional scaling,
X. Liu, Y. Hu, S. North, and H.-W. Shen, “CorrelatedMultiples: Spatially coherent small multiples with constrained multi- dimensional scaling,” Computer Graphics Forum, vol. 37, no. 1, pp. 7–18, 2018. [Online]. Available: https://onlinelibrary.wiley.com/ doi/abs/10.1111/cgf.12526
-
[40]
G. W. Furnas, “Generalized fisheye views,” in Proceedings of the SIGCHI Conference on Human Factors in Computing Systems, ser. CHI ’86. New York, NY, USA: Association for Computing Machinery, Apr 1986, pp. 16––23
work page 1986
-
[41]
JellyLens: Content-aware adaptive lenses,
C. Pindat, E. Pietriga, O. Chapuis, and C. Puech, “JellyLens: Content-aware adaptive lenses,” in Proceedings of the 25th Annual ACM Symposium on User Interface Software and Technology . New York, NY, USA: Association for Computing Machinery, 2012, pp. 261–270. [Online]. Available: https://doi.org/10.1145/2380116. 2380150
-
[42]
The sampling lens: Making sense of saturated visualisations,
G. Ellis, E. Bertini, and A. Dix, “The sampling lens: Making sense of saturated visualisations,” inCHI’05 Extended Abstracts on Human Factors in Computing Systems, CHI EA’05, 2005, pp. 1351–1354
work page 2005
-
[43]
G. Ellis and A. Dix, “The plot, the clutter, the sampling and its lens: Occlusion measures for automatic clutter reduction,” in Proceedings of the Working Conference on Advanced Visual Interfaces, ser. AVI ’06. New York, NY, USA: Association for Computing Machinery, 2006, pp. 266––269. [Online]. Available: https://doi.org/10.1145/1133265.1133318
-
[44]
Interactive lenses for visualization: An extended survey,
C. Tominski, S. Gladisch, U. Kister, R. Dachselt, and H. Schumann, “Interactive lenses for visualization: An extended survey,” Com- puter Graphics Forum, vol. 36, no. 6, pp. 173–200, Sep 2017
work page 2017
-
[45]
Summed-area tables for texture mapping,
F. C. Crow, “Summed-area tables for texture mapping,” in Pro- ceedings of the 11th Annual Conference on Computer Graphics and Interactive Techniques . New York, NY, USA: Association for Computing Machinery, 1984, pp. 207–212
work page 1984
-
[46]
Robust real-time object detection,
P . Viola and M. Jones, “Robust real-time object detection,” Interna- tional Journal of Computer Vision, vol. 57, no. 2, pp. 137–154, 2002
work page 2002
-
[47]
S. Ehsan, A. F. Clark, N. ur Rehman, and K. D. McDonald- Maier, “Integral images: Efficient algorithms for their computation and storage in resource-constrained embedded vision systems,” Sensors (Basel), vol. 15, no. 7, pp. 16 804–16 830, Jul 2015
work page 2015
-
[48]
Implementation and optimization of image processing algorithms on embedded GPU,
N. Singhal, J. W. Yoo, H. Y. Choi, and I. K. Park, “Implementation and optimization of image processing algorithms on embedded GPU,” IEICE Transactions on Information and Systems , vol. E95.D, no. 5, pp. 1475–1484, 2012
work page 2012
-
[49]
G. Bradski, “The opencv library.” Dr. Dobb’s Journal: Software Tools for the Professional Programmer, vol. 25, no. 11, pp. 120–123, 2000
work page 2000
-
[50]
Parameterized splitting of summed volume tables,
C. Reinbold and R. Westermann, “Parameterized splitting of summed volume tables,” Computer Graphics Forum , vol. 40, no. 3, pp. 123–133, 2021
work page 2021
-
[51]
An extended set of Haar-like features for rapid object detection,
R. Lienhart and J. Maydt, “An extended set of Haar-like features for rapid object detection,” in Proceedings. International Conference on Image Processing, vol. 1, Sep 2002, pp. 900–903
work page 2002
-
[52]
Empirical analysis of detection cascades of boosted classifiers for rapid object detec- tion,
R. Lienhart, A. Kuranov, and V . Pisarevsky, “Empirical analysis of detection cascades of boosted classifiers for rapid object detec- tion,” in Pattern Recognition, B. Michaelis and G. Krell, Eds., vol
-
[53]
Berlin, Heidelberg: Springer Berlin Heidelberg, 2003, pp. 297–304
work page 2003
-
[54]
Real-time computation of Haar-like features at generic angles for detection algorithms,
A. L. C. Barczak, M. J. Johnson, and C. H. Messom, “Real-time computation of Haar-like features at generic angles for detection algorithms,” Research Letters in the Information and Mathematical Sciences, vol. 9, pp. 98–111, 2006
work page 2006
-
[55]
Exact integral images at generic angles for 2D barcode detection,
Tat-Jun Chin, Hanlin Goh, and Ngan-Meng Tan, “Exact integral images at generic angles for 2D barcode detection,” in 2008 19th International Conference on Pattern Recognition, Dec 2008, pp. 1–4
work page 2008
-
[56]
3-dimensional pliable surfaces: For the effective presentation of visual information,
M. S. T. Carpendale, D. J. Cowperthwaite, and F. D. Fracchia, “3-dimensional pliable surfaces: For the effective presentation of visual information,” in Proceedings of the 8th Annual ACM Symposium on User Interface and Software Technology, ser. UIST ’95. New York, NY, USA: Association for Computing Machinery, 1995, pp. 217—-226. [Online]. Available: https...
-
[57]
S. Bachthaler and D. Weiskopf, “Continuous scatterplots,” IEEE Transactions on Visualization and Computer Graphics (Proceedings Visualization / Information Visualization 2008) , vol. 14, no. 6, pp. 1428–1435, December 2008
work page 2008
-
[58]
Frequency-based pro- gressive rendering of continuous scatterplots,
V . Molchanov, A. Fofonov, and L. Linsen, “Frequency-based pro- gressive rendering of continuous scatterplots,” Journal of WSCG , vol. 21, no. 1, pp. 49–58, July 2013
work page 2013
-
[59]
Progressive visual analytics: User-driven visual exploration of in-progress analytics,
C. D. Stolper, A. Perer, and D. Gotz, “Progressive visual analytics: User-driven visual exploration of in-progress analytics,” IEEE Transactions on Visualization and Computer Graphics, vol. 20, no. 12, pp. 1653–1662, 2014
work page 2014
-
[60]
Gradient-based learning applied to document recognition,
Y. Lecun, L. Bottou, Y. Bengio, and P . Haffner, “Gradient-based learning applied to document recognition,” Proceedings of the IEEE, vol. 86, no. 11, pp. 2278–2324, 1998
work page 1998
-
[61]
Columbia Object Image Library (COIL-100),
S. A. Nene, S. K. Nayar, and H. Murase, “Columbia Object Image Library (COIL-100),” Tech. Rep., February
-
[62]
Available: http://www1.cs.columbia.edu/CAVE/ software/softlib/coil-100.php
[Online]. Available: http://www1.cs.columbia.edu/CAVE/ software/softlib/coil-100.php
-
[63]
Neighborhood preservation in nonlinear projection methods: An experimental study,
J. Venna and S. Kaski, “Neighborhood preservation in nonlinear projection methods: An experimental study,” in Artificial Neural Networks—ICANN 2001 , G. Dorffner, H. Bischof, and K. Hornik, Eds. Berlin: Springer, 2001, pp. 485–491
work page 2001
-
[64]
Layout adjustment and the mental map,
K. Misue, P . Eades, W. Lai, and K. Sugiyama, “Layout adjustment and the mental map,” Journal of Visual Languages & Computing , vol. 6, no. 2, pp. 183–210, June 1995. [Online]. Available: https://api.semanticscholar.org/CorpusID:611807
work page 1995
-
[65]
UCI Machine Learning Repository,
D. Dua and C. Graff, “UCI Machine Learning Repository,” 2019. [Online]. Available: http://archive.ics.uci.edu/ml
work page 2019
-
[66]
Cohen, Statistical power analysis for the behavioral sciences
J. Cohen, Statistical power analysis for the behavioral sciences . Aca- demic press, 2013. Hennes Rave is a doctoral researcher in the Visualization and Graphics (VISIX) group at the University of M¨unster, Germany, where he received his Master’s degree in Computer Science in 2021. His research inter- ests include interactive visualization, spectral image...
work page 2013
discussion (0)
Sign in with ORCID, Apple, or X to comment. Anyone can read and Pith papers without signing in.