REVIEW 3 major objections 5 minor 1 cited by
Automated Market Making: the case of Pegged Assets
T0 review · 3 major / 5 minor · reviewed 2026-08-12 · deepseek-v4-flash
Pith's one-line read A two-layer mean-reverting price model lets an automated market maker quote better prices for pegged cryptoassets than a Brownian-motion model does.
desk verdict A clean modeling-and-control framework for pegged-asset AMMs, whose headline outperformance claim is only as strong as an uncalibrated simulated order flow. read the letter →
The pith
A machine-rendered reading of the paper's core claim, the machinery that carries it, and where it could break.
The reading
What carries the argument
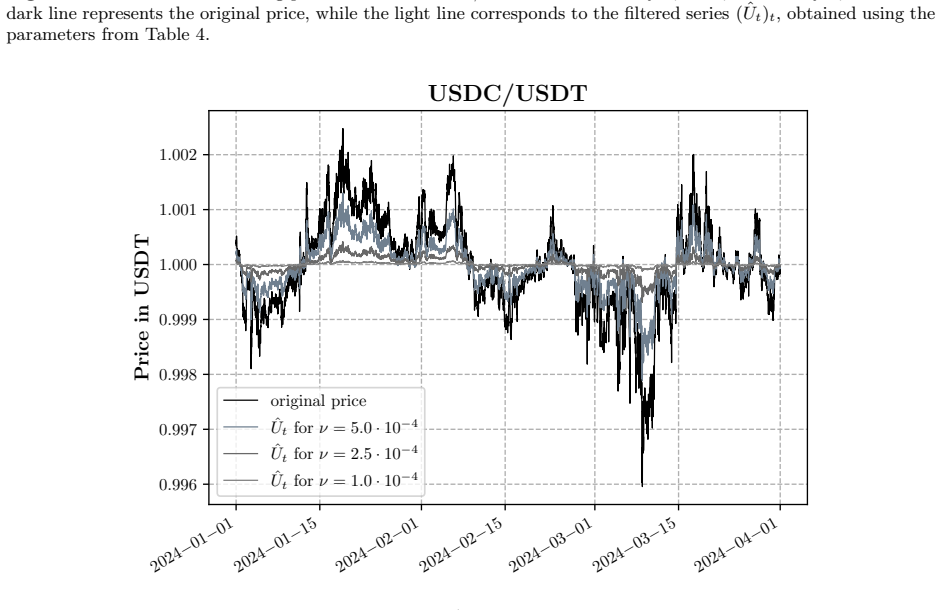
The central object is the multi-level nested Ornstein-Uhlenbeck process, defined by $dS_t = -\kappa(S_t-U_t)\,dt + \sigma\,dW^S_t$ and $dU_t = -\eta(U_t-\bar U)\,dt + \nu\,dW^U_t$ with $\kappa>\eta>0$: the observed exchange rate pulls toward a hidden target, and the hidden target pulls toward the peg. Two pieces of machinery make this usable for market making. First, a stochastic filtering step turns the unobservable $U$ into an observable filtered state $\hat U_t$ satisfying a diffusion driven by the innovations of $S$, with the conditional variance following a deterministic Riccati ODE. Second, the Hamilton-Jacobi-Bellman equation for the exponential-utility control problem is approximated through quadratic Hamiltonians, so the value function is a quadratic polynomial in inventory, $S$, and $\hat U$, and the optimal markups are obtained from the solution of a small system of Riccati ODEs for time-dependent coefficients.
What would settle it
Rerun the NOU-versus-GBM comparison on the same real price series, but replace the assumed logistic arrival intensities and fixed trade sizes with intensities and a size distribution estimated from actual transaction data on a USDC/USDT pool. If the NOU AMM no longer dominates on average excess P&L at comparable standard deviations, the paper's performance claim is an artifact of the assumed flow rather than of the nested OU price model.
Extended reading notes
Core claim
The central claim is that exchange-rate dynamics for pegged cryptoassets should be modeled not by a single Ornstein-Uhlenbeck process nor by geometric Brownian motion, but by a multi-level nested Ornstein-Uhlenbeck system: the observed exchange rate $S_t$ mean-reverts to an unobservable process $U_t$, and $U_t$ itself mean-reverts to a fixed long-run value $\bar U$. The paper derives the Gaussian structure, the maximum-likelihood estimator for the parameters, and a stochastic filter that produces the conditional estimate $\hat U_t = \mathbb{E}[U_t \mid \mathcal F^S_t]$. On top of this it solves a stochastic control problem for an AMM that quotes bid and ask prices in terms of observable quantities only, and it approximates the solution with a quadratic-Hamiltonian method that reduces the optimal quotes to numerically tractable Riccati equations. Tested on simulated prices and on real USDC/USDT and wstETH/WETH prices, the resulting AMM (the paper's NOU AMM) is claimed to outperform the GBM AMM from the authors' earlier work in the mean-standard-deviation plane; for the wstETH/WETH pair the paper states the NOU AMM 'achieves levels of average excess P&L that outperform those of the GBM AMM by far.'
Load-bearing premise
The performance comparison rests on an assumed trade-flow model—trades arrive with logistic intensities $\lambda=250\,\mathrm{day}^{-1}$, $a=0$, $b=10{,}000\,\mathrm{USDT}^{-1}$ (or $\mathrm{WETH}^{-1}$) and fixed trade sizes—none of which are calibrated to real order flow; if real liquidity takers respond to markups differently, the reported excess P&L gap may be misleading.
Editorial extensions
If this is right
- The optimal AMM quotes depend only on observable quantities: the pool's inventory position, the external exchange rate, and the filtered estimate of the hidden mean-reversion target.
- The quadratic-Hamiltonian approximation reduces a four-dimensional HJB equation to low-dimensional ODEs, so the quoting policy can be computed quickly enough for practical use and has an explicit ergodic limit when the horizon is long.
- For the wstETH/WETH pair, where mean reversion is fast, the NOU AMM's average excess P&L per unit of standard deviation is far above the GBM AMM frontier, because geometric Brownian motion is misspecified even on the short time scale of inventory round trips.
- For USDC/USDT, both strategies perform respectably, but the NOU AMM dominates the GBM AMM in the mean-standard-deviation plane on simulated prices and on real prices.
- The same framework applies to a non-rebasing liquid staking token relative to its native token after discounting the price series by an estimated constant staking yield.
Reading between the lines
- Strictly beyond the paper: the parameter $\nu$ sets a trust-in-peg dial—small $\nu$ keeps the hidden target near $\bar U$, large $\nu$ lets the target chase the price; this could be stress-tested by simulating a sharp de-peg followed by re-pegging and watching how the filtered quotes widen and recover.
- Strictly beyond the paper: because the quote rule only needs an observable price series, the same control machinery should transfer to any asset pair with an anchor, such as an ETF against its net asset value or an on-chain wrapped token against its underlying, provided the two-level OU assumption fits.
- Strictly beyond the paper: the simulations use an external indicative price as the mid-price, so in a live deployment the AMM would inherit oracle risk (lag, manipulation, or stale feeds); the paper does not quantify that risk.
- Strictly beyond the paper: the trade-flow model is assumed rather than estimated, so the most direct test of the performance claim is to fit the logistic arrival intensities and trade-size distribution to actual pool or centralized-exchange transaction data and rerun the NOU-vs-GBM comparison.
Editorial analysis
A structured set of objections, weighed in public.
Referee Report
Summary. The paper proposes a multi-level nested Ornstein-Uhlenbeck model for the exchange rate of pegged crypto-assets such as stablecoin pairs and liquid-staking-token pairs. It derives the Gaussian law and covariance of the observed price, develops a maximum-likelihood calibration procedure and a Kalman-filter-type estimator for the unobserved mean-reversion target, and then embeds the filtered dynamics in a CARA expected-utility market-making problem. The HJB equation is approximated via a quadratic Hamiltonian, leading to a Riccati system for the value-function coefficients and closed-form approximate markups. The resulting NOU AMM is compared numerically with the GBM AMM of the authors' earlier work on simulated prices and on historical Pyth price paths for USDC/USDT and wstETH/WETH.
Significance. The theoretical core is a useful and mostly self-contained contribution: the covariance formula, the filtering equations, and the quadratic-Hamiltonian reduction to Riccati ODEs are carefully derived and go beyond the standard one-factor OU market-making setup. The paper also explicitly addresses a real gap, namely AMM design for stationary, mean-reverting pegged-asset pairs rather than geometric-Brownian-motion pairs. If the empirical claims were supported, the framework would be of practical value for stablecoin and liquid-staking-token pools. However, the numerical validation is currently conditional on an uncalibrated synthetic order-flow model, and the attribution of the performance to the multi-level nested structure is not established.
major comments (3)
- [Section 4.4, Eq. (3) and Eq. (10)] The central outperformance claim is evaluated under an uncalibrated synthetic order-flow model. The marked point process intensities are fixed as lambda_{0,1}=lambda_{1,0}=250 day^{-1}, a=0, b=10,000, with fixed trade sizes of 100,000 USDT or 40 WETH, and these values are not estimated from any data set. The objective in Eq. (3) and the optimal markups in Eq. (10) depend directly on these choices through H and the inverse map bar-delta, so Figures 10-12 report PnL conditional on an arbitrary demand curve; real price data enter only as price paths, not as order flow. The abstract's claim that the AMM 'consistently yields efficient quotes' and Section 4.4's claim of outperformance 'by far' are therefore not yet supported. A sensitivity analysis over b, lambda, and trade size, and ideally a calibration or comparison with real trade-flow data, is needed before these conclusions can be drawn.
- [Section 4.4, synthetic price experiment] The synthetic-price validation is circular: prices are simulated from the same multi-level nested OU dynamics (Table 3) that the NOU AMM assumes, so Figure 10 checks internal consistency rather than predictive performance. The real-price simulations in Figures 11-12 are less circular, but they still inherit the synthetic order-flow assumption described above, so they do not break the dependence of the headline result on the unverified demand model.
- [Section 4.4, benchmark choice] The comparison to a GBM AMM does not identify the source of any outperformance. A one-factor OU AMM benchmark is missing; without it, the paper cannot support the claim that the multi-level nested structure, rather than mean reversion per se, is responsible for the results. This attribution matters because the paper's stated novelty is specifically the multi-level nested OU dynamics. Adding a one-factor OU AMM to Figures 10-12, or otherwise isolating the contribution of the second mean-reversion level, is necessary to support the 'leverages the multi-level nested OU dynamics' claim.
minor comments (5)
- [Eq. (7) and Eq. (9)] After filtering, the state variable is hat-U with volatility hat-nu defined in Eq. (2), so the second-order terms in Eq. (7) and Eq. (9) should read (1/2)hat-nu^2 partial^2_{hat-U hat-U} theta and sigma hat-nu partial^2_{S hat-U} theta, not nu^2 and sigma nu. The quadratic risk term already uses hat-nu, so the displayed PDE is internally inconsistent.
- [Section 4.4, wstETH/WETH paragraph] The statement that the decrease in performance on the right side of Figure 12 is 'not statistically significant' should be supported by confidence intervals or standard errors across the 300 simulations; otherwise the assertion cannot be checked by the reader.
- [Figure 12] The zoomed panel in Figure 12 lacks axis labels and a legend, making it difficult to determine what is being displayed.
- [Various] There are several typographical errors: 'Similary' in the proof of Proposition 1, 'diffential' in the appendix, and 'allow use to define' in Section 2.4 should read 'allow us to define.'
- [Footnote 16] The claim that the volatility parameter does not matter for the GBM AMM because the simulations span a large range of gamma deserves a one-sentence justification; as written it is not obvious why the two effects are redundant.
Circularity Check
The optimal-control derivation is self-contained; the main circularity is in validation, where the synthetic-price test generates data from the same nested OU model that defines the NOU AMM, making the synthetic outperformance over the GBM AMM hold by construction.
-
self definitional
[Section 4.4, Numerical Simulation (simulated-price experiment, Figure 10)]
"To test the performance on simulated price data, we use the parameters from Table 3, which correspond to the USDC/USDT pair. ... Unsurprisingly, the NOU AMM strategy, which is based on the multi-level nested OU dynamics used to simulate prices, outperforms the GBM AMM strategy proposed in [14], which assumes geometric Brownian motion dynamics."
The simulated price paths are draws from the same multi-level nested OU SDE (Eq. 1) on which the NOU AMM's HJB equation and optimal markups (Eqs. 9-10) are built. The NOU AMM is therefore optimally tuned to the data-generating process, while the GBM AMM is, by construction, misspecified under that SDE. The average-excess-P&L dominance of NOU over GBM in Figure 10 is consequently an internal-consistency check rather than an empirical prediction: the outperformance is a mathematical consequence of the simulation design, not independent evidence about USDC/USDT or about the merits of nested OU dynamics. The paper's own word 'Unsurprisingly' concedes this.
full rationale
The core derivation chain is self-contained and not circular: Proposition 1 gives the Gaussian representation and covariance of the nested OU process, the MLE procedure estimates its parameters, Proposition 2 derives the filtering equations, and the HJB equation is reduced, via explicit ansatze, to Riccati ODEs for the coefficients A and B. No fitted constant is relabeled as a prediction, and no uniqueness theorem or load-bearing claim is imported solely from the authors' prior work; references such as [14], [16], and [31] supply benchmarks and approximation techniques that are stated transparently rather than smuggled in. The one genuinely circular element is the simulated-price validation: because the simulator and the NOU AMM share the same nested OU dynamics, the simulated outperformance of NOU over GBM is forced by construction. The real-price experiments using Pyth data retain independent content, so the central claim is not wholly reducible to the model's own assumptions. However, those real-price results still depend on uncalibrated order-flow parameters (lambda=250 day^-1, a=0, b=10,000) and on an in-sample calibration window, which weakens external validity but is not itself circularity. Overall, the paper deserves a moderate circularity score for the by-construction synthetic test, while the main mathematical derivation remains independent.
Assumptions & free parameters
free parameters (10)
- kappa (mean reversion of S toward U) =
0.05 day^-1 (USDC/USDT), 6 day^-1 (wstETH/WETH) after rounding
- eta (mean reversion of U toward U-bar) =
0.03 day^-1 (USDC/USDT), 3 day^-1 (wstETH/WETH)
- sigma (volatility of S) =
5e-4 USDT day^-1/2 (USDC/USDT), 6e-3 WETH day^-1/2 (wstETH/WETH)
- nu (volatility of U) =
5e-4 USDT day^-1/2 (USDC/USDT), 4e-3 WETH day^-1/2 (wstETH/WETH)
- U-bar (long-term target) =
1.00 USDT (USDC/USDT), 1.15 WETH (wstETH/WETH)
- Staking yield r =
2.94% annualized
- Trade flow arrival rates lambda_0,1 and lambda_1,0 =
250 day^-1
- Markup sensitivity a and b =
a=0, b=10,000 USDT^-1 (or WETH^-1)
- Fixed trade size =
100,000 USDT or 40 WETH
- Risk aversion gamma =
Varied over a range to trace the efficient frontier
assumptions (7)
- standard math Standard probability space and Brownian motions with usual assumptions
- domain assumption Initial states S0 and U0 are constant and Gaussian in the filtering setup
- standard math The covariance matrix C(t_i, t_j) in the MLE is invertible for the chosen observation grids
- domain assumption The marked point processes have intensity kernels of logistic form with given lambda, a, b functions
- ad hoc to paper The HJB equation (6) has a smooth solution theta, and the quadratic Hamiltonian approximation (9) is accurate enough for the greedy policy
- domain assumption Reserve depletion risk can be ignored
- domain assumption The yield process r_t is approximately constant over the trading horizon
invented entities (1)
-
Latent mean-reversion target U_t
Cite this review
Pith. "Pith review of Automated Market Making: the case of Pegged Assets." pith.science (2026). https://pith.science/paper/32JGY3MF
@misc{pith2026241108145,
  author       = {Pith},
  title        = {Pith review of: Automated Market Making: the case of Pegged Assets},
  year         = {2026},
  howpublished = {\url{https://pith.science/paper/32JGY3MF}},
  note         = {Machine review of arXiv:2411.08145}
}
read the original abstract
In this paper, we introduce a novel framework to model the exchange rate dynamics between two intrinsically linked cryptoassets, such as stablecoins pegged to the same fiat currency or a liquid staking token and its associated native token. Our approach employs multi-level nested Ornstein-Uhlenbeck (OU) processes, for which we derive key properties and develop calibration and filtering techniques. Then, we design an automated market maker (AMM) model specifically tailored for the swapping of closely related cryptoassets. Distinct from existing models, our AMM leverages the unique exchange rate dynamics provided by the multi-level nested OU processes, enabling more precise risk management and enhanced liquidity provision. We validate the model through numerical simulations using real-world data for the USDC/USDT and wstETH/WETH pairs, demonstrating that it consistently yields efficient quotes. This approach offers significant potential to improve liquidity in markets for pegged assets.
Figures


Figures from the paper (9 more)




Forward citations
Cited by 1 Pith paper
-
Optimal Fees for Liquidity Provision in Automated Market Makers
Optimal AMM fees sit just below all-in CEX trading costs in normal markets, rise with volatility, and become effectively infinite (halt trading) in extreme volatility.
Reference graph
Works this paper leans on
-
[16]
Closed-form approximations in multi-asset market making.Applied Mathematical Finance, 28(2):101–142, 2021
Philippe Bergault, David Evangelista, Olivier Guéant, and Douglas Vieira. Closed-form approximations in multi-asset market making.Applied Mathematical Finance, 28(2):101–142, 2021
2021
-
[1]
Runs on algorithmic stablecoins: Evidence from iron, titan, and steel
Austin Adams and Markus Ibert. Runs on algorithmic stablecoins: Evidence from iron, titan, and steel. 2022
work page 2022
-
[2]
Bank for International Settlements, Monetary and Economic Department, 2024
Rashad Ahmed, Iñaki Aldasoro, and Chanelle Duley.Public information and stablecoin runs. Bank for International Settlements, Monetary and Economic Department, 2024
work page 2024
-
[3]
On par: A money view of stablecoins
Iñaki Aldasoro, Perry Mehrling, and Daniel H Neilson. On par: A money view of stablecoins. 2023
work page 2023
-
[4]
Runs and flights to safety: Are stablecoins the new money market funds? 2023
Kenechukwu Anadu, Pablo Azar, Catherine Huang, Marco Cipriani, Thomas M Eisenbach, Gabriele La Spada, Mattia Landoni, Marco Macchiavelli, Antoine Malfroy-Camine, and J Christina Wang. Runs and flights to safety: Are stablecoins the new money market funds? 2023
work page 2023
-
[5]
Stablecoins: risks, potential and regulation
Douglas W Arner, Raphael Auer, and Jon Frost. Stablecoins: risks, potential and regulation. 2020
work page 2020
-
[6]
High-frequency trading in a limit order book
Marco Avellaneda and Sasha Stoikov. High-frequency trading in a limit order book. Quantitative Finance, 8(3):217–224, 2008
2008
-
[7]
Regulating the crypto ecosystem: the case of stablecoins and arrangements
Parma Bains, Arif Ismail, Fabiana Melo, and Nobuyasu Sugimoto. Regulating the crypto ecosystem: the case of stablecoins and arrangements. 2022
work page 2022
Show all 56 references
-
[8]
Stablecoins and short-term funding markets
Jean Barthelemy, Paul Gardin, and Benoît Nguyen. Stablecoins and short-term funding markets. Available at SSRN 3973538, 2021
2021
-
[9]
Market-making by a foreign exchange dealer
Alexander Barzykin, Philippe Bergault, and Olivier Guéant. Market-making by a foreign exchange dealer. Risk Magazine (Cutting Edge), 2022
2022
-
[10]
Algorithmic market making in dealer markets with hedging and market impact.Mathematical Finance, 33(1):41–79, 2023
Alexander Barzykin, Philippe Bergault, and Olivier Guéant. Algorithmic market making in dealer markets with hedging and market impact.Mathematical Finance, 33(1):41–79, 2023
2023
-
[11]
Dealing with multi-currency inventory risk in foreign exchange cash markets.Risk Magazine (Cutting Edge), 2023
Alexander Barzykin, Philippe Bergault, and Olivier Guéant. Dealing with multi-currency inventory risk in foreign exchange cash markets.Risk Magazine (Cutting Edge), 2023
2023
-
[12]
Algorithmic market making in spot precious metals
Alexander Barzykin, Philippe Bergault, and Olivier Guéant. Algorithmic market making in spot precious metals. arXiv preprint arXiv:2404.15478, 2024
2024
-
[13]
Global demand for basket-backed stablecoins.Review of Eco- nomic Dynamics, 48:244–264, 2023
Garth Baughman and Jean Flemming. Global demand for basket-backed stablecoins.Review of Eco- nomic Dynamics, 48:244–264, 2023. 22
2023
-
[14]
Automated market makers: Mean-variance analysis of LPs payoffs and design of pricing functions.Digital Finance, 6(2):225–247, 2024
Philippe Bergault, Louis Bertucci, David Bouba, and Olivier Guéant. Automated market makers: Mean-variance analysis of LPs payoffs and design of pricing functions.Digital Finance, 6(2):225–247, 2024
2024
-
[15]
Price-aware automated market makers: Models beyond Brownian prices and static liquidity
Philippe Bergault, Louis Bertucci, David Bouba, Olivier Guéant, and Julien Guilbert. Price-aware automated market makers: Models beyond Brownian prices and static liquidity. arXiv preprint arXiv:2405.03496, 2024
2024 arXiv
-
[17]
Size matters for OTC market makers: general results and dimensionality reduction techniques.Mathematical Finance, 31(1):279–322, 2021
Philippe Bergault and Olivier Guéant. Size matters for OTC market makers: general results and dimensionality reduction techniques.Mathematical Finance, 31(1):279–322, 2021
2021
-
[18]
Stablecoins: Adoption and fragility
Christoph Bertsch. Stablecoins: Adoption and fragility. 2023
2023
-
[19]
High-level recommendations for the regulation, supervision and oversight of global stablecoin arrangements, final report, 2023
Financial Stability Board. High-level recommendations for the regulation, supervision and oversight of global stablecoin arrangements, final report, 2023
2023
-
[20]
Internalisation by electronic FX spot dealers.Quantitative Finance, 19(1):35–56, 2019
Maximilian Butz and Roel Oomen. Internalisation by electronic FX spot dealers.Quantitative Finance, 19(1):35–56, 2019
2019
-
[21]
Algorithmic trading with model uncertainty
Álvaro Cartea, Ryan Donnelly, and Sebastian Jaimungal. Algorithmic trading with model uncertainty. SIAM Journal on Financial Mathematics, 8(1):635–671, 2017
2017
-
[22]
Cam- bridge University Press, 2015
Álvaro Cartea, Sebastian Jaimungal, and José Penalva.Algorithmic and high-frequency trading. Cam- bridge University Press, 2015
2015
-
[23]
Buy low, sell high: A high frequency trading perspective
Álvaro Cartea, Sebastian Jaimungal, and Jason Ricci. Buy low, sell high: A high frequency trading perspective. SIAM Journal on Financial Mathematics, 5(1):415–444, 2014
2014
-
[24]
Can stablecoins be stable?University of Chicago, Becker Friedman Institute for Economics Working Paper, (2022-131), 2022
Adrien d’Avernas, Vincent Maurin, and Quentin Vandeweyer. Can stablecoins be stable?University of Chicago, Becker Friedman Institute for Economics Working Paper, (2022-131), 2022
2022
-
[25]
Stablecoin devaluation risk.WBS Finance Group Research Paper, 2023
Barry Eichengreen, My T Nguyen, and Ganesh Viswanath-Natraj. Stablecoin devaluation risk.WBS Finance Group Research Paper, 2023
2023
-
[26]
Stablecoins and central bank digital currencies: policy and regulatory challenges.Asian Economic Papers, 21(1):29–46, 2022
Barry Eichengreen and Ganesh Viswanath-Natraj. Stablecoins and central bank digital currencies: policy and regulatory challenges.Asian Economic Papers, 21(1):29–46, 2022
2022
-
[27]
How the rise of stablecoins could threaten traditional banks’ lending capacity
Mark J Flannery. How the rise of stablecoins could threaten traditional banks’ lending capacity. Available at SSRN 4320945, 2023
2023
-
[28]
Leverage and stablecoin pegs
Gary B Gorton, Elizabeth C Klee, Chase P Ross, Sharon Y Ross, and Alexandros P Vardoulakis. Leverage and stablecoin pegs. Technical report, National Bureau of Economic Research, 2022
2022
-
[29]
Taming wildcat stablecoins.U
Gary B Gorton and Jeffery Y Zhang. Taming wildcat stablecoins.U. Chi. L. Rev., 90:909, 2023
2023
-
[30]
The Financial Mathematics of Market Liquidity: From optimal execution to market making, volume 33
Olivier Guéant. The Financial Mathematics of Market Liquidity: From optimal execution to market making, volume 33. CRC Press, 2016
2016
-
[31]
Optimal market making.Applied Mathematical Finance, 24(2):112–154, 2017
Olivier Guéant. Optimal market making.Applied Mathematical Finance, 24(2):112–154, 2017
2017
-
[32]
Dealing with the inventory risk: a solution to the market making problem.Mathematics and financial economics, 7(4):477–507, 2013
Olivier Guéant, Charles-Albert Lehalle, and Joaquin Fernandez-Tapia. Dealing with the inventory risk: a solution to the market making problem.Mathematics and financial economics, 7(4):477–507, 2013
2013
-
[33]
Deep reinforcement learning for market making in corporate bonds: beating the curse of dimensionality.Applied Mathematical Finance, 26(5):387–452, 2019
Olivier Guéant and Iuliia Manziuk. Deep reinforcement learning for market making in corporate bonds: beating the curse of dimensionality.Applied Mathematical Finance, 26(5):387–452, 2019
2019
-
[34]
Optimal high-frequency trading with limit and market orders
Fabien Guilbaud and Huyen Pham. Optimal high-frequency trading with limit and market orders. Quantitative Finance, 13(1):79–94, 2013. 23
2013
-
[35]
The four types of stable- coins: A comparative analysis.arXiv preprint arXiv:2308.07041, 2023
Matthias Hafner, Marco Henriques Pereira, Helmut Dietl, and Juan Beccuti. The four types of stable- coins: A comparative analysis.arXiv preprint arXiv:2308.07041, 2023
2023 arXiv
-
[36]
Réglementer les émetteurs de stablecoins adossés à des actifs.Revue d’économie financière, (1):175–190, 2023
Olena Havrylchyk. Réglementer les émetteurs de stablecoins adossés à des actifs.Revue d’économie financière, (1):175–190, 2023
2023
-
[37]
The cost of misspecifying price impact.arXiv preprint arXiv:2306.00599, 2023
Natascha Hey, Jean-Philippe Bouchaud, Iacopo Mastromatteo, Johannes Muhle-Karbe, and Kevin Webster. The cost of misspecifying price impact.arXiv preprint arXiv:2306.00599, 2023
2023 arXiv
-
[38]
Thomas Ho and Hans R. Stoll. Optimal dealer pricing under transactions and return uncertainty. Journal of Financial economics, 9(1):47–73, 1981
1981
-
[39]
The dynamics of dealer markets under competition.The Journal of finance, 38(4):1053–1074, 1983
Thomas SY Ho and Hans R Stoll. The dynamics of dealer markets under competition.The Journal of finance, 38(4):1053–1074, 1983
1983
-
[40]
Numerical procedures for implementing term structure models i: Single- factor models
John Hull and Alan White. Numerical procedures for implementing term structure models i: Single- factor models. Journal of derivatives, 2(1):7–16, 1994
1994
-
[41]
What is stablecoin?: A survey on its mechanism and potential as decentralized payment systems.International Journal of Service and Knowledge Management, 4(2):71–86, 2020
Kensuke Ito, Makiko Mita, Shohei Ohsawa, and Hideyuki Tanaka. What is stablecoin?: A survey on its mechanism and potential as decentralized payment systems.International Journal of Service and Knowledge Management, 4(2):71–86, 2020
2020
-
[42]
Reducing the volatility of cryptocurrencies – a survey of stablecoins.arXiv preprint arXiv:2103.01340, 2021
Ayten Kahya, Bhaskar Krishnamachari, and Seokgu Yun. Reducing the volatility of cryptocurrencies – a survey of stablecoins.arXiv preprint arXiv:2103.01340, 2021
2021 arXiv
-
[43]
(in)stability for the blockchain: Deleveraging spirals and stablecoin attacks
Ariah Klages-Mundt and Andreea Minca. (in)stability for the blockchain: Deleveraging spirals and stablecoin attacks. 2021
2021
-
[44]
While stability lasts: A stochastic model of noncustodial stablecoins
Ariah Klages-Mundt and Andreea Minca. While stability lasts: A stochastic model of noncustodial stablecoins. Mathematical Finance, 32(4):943–981, 2022
2022
-
[45]
Will the real stablecoin please stand up? BIS Papers, 2023
Anneke Kosse, Marc Glowka, Ilaria Mattei, and Tara Rice. Will the real stablecoin please stand up? BIS Papers, 2023
2023
-
[46]
Decentralized stablecoins and collateral risk
Roman Kozhan and Ganesh Viswanath-Natraj. Decentralized stablecoins and collateral risk. WBS Finance Group Research Paper, 2021
2021
-
[47]
What drives the (in)stability of a stablecoin?arXiv preprint arXiv:2307.11754, 2023
Yujin Kwon, Kornrapat Pongmala, Kaihua Qin, Ariah Klages-Mundt, Philipp Jovanovic, Christine Parlour, Arthur Gervais, and Dawn Song. What drives the (in)stability of a stablecoin?arXiv preprint arXiv:2307.11754, 2023
2023 arXiv
-
[48]
Stablecoins: Growth potential and impact on banking
Gordon Y Liao and John Caramichael. Stablecoins: Growth potential and impact on banking. 2022
2022
-
[49]
Anatomy of a run: The terra luna crash
Jiageng Liu, Igor Makarov, and Antoinette Schoar. Anatomy of a run: The terra luna crash. Technical report, National Bureau of Economic Research, 2023
2023
-
[50]
What keeps stablecoins stable?Journal of Interna- tional Money and Finance, 131:102777, 2023
Richard K Lyons and Ganesh Viswanath-Natraj. What keeps stablecoins stable?Journal of Interna- tional Money and Finance, 131:102777, 2023
2023
-
[51]
Stablecoin runs and the centralization of arbitrage
Yiming Ma, Yao Zeng, and Anthony Lee Zhang. Stablecoin runs and the centralization of arbitrage. Available at SSRN 4398546, 2023
2023
-
[52]
Princeton University Press Princeton, NJ, 2017
Bill Maurer.Blockchains are a diamond’s best friend. Princeton University Press Princeton, NJ, 2017
2017
-
[53]
Are stablecoins the money market mutual funds of the future? Available at SSRN 4550177, 2023
Nico Oefele, Dirk G Baur, and Lee A Smales. Are stablecoins the money market mutual funds of the future? Available at SSRN 4550177, 2023
2023
-
[54]
A luna-tic stablecoin crash
Harald Uhlig. A luna-tic stablecoin crash. Technical report, National Bureau of Economic Research, 2022
2022
-
[55]
Gang-Jin Wang, Xin-yu Ma, and Hao-yu Wu. Are stablecoins truly diversifiers, hedges, or safe havens against traditional cryptocurrencies as their name suggests?Research in International Business and Finance, 54:101225, 2020
2020
-
[56]
Chapman and Hall/CRC, 2023
Kevin T Webster.Handbook of Price Impact Modeling. Chapman and Hall/CRC, 2023. 24 Appendix on Stochastic Filtering In this appendix, we provide essential results of stochastic filtering. We consider a filtered probability space (Ω, F = (Ft)t, P) that satisfies the usual assump...
2023
Reviewed August 12, 2026 · model on record in the stance chip above.
Discussion (0). Continue with ORCID to comment.