REVIEW 4 major objections 5 minor 41 references
Reconciling concentration to virial mass relations
T0 review · 4 major / 5 minor · reviewed 2026-08-12 · deepseek-v4-flash
Pith's one-line read The offset between lensing-based and simulated dark-matter halo concentrations can be largely attributed to assumptions about the inner density profile and the stellar initial mass function, not to new physics.
desk verdict Honest systematics exploration whose 'reconciliation' headline outruns the data. read the letter →
The pith
A machine-rendered reading of the paper's core claim, the machinery that carries it, and where it could break.
The reading
What carries the argument
The central object is the generalized NFW (GNFW) density profile $\rho(r) \propto (r/r_s)^{-\gamma_{\mathrm{GNFW}}} (1 + r/r_s)^{\gamma_{\mathrm{GNFW}}-3}$, whose inner slope $\gamma_{\mathrm{GNFW}}$ is free. Fitting this to the enclosed dark matter mass profile (total lensing mass minus stellar mass) changes the significance of the scale radius $r_s$; with cuspier profiles the fitted scale radius drifts outward and the concentration $r_{\mathrm{vir}}/r_s$ falls. A secondary mechanism is the distortion function applied to the inner enclosed mass profile while keeping the mass within the lens radius fixed, which mimics reconstruction uncertainty and produces the elongated scatter seen in observed lenses. Finally, the non-parametric concentration $R_{90}/R_{50}$ is used to check that the parametric NFW fit itself is not the root cause.
What would settle it
A decisive test would be to measure the inner dark matter slope of a few lens galaxies independently, for example with spatially resolved stellar kinematics inside the scale radius, and check whether the best-fit GNFW slope from lensing agrees. Alternatively, if a c-M offset persisted when the GNFW inner slope is free and the IMF is allowed to vary over independently constrained ranges, the claimed reconciliation would fail. A simpler check: determine whether the extreme bottom-heavy IMFs (e.g., $\mu_{2PL} > 1.5$) required to shift the c-M relation are excluded by stellar-population or kinematic constraints on the same galaxies.
Extended reading notes
Core claim
The central claim is that variations in the c-M relation between simulated and observed dark matter haloes can largely be attributed to differences in the inner mass profiles and the assumed dark matter density profile. The authors demonstrate that when the inner slope $\gamma_{\mathrm{GNFW}}$ of a generalized NFW profile is treated as a free parameter between 0 and 2, the fitted concentrations drop as the profile becomes cuspier (higher $\gamma$), while virial masses rise; for $\gamma=0$ and $\gamma=1$ the goodness-of-fit is similar to the standard NFW. Along the same lines, extreme bottom-heavy stellar IMFs systematically lower concentrations. The paper argues that these choices, rather than new physics, can remove much of the offset between lensing and simulation.
Load-bearing premise
The reconciliation depends on the assumption that the real dark matter haloes of lens galaxies are well represented by the GNFW family with inner slope between 0 and 2; the data themselves do not prefer these alternative profiles over a standard NFW, so if the true inner profiles differ in a way not captured by this family the reconciliation could be artificial.
Editorial extensions
If this is right
- If the reconciliation holds, the higher concentrations found in strong-lensing studies are not evidence for exotic dark matter but follow from assuming a standard NFW profile and a canonical IMF.
- The c-M relation measured from lenses should be reported as a function of the assumed GNFW inner slope; quoting only the NFW-based point may be misleading.
- Cuspier inner profiles, whether from baryonic contraction or substructure, will shift galaxies to lower apparent concentrations at fixed virial mass.
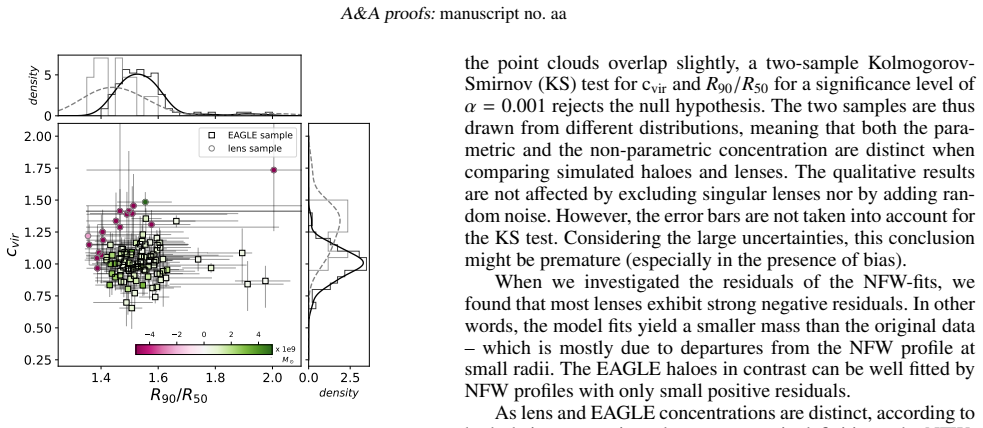
- The non-parametric $R_{90}/R_{50}$ measure provides a way to compare observed and simulated haloes without profile assumptions, though its current error bars limit its discriminating power.
Reading between the lines
- The same GNFW/IMF framework could be applied to cluster-scale lenses, where the inner profile is better resolved, to test whether the reconciliation persists or the offset reappears.
- A direct measurement of the inner slope $\gamma_{\mathrm{GNFW}}$ from combining lensing with stellar kinematics would break the degeneracy and either confirm or refute the modeling-artifact explanation.
- The distortion-function experiment suggests that small systematic errors in inner-profile reconstruction can create the observed scatter; a full forward-modeling test, simulating lens images and reconstructing them with the same pipeline, would quantify this bias directly.
Signed reviews
Editorial analysis
A structured set of objections, weighed in public.
Referee Report
Summary. This paper investigates possible sources of the offset between strong-lensing-based and EAGLE-simulation concentration–virial mass (c-M) relations, using 18 lens systems, PixeLens mass reconstructions, stellar mass maps with two IMF choices, and orientation-averaged EAGLE projections. It sequentially studies the effect of inner radial resolution (§4.1), distortion of the enclosed mass profile (§4.2), a non-parametric concentration R90/R50 (§4.3), generalized NFW profile slopes (§4.4), and IMF slopes (§4.5). The authors conclude that much of the observed tension can be attributed to differences in the inner mass profiles and to the assumed dark matter density profile, with a smaller methodological effect from fitting NFW to poorly constrained inner profiles.
Significance. If the central claim were established, the paper would be significant: the long-standing lensing-vs-simulation c-M tension would be reinterpreted as a modeling artifact rather than as evidence for new physics. The paper has real strengths: it applies the same pipeline to observed and simulated lenses, it includes a non-parametric concentration measure, it is unusually candid about its limitations, and the distortion experiment in §4.2 is a useful quantitative sensitivity analysis. However, as detailed below, the evidence does not support the causal attribution in the Conclusion; the paper is better read as a systematic exploration of how much the c-M relation can move under plausible modeling choices than as a demonstration that the offset is actually caused by inner-profile differences.
major comments (4)
- [§4.4 and Conclusion] The central conclusion that variations in the c-M relation 'can largely be attributed to differences in the inner mass profiles and the assumed dark matter density profile' is not supported by the GNFW analysis. In §4.4 the authors state that 'we find no evidence that an NFW is a worse representation of the dark matter profiles that we produced with our method' and that γGNFW=0 and 1 give similar goodness-of-fit; the strong monotonic shift of log c with γGNFW in Fig. 5 therefore demonstrates a profile-concentration degeneracy (the scale radius rs is redefined by each GNFW model), not that the lens haloes actually have non-NFW inner slopes. A reconciliation achieved by letting an unconstrained slope float is a possibility, not an attribution; the Conclusion should be reframed accordingly, and ideally accompanied by constraints on γGNFW from the fit residuals.
- [§4.2, Eq. (1)] The distortion experiment shows that a family of transformations f(x,L) that preserve M(<Rlens) can spread NFW-fitted c-M values along the observed elongation, but the logit parameters (a=1, k=10, x0=0.5) and the L range are chosen ad hoc, and the experiment does not test whether the actual PixeLens profiles of the 18 lenses have this type of distortion. As written, the experiment is a sensitivity demonstration ('we recreated the uncertainty of the ensemble of lens models'), not evidence about the real inner profiles. Without a quantitative comparison between the distorted EAGLE profiles and the reconstructed lens profiles over the same radial range, this experiment cannot support the causal attribution in the Conclusion.
- [§4.3, Fig. 4] The two-sample KS test used to claim that lens and EAGLE samples are 'drawn from different populations' ignores the quoted measurement uncertainties; the authors admit that 'the error bars are not taken into account for the KS test.' Given the large asymmetric errors in Table 2 (e.g., c=43.97+12.1−0.65 for J1402 and R90/R50 upper errors reaching 7.65 for J1538), a KS test on point estimates is not a reliable basis for the 'tentative evidence' that the discrepancy traces to inner-profile differences. The paper should implement an error-aware comparison (e.g., Monte Carlo sampling of the posterior distributions or a generalized distance test) or explicitly downgrade this item to a hypothesis-generating observation.
- [§4.5, Figs. 6–9] The IMF-based reconciliation rests on 'extreme choices' of ΓBM and µ2PL, and the authors note that bottom-heavy 2PL slopes can be ruled out for J0037 (µ>1.8) and J0044 (µ>1.5), with only J0946 showing the trend 'with sufficient significance.' Since the lens data disfavor the very IMF slopes that produce the largest reduction in c, the IMF channel cannot be cited as evidence that the observed c-M relation is reconciled with simulations; at most it provides an upper bound on how much the IMF can contribute. The Conclusion should not present this channel as support for the central attribution claim.
minor comments (5)
- [Eq. (2)] The function defined in Eq. (2) is a logistic (sigmoid) function, not a logit; rename it or adjust the notation to avoid a terminological error.
- [Figs. 6–9] The horizontal axis labels in Figs. 6–9 read 'γNFW' while the text and Fig. 5 use 'γGNFW'; unify the notation.
- [Eqs. (4)–(7)] The projected mass expressions are written with 'M∼' and leave κs and the numerical coefficients unspecified; define all symbols or state explicitly that the normalization is absorbed.
- [Table 1] The asymmetric errors in column 3 are not accompanied by a confidence level; specify whether they are 68% or 90% intervals.
- [Abstract] The phrase 'changing the slope of a generic NFW profile' is ambiguous; use 'generalized NFW (GNFW) profile' consistently from the abstract onward.
Circularity Check
The GNFW-based 'reconciliation' is largely a redefinition of the scale radius rather than an empirical resolution; the paper's own text admits the trend follows from the assumed profile family.
-
self definitional
[Section 4.4 (Beyond NFW profiles), after Eqs. (4)-(12) and Fig. 5]
"By imposing different slopes in the fit, we essentially changed the impact that data at small radii have on extrapolated quantities, including the virial radius, and we also changed the meaning of the scale radius. [...] As concentration and virial mass are inversely related and belong to a one-parameter family (a result from assuming one of the above dark matter functions), an increasing trend of Mvir withγGNFW follows naturally."
The central reconciliation is obtained by switching the dark-matter profile family, which changes the definition of the scale radius used to compute cvir = rvir/rs. The authors explicitly state that the trend of c and Mvir with αGNFW follows naturally from the assumed one-parameter family, i.e. it is a mathematical consequence of the ansatz rather than a constraint from the lens data. This is reinforced in the same section: 'we find, however, no evidence that an NFW is a worse representation of the dark matter profiles that we produced with our method.' The offset between lenses and EAGLE is therefore absorbed by a profile parameter that the data do not prefer, making the 'reconciliation' partly definitional.
-
self definitional
[Section 6 (Conclusion)]
"Our study demonstrates that variations in the c-M relation between simulated and observed dark matter haloes can largely be attributed to differences in the inner mass profiles and the assumed dark matter density profile."
Since concentration and virial mass are themselves derived from the assumed dark-matter density profile (cvir = rvir/rs, with rs the scale radius of that profile), attributing the c-M variation to 'the assumed dark matter density profile' is partly a restatement of how c and Mvir are defined. The only non-parametric evidence for inner-profile differences is explicitly hedged in Sect. 4.3: 'The large error bars, however, prevent a definitive conclusion.' The categorical wording of the Conclusion converts a definitional sensitivity into an empirical demonstration, though the independent R90/R50 comparison and the EAGLE distortion test keep the paper from being wholly circular.
full rationale
The paper is largely an honest sensitivity analysis: it tests resolution effects, mass-profile distortions, non-parametric concentrations, GNFW slopes, and IMF choices, and it explicitly warns that 'the large error bars... prevent a definitive conclusion' in the non-parametric comparison. The EAGLE distortion experiment (Sect. 4.2) provides independent support for the median c-M recovery, and the R90/R50 comparison is a genuinely non-parametric check. However, the headline reconciliation rests on a step that reduces by construction: changing γGNFW changes the meaning of the scale radius, and the authors themselves note that the corresponding trend of Mvir follows naturally from the assumed one-parameter profile family. The same section states that there is no evidence that NFW is a worse representation of the data. Thus the observed-vs-simulated tension is partially absorbed by an unconstrained profile parameter rather than resolved by measurement. Because independent elements remain, the circularity is partial rather than total. Score 6 reflects this partial, construction-driven reconciliation; it is not a case of pure renaming or self-citation chain.
Assumptions & free parameters
free parameters (4)
- GNFW inner slope γGNFW =
0, 1, 1.5, 2 (discrete choices)
- Distortion amplitude L =
sampled in [-0.5, 0.5]; key runs at 0.05, 0.1, 0.2, 0.5
- IMF slope parameters µ2PL and ΓBM =
µ in [0.8, 2.3]; Γ in [0.8, 2.3]
- Logit shape constants a, k, x0 =
a=1, k=10, x0=0.5
assumptions (5)
- domain assumption NFW and GNFW density profiles and their projected mass expressions are valid descriptors of dark matter haloes on galaxy scales.
- domain assumption EAGLE RefL0100N1504 haloes at z=0.1 with stellar mass above 10^10.75 Msun are representative of the observed lens galaxies.
- domain assumption The dark matter profile of a lens is accurately given by the difference between the lensing total mass profile and the stellar mass profile from SPS models.
- ad hoc to paper The distortion function f(x,L) with logit parameters a=1, k=10, x0=0.5 captures the actual reconstruction uncertainty of PixeLens mass profiles.
- domain assumption Lensing geometry and image configurations used in PixeLens provide unbiased total mass profiles at radii covered by the data.
Cite this review
Pith. "Pith review of Reconciling concentration to virial mass relations." pith.science (2026). https://pith.science/paper/C62YXP6E
@misc{pith2026241108956,
  author       = {Pith},
  title        = {Pith review of: Reconciling concentration to virial mass relations},
  year         = {2026},
  howpublished = {\url{https://pith.science/paper/C62YXP6E}},
  note         = {Machine review of arXiv:2411.08956}
}
abstract
The concentration-virial mass (c-M) relation is a fundamental scaling relation within the standard cold dark matter ($\Lambda$CDM) framework well established in numerical simulations. However, observational constraints of this relation are hampered by the difficulty of characterising the properties of dark matter haloes. Recent comparisons between simulations and observations have suggested a systematic difference of the c-M relation, with higher concentrations in the latter. In this work, we undertake detailed comparisons between simulated galaxies and observations of a sample of strong-lensing galaxies. We explore several factors of the comparison with strong gravitational lensing constraints, including the choice of the generic dark matter density profile, the effect of radial resolution, the reconstruction limits of observed versus simulated mass profiles, and the role of the initial mass function in the derivation of the dark matter parameters. Furthermore, we show the dependence of the c-M relation on reconstruction and model errors through a detailed comparison of real and simulated gravitational lensing systems. An effective reconciliation of simulated and observed c-M relations can be achieved if one considers less strict assumptions on the dark matter profile, for example, by changing the slope of a generic NFW profile or focusing on rather extreme combinations of stellar-to-dark matter distributions. A minor effect is inherent to the applied method: fits to the NFW profile on a less well-constrained inner mass profile yield slightly higher concentrations and lower virial masses.
Figures


Figures from the paper (4 more)


Reference graph
Works this paper leans on
-
[1]
S., Kolatt, T
Bullock, J. S., Kolatt, T. S., Sigad, Y ., et al. 2001, MNRAS, 321, 559
2001
-
[2]
A., Gastaldello, F., Humphrey, P
Buote, D. A., Gastaldello, F., Humphrey, P. J., et al. 2007, ApJ, 664, 123
work page 2007
-
[3]
M., Alatalo, K., et al
Cappellari, M., McDermid, R. M., Alatalo, K., et al. 2012, Nature, 484, 485
2012
-
[4]
2003, PASP, 115, 763
Chabrier, G. 2003, PASP, 115, 763
2003
-
[5]
Comerford, J. M. & Natarajan, P. 2007, MNRAS, 379, 190
work page 2007
-
[6]
A., Wyithe, J
Correa, C. A., Wyithe, J. S. B., Schaye, J., & Du ffy, A. R. 2015, MNRAS, 452, 1217
2015
-
[7]
A., Schaye, J., Bower, R
Crain, R. A., Schaye, J., Bower, R. G., et al. 2015, MNRAS, 450, 1937
2015
-
[8]
& Joyce, M
Diemer, B. & Joyce, M. 2019, ApJ, 871, 168
2019
Show all 41 references
-
[9]
Dutton, A. A. & Macciò, A. V . 2014, MNRAS, 441, 3359
2014
-
[10]
1965, Trudy Astrofizicheskogo Instituta Alma-Ata, 5, 87
Einasto, J. 1965, Trudy Astrofizicheskogo Instituta Alma-Ata, 5, 87
1965
-
[11]
G., et al
Ferreras, I., La Barbera, F., de La Rosa, I. G., et al. 2013, MNRAS, 429, L15
2013
-
[12]
Ferreras, I., Saha, P., Leier, D., Courbin, F., & Falco, E. E. 2010, MNRAS, 409, L30
2010
-
[13]
Ferreras, I., Saha, P., & Williams, L. L. R. 2005, ApJ, 623, L5
2005
-
[14]
A., et al
Ishiyama, T., Prada, F., Klypin, A. A., et al. 2021, MNRAS, 506, 4210
2021
-
[15]
Keeton, C. R. 2001, arXiv e-prints, astro-ph/0102341
2001 arXiv
-
[16]
2001, MNRAS, 322, 231 La Barbera, F., Vazdekis, A., Ferreras, I., et al
Kroupa, P. 2001, MNRAS, 322, 231 La Barbera, F., Vazdekis, A., Ferreras, I., et al. 2019, MNRAS, 489, 4090
2001
-
[17]
Lasker, R., van den Bosch, R. C. E., van de Ven, G., et al. 2013, MNRAS, 434, L31
2013
-
[18]
2022, MNRAS, 510, 24
Leier, D., Ferreras, I., Negri, A., & Saha, P. 2022, MNRAS, 510, 24
2022
-
[19]
2012, MNRAS, 424, 104–114
Leier, D., Ferreras, I., & Saha, P. 2012, MNRAS, 424, 104–114
2012
-
[20]
2016, MNRAS, 459, 3677–3692
Leier, D., Ferreras, I., Saha, P., et al. 2016, MNRAS, 459, 3677–3692
2016
-
[21]
Leier, D., Ferreras, I., Saha, P., & Falco, E. E. 2011, ApJ, 740, 97
2011
-
[22]
& Coles, J
Lubini, M. & Coles, J. 2012, MNRAS, 425, 3077
2012
-
[23]
2016, MNRAS, 463, 3220 Macciò, A
Lyubenova, M., Martín-Navarro, I., van de Ven, G., et al. 2016, MNRAS, 463, 3220 Macciò, A. V ., Dutton, A. A., & van den Bosch, F. C. 2008, MNRAS, 391, 1940 Macciò, A. V ., Dutton, A. A., van den Bosch, F. C., et al. 2007, MNRAS, 378, 55
2016
-
[24]
Mandelbaum, R., Seljak, U., & Hirata, C. M. 2008, J. Cosmology Astropart. Phys., 2008, 006 Martín-Navarro, I., La Barbera, F., Vazdekis, A., Falcón-Barroso, J., & Ferreras, I. 2015, MNRAS, 447, 1033
2008
-
[25]
2015, ApJ, 806, 4
Merten, J., Meneghetti, M., Postman, M., et al. 2015, ApJ, 806, 4
2015
-
[26]
C., & White, S
Mo, H., van den Bosch, F. C., & White, S. 2010, Galaxy Formation and Evolution (Cambridge University Press)
2010
-
[27]
& Diemand, J
Moore, B. & Diemand, J. 2010, in Particle Dark Matter : Observations, Models and Searches, ed. G. Bertone (Cambridge University Press), 14
2010
-
[28]
Mutka, P. T. & Mähönen, P. H. 2006, MNRAS, 373, 243
2006
-
[29]
F., Frenk, C
Navarro, J. F., Frenk, C. S., & White, S. D. M. 1997, ApJ, 490, 493
1997
-
[30]
F., Gao, L., Bett, P., et al
Neto, A. F., Gao, L., Bett, P., et al. 2007, MNRAS, 381, 1450
2007
-
[31]
2015, Astronomische Nachrichten, 336, 505
Pasquali, A. 2015, Astronomische Nachrichten, 336, 505
2015
-
[32]
J., Renzini, A., & Carollo, M
Peng, Y .-j., Lilly, S. J., Renzini, A., & Carollo, M. 2012, ApJ, 757, 4
2012
-
[33]
2010, MNRAS, 405, 329
Rogers, B., Ferreras, I., Pasquali, A., et al. 2010, MNRAS, 405, 329
2010
-
[34]
& Williams, L
Saha, P. & Williams, L. L. R. 2003, AJ, 125, 2769
2003
-
[35]
Salpeter, E. E. 1955, ApJ, 121, 161
1955
-
[36]
A., Bower, R
Schaye, J., Crain, R. A., Bower, R. G., et al. 2015, MNRAS, 446, 521
2015
-
[37]
J., Lucey, J
Smith, R. J., Lucey, J. R., & Conroy, C. 2015, MNRAS, 449, 3441
2015
-
[38]
J., Lucey, J
Smith, R. J., Lucey, J. R., & Edge, A. C. 2017, MNRAS, 471, 383 van Dokkum, P. G. & Conroy, C. 2010, Nature, 468, 940
2017
-
[39]
J., Gorgas, J., Cardiel, N., & Peletier, R
Vazdekis, A., Cenarro, A. J., Gorgas, J., Cardiel, N., & Peletier, R. F. 2003, MN- RAS, 340, 1317 V ogelsberger, M., Genel, S., Springel, V ., et al. 2014, MNRAS, 444, 1518
2003
-
[40]
R., et al
Wang, K., Mao, Y .-Y ., Zentner, A. R., et al. 2020, MNRAS, 498, 4450
2020
-
[41]
H., Zentner, A
Wechsler, R. H., Zentner, A. R., Bullock, J. S., Kravtsov, A. V ., & Allgood, B. 2006, ApJ, 652, 71 Article number, page 9 of 9
2006
Reviewed August 12, 2026 · model on record in the stance chip above.
Discussion (0). Continue with ORCID to comment.