REVIEW 4 major objections 5 minor 2 cited by
Challenges in constraining dust properties from starlight polarization
T0 review · 4 major / 5 minor · reviewed 2026-08-12 · deepseek-v4-flash
Pith's one-line read Line-of-sight averaging over multiple magnetic-field orientations biases most published starlight-polarization constraints on dust by about 10 percent.
desk verdict Solid contamination analysis on the largest catalog; the 10% bias claim and the projection reinterpretation of the pmax/E(B-V) break are plausible but not nailed down. read the letter →
The pith
A machine-rendered reading of the paper's core claim, the machinery that carries it, and where it could break.
The reading
What carries the argument
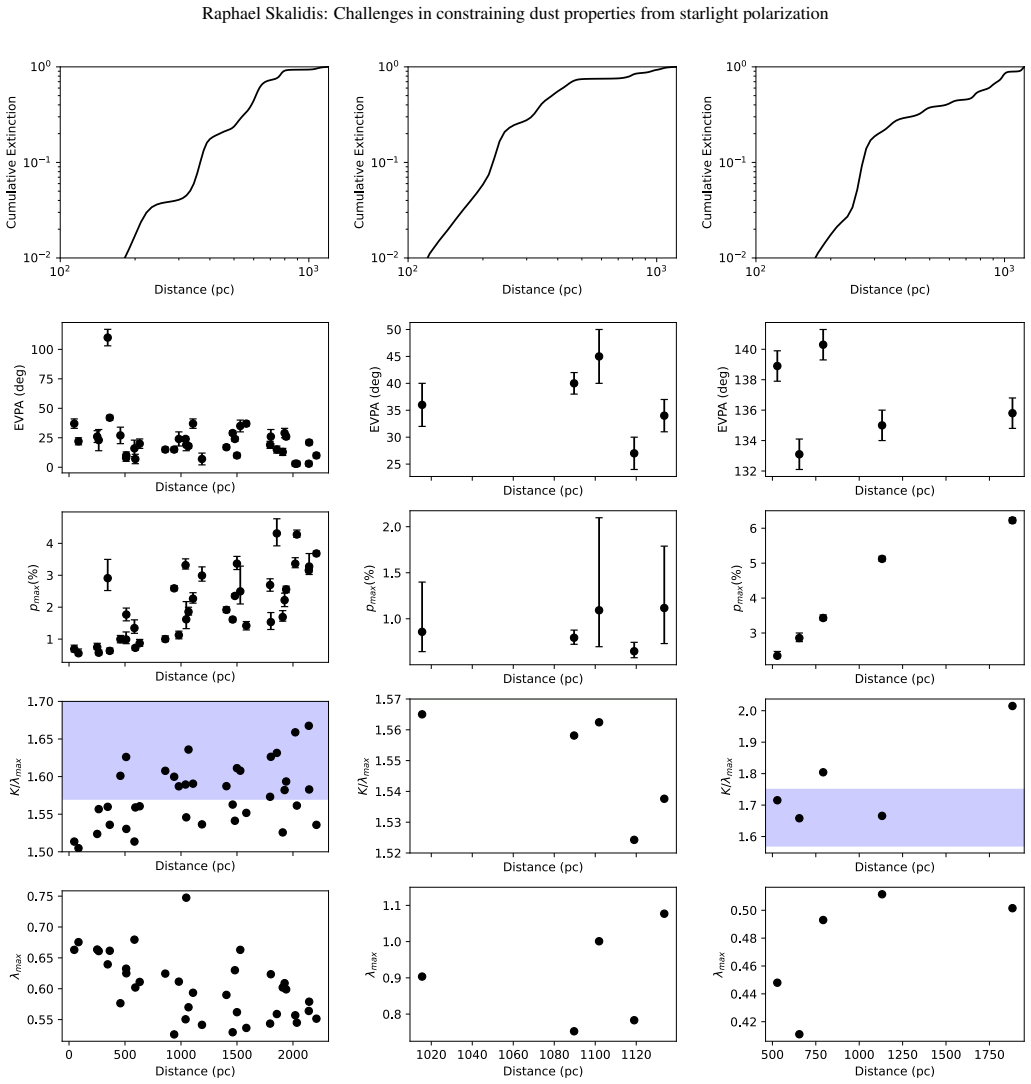
The machinery is the Serkowski relation, the empirical curve $p_{\lambda} = p_{\max}\,\exp[-K\ln^2(\lambda_{\max}/\lambda)]$ describing how the starlight polarization fraction varies with wavelength, whose fitted parameters are the standard readout for dust grain properties. The paper combines it with a polarization-angle variability diagnostic $\Delta\theta$, Bayesian fits in both $p$–$\lambda$ and Stokes $q$–$u$ space, 3D dust extinction maps, Gaia parallaxes, and a molecular-gas map to identify lines of sight where the signal is built from multiple clouds. The critical interpretive move is comparing cumulative polarization efficiency with stellar distance: a drop that tracks distance is attributed to projection and averaging over multiple magnetic-field geometries rather than to intrinsic loss of grain alignment.
What would settle it
Take a single isolated high-extinction cloud, with $E(B-V)$ near 1 mag or more, and measure $p_{\max}/E(B-V)$ for background stars at several distances all behind that same cloud; if the efficiency is already suppressed for every background star, the suppression is intrinsic to the cloud, whereas if it appears only when additional background clouds enter the line of sight, it is a projection effect.
Extended reading notes
Core claim
The central claim is that line-of-sight integration effects contaminate the majority of the existing multi-band starlight polarization dataset, biasing the derived Serkowski parameters—the peak polarization $p_{\max}$, the peak wavelength $\lambda_{\max}$, and the width parameter $K$—by approximately 10 percent. The paper shows that constant polarization angles with wavelength do not guarantee a clean sightline: multiple clouds with similar sky-plane magnetic-field orientations can add constructively, inflating $K/\lambda_{\max}$ and pushing measurements off the Wilking relation, while slightly misaligned clouds can suppress $p_{\max}$ without obviously breaking the Serkowski fit. It further argues that the observed suppression of polarization efficiency $p_{\max}/E(B-V)$ near $E(B-V)\approx 0.5$ mag is a projection effect, because the cumulative efficiency declines with stellar distance, whereas intrinsic alignment loss would not. The paper also finds that all measurements respect the 13 percent efficiency limit inferred from polarized dust emission. The reliable part of the data for grain-property studies is therefore the diffuse regime with $E(B-V)\lesssim 0.5$ mag, where the number of line-of-sight clouds is small.
Load-bearing premise
The claim that the efficiency drop is a projection effect depends on assuming that true loss of grain alignment would suppress the polarization-to-reddening ratio equally at every stellar distance; since faraway stars also tend to sit behind more dust, distance and reddening are degenerate, and if real alignment loss also grows over longer sightlines the reinterpretation would fail.
Editorial extensions
If this is right
- Constraints on grain size distributions drawn from the Wilking relation in the aggregated multi-band catalog are systematically biased; the intrinsic Galactic averages may be $\lambda_{\max}\approx 0.63$–$0.65\,\mu$m and $K\approx 1.0$, about 10 percent off previous values.
- The $p_{\max}/E(B-V)$ break near 0.5 mag should not be read as a drop in grain alignment efficiency, so observational tests of radiative alignment theory that rest on that break need re-examination.
- At low reddening the $\lambda_{\max}$ distribution is bimodal with modes near 0.4 and 0.6 $\mu$m, suggesting the intrinsic aligned-grain size distribution may itself be bimodal.
- Polarized dust emission, which integrates signal along the entire line of sight, should be even more sensitive to the same projection effects, so similar 3D checks are needed there.
- A constant polarization angle across wavelengths is not sufficient evidence of a single-cloud sightline; future surveys must combine polarimetry with 3D extinction and distance information.
Reading between the lines
- If the projection explanation is correct, per-cloud Serkowski parameters could in principle be recovered tomographically by pairing multi-band polarimetry with 3D dust maps, inverting the line-of-sight averaging rather than discarding contaminated sightlines.
- The paper's picture predicts a quantitative scaling: the inflation of $K/\lambda_{\max}$ should grow with the number of clouds and with the degree of magnetic-field coherence along the line of sight, which could be tested with mock sightlines built from a 3D magnetic-field model.
- A natural testable extension is to compare starlight and emission polarization on the same diffuse sightlines; if the 13 percent efficiency limit holds in both, that supports a common intrinsic alignment efficiency and confines strong projection effects to structured, multi-cloud sightlines.
Signed reviews
Editorial analysis
A structured set of objections, weighed in public.
Referee Report
Summary. The paper fits the Serkowski relation to 258 multi-band starlight polarization sightlines from the Panopoulou et al. (2023) catalog, using Bayesian methods with an informative prior linking K to lambda_max. It combines these fits with Gaia distances and 3D dust extinction maps to argue that line-of-sight (LOS) averaging over multiple clouds with different magnetic field geometries contaminates Serkowski-parameter constraints, biasing them by about 10%. The paper further analyzes pmax/E(B-V), finds a break near E(B-V)=0.5 mag, and attributes that break to projection effects rather than to an intrinsic loss of grain alignment efficiency.
Significance. If the conclusions hold, the paper would imply that published Serkowski-parameter constraints from the largest current starlight-polarization catalog are systematically biased, and that the widely discussed suppression of polarization efficiency at moderate reddening is a geometric/projection artifact rather than a direct signature of grain alignment physics. The case studies toward Berkeley 59, Taurus/Perseus, and NGC 6823 are valuable: they combine distance-resolved extinction profiles with pmax and EVPA behavior and make a convincing qualitative case that LOS integration can modify K and lambda_max even when the Serkowski fit is formally good and the EVPAs are constant. The Bayesian fitting machinery, the explicit treatment of Rice-distributed polarization likelihoods, and the conservative 0.1% uncertainty floor are also strengths. However, the quantitative claims about the size of the bias and the specific reinterpretation of the pmax/E(B-V) break are not yet established at the same level as the qualitative contamination effect.
major comments (4)
- [§3.1.2 and §4, Eq. (16)] The prior in §3.1.2 fixes K = alpha*lambda_max with alpha drawn from a Gaussian of mean 1.66, so the recovery of a linear K-lambda_max relation in Eq. (16) is guaranteed by construction. The text acknowledges this, but the same prior-dominated posterior is later used to infer an intrinsic slope K/lambda_max ~ 1.58, intrinsic values lambda_max ~ 0.63 and K ~ 1.0, and a deviating-sightline criterion K/lambda_max >= 1.75. This makes the quantitative 10%-bias claim partly circular. The authors should either repeat the analysis with a prior on K that is not tied to lambda_max, or demonstrate explicitly how strongly the posterior medians of K depend on the assumed alpha distribution.
- [§5, Fig. 11] The central reinterpretation of the pmax/E(B-V) break rests on the claim that if the suppression were due to intrinsic alignment loss it would be independent of stellar distance. That premise is asserted but not derived, and Fig. 11 does not break the distance-reddening degeneracy: E(B-V) is integrated along the line of sight to the star, so high-reddening sightlines are preferentially more distant. An intrinsic-alignment model in which polarization efficiency declines with reddening or with the reddening of the radiation field would also produce a decreasing pmax/E(B-V) versus distance. To support the projection interpretation, the authors need to control for E(B-V) when showing the distance trend (for example, by binning in E(B-V) at fixed distance or by fitting a joint model).
- [§5, Fig. 12 and §7] The quantitative intrinsic values lambda_max ~ 0.63 micron and K ~ 1.0, and the resulting '10% off' statement, are posteriors-median summaries for subsamples defined by an E(B-V) cut. No uncertainty is quoted for the 10% bias itself, and the diffuse and molecular subsamples differ simultaneously in reddening, distance, and cloud multiplicity. The authors should report the dispersion and sampling uncertainty of these medians and test whether the difference between the E(B-V)<0.5 and E(B-V)>0.5 subsamples is significant after accounting for the informative prior used in the fits.
- [§4.2 and §7, Abstract] The abstract and conclusions state that LOS integration effects contaminate 'the majority' of the existing dataset, but the paper does not supply a quantitative statistic for the fraction of the 258 sightlines that are contaminated. The detailed case studies demonstrate the effect convincingly for selected regions, and the statement that most sightlines contain multiple clouds is attributed to Mandarakas et al. (2024), but the present sample is not systematically scored with an objective criterion based on the 3D extinction profiles. A per-sightline contamination metric, or at least a statistical estimate with an uncertainty, is needed to support the majority-contamination claim.
minor comments (5)
- [§4.1.2] The region is referred to as 'Chameleon I'; the standard astronomical name is 'Chamaeleon I'. The spelling should be made consistent with the literature.
- [§5] The paper reports lambda_max ~ 0.63 micron and K ~ 1.0 against previous lambda_max ~ 0.55 micron and K ~ 0.9. These are approximately 15% and 11% differences respectively; the paper should state which quantity is meant by the '10%' bias.
- [§4.2, Fig. 9] The text refers to the 'top left panel' when describing the extinction profile toward NGC 6823, but Fig. 9 is a three-column figure without an explicit top-left layout in the caption; the reference should be clarified.
- [§2.1, Eq. (4)] The definition of Delta_theta as [max(theta_lambda)-min(theta_lambda)] divided by the quadrature sum of the uncertainties of only those two extreme bands should be justified more explicitly; it is not obvious that this is the optimal way to quantify EVPA variability across more than two bands.
- [Fig. 5 caption] The caption contains the typo 'Galatic Longitude'; it should read 'Galactic Longitude'.
Circularity Check
The recovery of the Wilking relation (Eq. 16) is admitted to be a consequence of the K = alpha lambda_max prior adopted in Sect. 3.1.2, and the 'majority contaminated' premise is imported from a co-authored paper; the projection reinterpretation itself is not circular but is confounded by distance-reddening coupling.
-
self definitional
[Sect. 3.1.2 (prior) and Sect. 4 (Wilking relation), Eq. (16)]
"We assumed that K linearly correlates with λmax as: K = αλ max. We assumed that α follows a Gaussian distribution with an average value equal to 1.66, as the optical data suggests (Wilking et al. 1980; Whittet et al. 1992; Whittet 2022). [...] Similarly to past works (Wilking et al. 1980; Whittet et al. 1992), we find a linear correlation between K and λmax. This was expected because it was assumed in the distribution of priors (Sect. 3.1.2)."
The prior enforces the relation that Sect. 4 reports as a constraint. Each K posterior is sampled with log-prior containing K = alpha lambda_max and alpha centered at 1.66 with 20% variance, so the ensemble of (lambda_max, K) medians must scatter around that line; the recovered slope 1.58 +/- 0.37 and zero intercept are the prior re-emerging, not an independent property of the data. The paper concedes this: 'This was expected because it was assumed in the distribution of priors.' Thus 'we find a linear correlation between K and lambda_max' is not a test of the Wilking relation, and downstream claims that use the resulting slope, such as the K/lambda_max >= 1.75 'deviating' criterion, inherit the same prior.
-
self citation load bearing
[Sect. 4.2, final paragraph; supported by Sect. 5 and Sect. 7]
"As noted by Mandarakas et al. (2024), the majority of LOSs in the compiled catalogue (Panopoulou et al. 2023) include multiple clouds along a LOS. Thus, existing constraints on the Serkowski parameters are biased due to projection effects."
The quantitative scope of the central claim, that the majority of sightlines are contaminated and Serkowski parameters are biased, is not derived from the present sample. The case studies (Berkeley 59, Chamaeleon I, Taurus, NGC 6823/6709/1502) demonstrate LOS effects in specific regions, but they do not quantify the 'majority' fraction. That statistic is imported from Mandarakas et al. (2024), whose authors include the present author (Skalidis); the projection interpretation additionally leans on Skalidis et al. (2024) for the rising cloud-multiplicity probability at E(B-V) >= 0.3 mag. The central premise therefore rests on a same-author citation chain rather than on an independent rederivation in this paper.
full rationale
The overall circularity is partial, so the score is 6. Step 1 is an admitted construction: the K - lambda_max prior fixes the recovered Wilking relation, and because the S/N in K is low, the diffuse-ISM median K about 1.0 is also prior-dominated. Step 2 shows that the 'majority contaminated' premise relies on a co-authored citation, although the individual case studies and 3D extinction profiles are independent evidence that LOS effects exist. The projection reinterpretation of the pmax/E(B-V) break is not circular: it uses Gaia distances and the Edenhofer et al. (2024) and Green et al. (2018) 3D maps, and a projection effect genuinely predicts a distance trend. The skeptic's distance-reddening degeneracy is a real confound, since Fig. 11 does not separate distance from E(B-V) and an intrinsic-alignment-loss model would also produce a declining trend with distance, but that is a correctness risk, not a reduction of the claim to its inputs. The Monte Carlo test of the deviating points is similarly independent of the prior mean. For these reasons the paper is not scored 8-10; it retains substantial external and independent content despite the admitted prior-driven Wilking-relation result.
Assumptions & free parameters
free parameters (4)
- Prior slope alpha of K-lambda_max relation =
Gaussian mean 1.66, 20% variance (chosen)
- EVPA variability cut Delta_theta =
kept only Delta_theta <= 1
- Deviating-point threshold K/lambda_max =
at least 1.75 at lambda_max about 0.55 micron
- Polarization uncertainty floor =
0.1%
assumptions (6)
- domain assumption The Serkowski relation (Eq. 1) is the correct functional form for optical starlight polarization spectra.
- standard math The Rice distribution applies to observed polarization fractions (Eq. 7).
- ad hoc to paper K and lambda_max are linearly related with slope about 1.66 (Wilking/Whittet), used as a prior.
- domain assumption 3D dust extinction maps (Green et al. 2018; Edenhofer et al. 2024) and Gaia parallaxes trace the line-of-sight dust distribution accurately enough to identify separate cloud contributions.
- ad hoc to paper If the pmax/E(B-V) suppression were due to intrinsic alignment loss, it would be independent of stellar distance.
- domain assumption NH/E(B-V) = 5.8 x 10^21 cm^-2 (Bohlin et al. 1978) converts reddening to column density.
Cite this review
Pith. "Pith review of Challenges in constraining dust properties from starlight polarization." pith.science (2026). https://pith.science/paper/KYHHRK62
@misc{pith2026241108971,
  author       = {Pith},
  title        = {Pith review of: Challenges in constraining dust properties from starlight polarization},
  year         = {2026},
  howpublished = {\url{https://pith.science/paper/KYHHRK62}},
  note         = {Machine review of arXiv:2411.08971}
}
read the original abstract
Dust polarization, which comes from the alignment of aspherical grains to magnetic fields, has been widely employed to study the interstellar medium (ISM) dust properties. The wavelength dependence of the degree of optical polarization, known as the Serkowski relation, was a key observational discovery that advanced grain modeling and alignment theories. However, it was recently shown that line-of-sight (LOS) variations in the structure of the ISM or the magnetic field morphology contaminate the constraints extracted from fits to the Serkowski relation. These cases can be identified by the wavelength-dependent variability in the polarization angles. We aim to investigate the extent to which we can constrain the intrinsic dust properties and alignment efficiency from dust polarization data, by accounting for LOS variations of the magnetic field morphology. We employed archival data to fit the Serkowski relation and constrain its free parameter. We explored potential imprints of LOS variations of the magnetic field morphology in these constraints. We found that these LOS integration effects contaminate the majority of the existing dataset, thus biasing the obtained Serkowski parameters by approximately 10%. The constancy of the polarization angles with wavelength does not necessarily guarantee the absence of 3D averaging effects. We examined the efficiency of dust grains in polarizing starlight, as probed by the ratio of the degree of polarization to dust reddening, E(B-V). We found that all measurements respect the limit established by polarized dust emission data. A suppression in polarization efficiencies occurs at E(B-V) close to 0.5 mag, which we attribute to projection effects and may be unrelated to the intrinsic alignment of dust grains.
Figures


Figures from the paper (8 more)




Forward citations
Cited by 2 Pith papers
-
The multiphase interstellar medium as a common origin for magnetic misalignment and TB parity violation
A two-layer, Local-Bubble projection model can plausibly explain both the HI–magnetic-field misalignment and the large-scale TB correlation in Planck polarization.
-
Extreme Starlight Polarization Efficiency Toward $\zeta$ Ophiuchi: A Case for Line-of-Sight Foreground Subtraction
V-band polarimetry of 25 stars with Gaia distances and foreground subtraction maps two dust layers toward zeta Ophiuchi, with a residual component whose average polarization efficiency is 14.1% per magnitude, above th...
Reference graph
Works this paper leans on
-
[1]
, " * write output.state after.block = add.period write newline
ENTRY address archiveprefix author booktitle chapter edition editor howpublished institution eprint journal key month note number organization pages publisher school series title type volume year label extra.label sort.label short.list INTEGERS output.state before.all mid.sentence after.sentence after.block FUNCTION init.state.consts #0 'before.all := #1 ...
-
[2]
write newline
" write newline "" before.all 'output.state := FUNCTION n.dashify 't := "" t empty not t #1 #1 substring "-" = t #1 #2 substring "--" = not "--" * t #2 global.max substring 't := t #1 #1 substring "-" = "-" * t #2 global.max substring 't := while if t #1 #1 substring * t #2 global.max substring 't := if while FUNCTION word.in bbl.in " " * FUNCTION format....
-
[3]
G., Clayton , G
Andersson , B. G., Clayton , G. C., Doney , K. D., et al. 2022, , 367, 127
2022
-
[4]
G., Lazarian , A., & Vaillancourt , J
Andersson , B. G., Lazarian , A., & Vaillancourt , J. E. 2015, , 53, 501
2015
-
[5]
Andersson , B. G. & Potter , S. B. 2007, , 665, 369
2007
-
[6]
Andersson , B. G. & Potter , S. B. 2010, , 720, 1045
2010
-
[7]
Angarita , Y., Versteeg , M. J. F., Haverkorn , M., et al. 2023, , 166, 34
2023
-
[8]
Bailer-Jones , C. A. L., Rybizki , J., Fouesneau , M., Demleitner , M., & Andrae , R. 2021, , 161, 147
2021
Show all 103 references
-
[9]
2020, , 643, A36
Bellomi , E., Godard , B., Hennebelle , P., et al. 2020, , 643, A36
2020
-
[10]
& Sternberg , A
Bialy , S. & Sternberg , A. 2019, , 881, 160
2019
-
[11]
2021, , 919, L5
Bialy , S., Zucker , C., Goodman , A., et al. 2021, , 919, L5
2021
-
[12]
2021, , 501, 3715
Blinov , D., Kiehlmann , S., Pavlidou , V., et al. 2021, , 501, 3715
2021
-
[13]
2023, , 677, A144
Blinov , D., Maharana , S., Bouzelou , F., et al. 2023, , 677, A144
2023
-
[14]
C., Savage , B
Bohlin , R. C., Savage , B. D., & Drake , J. F. 1978, , 224, 132
1978
-
[15]
& Fermi , E
Chandrasekhar , S. & Fermi , E. 1953, , 118, 113
1953
-
[16]
L., Goldsmith , P
Chapman , N. L., Goldsmith , P. F., Pineda , J. L., et al. 2011, , 741, 21
2011
-
[17]
R., et al
Chen , C.-Y., Li , Z.-Y., Mazzei , R. R., et al. 2022, , 514, 1575
2022
-
[18]
& Yoo , H
Cho , J. & Yoo , H. 2016, , 821, 21
2016
-
[19]
& Al-Roubaie , A
Clarke , D. & Al-Roubaie , A. 1984, , 206, 729
1984
-
[20]
1951, Phys
Davis, L. 1951, Phys. Rev., 81, 890
1951
-
[21]
S., et al
Doi , Y., Nakamura , K., Kawabata , K. S., et al. 2024, , 961, 13
2024
-
[22]
& Srinivasan, A
Dowle, M. & Srinivasan, A. 2023, data.table: Extension of `data.frame`, r package version 1.14.8
2023
-
[23]
2024, , 685, A82
Edenhofer , G., Zucker , C., Frank , P., et al. 2024, , 685, A82
2024
-
[24]
K., Maheswar , G., et al
Eswaraiah , C., Pandey , A. K., Maheswar , G., et al. 2012, , 419, 2587
2012
-
[25]
Gaia Collaboration , Brown , A. G. A., Vallenari , A., et al. 2021, , 649, A1
2021
-
[26]
Galli , P. A. B., Loinard , L., Bouy , H., et al. 2019, , 630, A137
2019
-
[27]
Goldsmith , P. F. 2001, , 557, 736
2001
-
[28]
F., Heyer , M., Narayanan , G., et al
Goldsmith , P. F., Heyer , M., Narayanan , G., et al. 2008, , 680, 428
2008
-
[29]
M., Schlafly , E
Green , G. M., Schlafly , E. F., Finkbeiner , D., et al. 2018, , 478, 651
2018
-
[30]
Guetter , H. H. 1992, , 103, 197
1992
-
[31]
2018, , 610, A16
Guillet , V., Fanciullo , L., Verstraete , L., et al. 2018, , 610, A16
2018
-
[32]
2023, BayesianTools: General-Purpose MCMC and SMC Samplers and Tools for Bayesian Statistics, r package version 0.1.8
Hartig, F., Minunno, F., & Paul , S. 2023, BayesianTools: General-Purpose MCMC and SMC Samplers and Tools for Bayesian Statistics, r package version 0.1.8
2023
-
[33]
2000, , 119, 923
Heiles , C. 2000, , 119, 923
2000
-
[34]
& Lebreuilly , U
Hennebelle , P. & Lebreuilly , U. 2023, , 674, A149
2023
-
[35]
Hensley , B. S. & Draine , B. T. 2021, , 906, 73
2021
-
[36]
Hensley , B. S. & Draine , B. T. 2023, , 948, 55
2023
-
[37]
2008, , 680, 420
Heyer , M., Gong , H., Ostriker , E., & Brunt , C. 2008, , 680, 420
2008
-
[38]
H., Kirby , L., Dotson , J
Hildebrand , R. H., Kirby , L., Dotson , J. L., Houde , M., & Vaillancourt , J. E. 2009, , 696, 567
2009
-
[39]
Hoang , T., Lazarian , A., & Andersson , B. G. 2015, , 448, 1178
2015
-
[40]
Hopkins , P. F. 2014, , 797, 59
2014
-
[41]
F., Rosen , A
Hopkins , P. F., Rosen , A. L., Squire , J., et al. 2022, , 517, 1491
2022
-
[42]
E., Hildebrand , R
Houde , M., Vaillancourt , J. E., Hildebrand , R. H., Chitsazzadeh , S., & Kirby , L. 2009, , 706, 1504
2009
-
[43]
& Lazarian , A
Hu , Y. & Lazarian , A. 2023, , 519, 3736
2023
-
[44]
G., Blinov , D., Ramaprakash , A
King , O. G., Blinov , D., Ramaprakash , A. N., et al. 2014, , 442, 1706
2014
-
[45]
& Hoang , T
Lazarian , A. & Hoang , T. 2007, , 378, 910
2007
-
[46]
2016, Monthly Notices of the Royal Astronomical Society, 455, 2656
Lopez-Rodriguez, E. 2016, Monthly Notices of the Royal Astronomical Society, 455, 2656
2016
-
[47]
2024, arXiv e-prints, arXiv:2409.10317
Mandarakas , N., Tassis , K., & Skalidis , R. 2024, arXiv e-prints, arXiv:2409.10317
2024 arXiv
-
[48]
G., Clayton , G
Martin , P. G., Clayton , G. C., & Wolff , M. J. 1999, , 510, 905
1999
-
[49]
Mathis , J. S. 1986, , 308, 281
1986
-
[50]
S., Rumpl , W., & Nordsieck , K
Mathis , J. S., Rumpl , W., & Nordsieck , K. H. 1977, , 217, 425
1977
-
[51]
J., Maheswar G
Medhi , B. J., Maheswar G. , Pandey , J. C., Tamura , M., & Sagar , R. 2010, , 403, 1577
2010
-
[52]
Mouschovias, T. C. 1996, in The Role of Dust in the Formation of Stars, ed. H. U. K \"a ufl & R. Siebenmorgen (Berlin, Heidelberg: Springer Berlin Heidelberg), 382--392
1996
-
[53]
& Clarke , D
Naghizadeh-Khouei , J. & Clarke , D. 1993, , 274, 968
1993
-
[54]
B., Hoang , T., Diep , P
Ngoc , N. B., Hoang , T., Diep , P. N., & Tram , L. N. 2024, , 974, 118
2024
-
[55]
C., Stone , J
Ostriker , E. C., Stone , J. M., & Gammie , C. F. 2001, , 546, 980
2001
-
[56]
2015, , 452, 715
Panopoulou , G., Tassis , K., Blinov , D., et al. 2015, , 452, 715
2015
-
[57]
V., Hensley , B
Panopoulou , G. V., Hensley , B. S., Skalidis , R., Blinov , D., & Tassis , K. 2019 a , , 624, L8
2019
-
[58]
V., Markopoulioti , L., Bouzelou , F., et al
Panopoulou , G. V., Markopoulioti , L., Bouzelou , F., et al. 2023, arXiv e-prints, arXiv:2307.05752
2023 arXiv
-
[59]
V., Psaradaki , I., & Tassis , K
Panopoulou , G. V., Psaradaki , I., & Tassis , K. 2016, , 462, 1517
2016
-
[60]
V., Tassis , K., Skalidis , R., et al
Panopoulou , G. V., Tassis , K., Skalidis , R., et al. 2019 b , , 872, 56
2019
-
[61]
2018, , 479, 1685
Papoular , R. 2018, , 479, 1685
2018
-
[62]
R., Benetti , S., et al
Patat , F., Maund , J. R., Benetti , S., et al. 2010, , 510, A108
2010
-
[63]
Patat, F., Taubenberger, S., Cox, N. L. J., et al. 2015, Astronomy & Astrophysics, 577, A53
2015
-
[64]
2011, Journal of Machine Learning Research, 12, 2825
Pedregosa, F., Varoquaux, G., Gramfort, A., et al. 2011, Journal of Machine Learning Research, 12, 2825
2011
-
[65]
2024, , 684, A162
Pelgrims , V., Mandarakas , N., Skalidis , R., et al. 2024, , 684, A162
2024
-
[66]
V., Tassis , K., et al
Pelgrims , V., Panopoulou , G. V., Tassis , K., et al. 2023, , 670, A164
2023
-
[67]
1988, in Polarized Radiation of Circumstellar Origin, ed
Piirola , V. 1988, in Polarized Radiation of Circumstellar Origin, ed. G. V. Coyne , A. M. Magalhaes , A. F. Moffat , R. E. Schulte-Ladbeck , & S. Tapia , 735--746
1988
-
[68]
2020 a , , 641, A12
Planck Collaboration , Aghanim , N., Akrami , Y., et al. 2020 a , , 641, A12
2020
-
[69]
2020 b , , 641, A12
Planck Collaboration , Aghanim , N., Akrami , Y., et al. 2020 b , , 641, A12
2020
-
[70]
2014, , 439, 4048
Plaszczynski , S., Montier , L., Levrier , F., & Tristram , M. 2014, , 439, 4048
2014
-
[71]
2008, in Society of Photo-Optical Instrumentation Engineers (SPIE) Conference Series, Vol
Potter , S., Buckley , D., O'Donoghue , D., et al. 2008, in Society of Photo-Optical Instrumentation Engineers (SPIE) Conference Series, Vol. 7014, Ground-based and Airborne Instrumentation for Astronomy II, ed. I. S. McLean & M. M. Casali , 70145E
2008
-
[72]
N., Rajarshi , C
Ramaprakash , A. N., Rajarshi , C. V., Das , H. K., et al. 2019, , 485, 2355
2019
-
[73]
S., Joshi , G
Rautela , B. S., Joshi , G. C., & Pandey , J. C. 2004, Bulletin of the Astronomical Society of India, 32, 159
2004
-
[74]
Rice , S. O. 1945, Bell System Technical Journal, 24, 46
1945
-
[75]
2024, [ [arXiv] 2311.08681 ]
Schmaltz , T., Hu , Y., & Lazarian , A. 2024, [ [arXiv] 2311.08681 ]
2024 arXiv
-
[76]
1973, in Interstellar Dust and Related Topics, ed
Serkowski , K. 1973, in Interstellar Dust and Related Topics, ed. J. M. Greenberg & H. C. van de Hulst , Vol. 52, 145
1973
-
[77]
S., & Ford , V
Serkowski , K., Mathewson , D. S., & Ford , V. L. 1975, , 196, 261
1975
-
[78]
Simmons , J. F. L. & Stewart , B. G. 1985, , 142, 100
1985
-
[79]
2023, , 673, A76
Skalidis , R., Gkimisi , K., Tassis , K., et al. 2023, , 673, A76
2023
-
[80]
F., Hopkins , P
Skalidis , R., Goldsmith , P. F., Hopkins , P. F., & Ponnada , S. B. 2024, , 682, A161
2024
-
[81]
V., Tassis , K., et al
Skalidis , R., Panopoulou , G. V., Tassis , K., et al. 2018, , 616, A52
2018
-
[82]
& Pelgrims , V
Skalidis , R. & Pelgrims , V. 2019, , 631, L11
2019
-
[83]
R., Pavlidou , V., & Tassis , K
Skalidis , R., Sternberg , J., Beattie , J. R., Pavlidou , V., & Tassis , K. 2021, , 656, A118
2021
-
[84]
& Tassis , K
Skalidis , R. & Tassis , K. 2021, , 647, A186
2021
-
[85]
V., et al
Skalidis , R., Tassis , K., Panopoulou , G. V., et al. 2022, , 665, A77
2022
-
[86]
& Hopkins , P
Squire , J. & Hopkins , P. F. 2018, , 856, L15
2018
-
[87]
& Pavlidou , V
Tassis , K. & Pavlidou , V. 2015, , 451, L90
2015
-
[88]
N., Readhead , A
Tassis , K., Ramaprakash , A. N., Readhead , A. C. S., et al. 2018, arXiv e-prints, arXiv:1810.05652
2018 arXiv
-
[89]
A., Gibson , S
Topasna , G. A., Gibson , S. D., & Kaltcheva , N. T. 2022, , 134, 084301
2022
-
[90]
2018, , 481, 5275
Tritsis , A., Federrath , C., Schneider , N., & Tassis , K. 2018, , 481, 5275
2018
-
[91]
Vaillancourt , J. E. 2006, , 118, 1340
2006
-
[92]
E., Andersson , B
Vaillancourt , J. E., Andersson , B. G., Clemens , D. P., et al. 2020, , 905, 157
2020
-
[93]
Versteeg , M. J. F., Magalh \ a es , A. M., Haverkorn , M., et al. 2023, , 165, 87
2023
-
[94]
Voshchinnikov , N. V. & Hirashita , H. 2014, , 445, 301
2014
-
[95]
Weingartner , J. C. & Draine , B. T. 2001, , 548, 296
2001
-
[96]
Weitenbeck , A. J. 2008, , 58, 433
2008
-
[97]
Whittet, D. C. B. 2022, Dust in the Galactic Environment (Third Edition), 2514-3433 (IOP Publishing)
2022
-
[98]
Whittet , D. C. B., Martin , P. G., Hough , J. H., et al. 1992, , 386, 562
1992
-
[99]
Whittet , D. C. B., Prusti , T., Franco , G. A. P., et al. 1997, , 327, 1194
1997
-
[100]
2016, ggplot2: Elegant Graphics for Data Analysis (Springer-Verlag New York)
Wickham, H. 2016, ggplot2: Elegant Graphics for Data Analysis (Springer-Verlag New York)
2016
-
[101]
A., Lebofsky , M
Wilking , B. A., Lebofsky , M. J., Martin , P. G., Rieke , G. H., & Kemp , J. C. 1980, , 235, 905
1980
-
[102]
J., Nordsieck , K
Wolff , M. J., Nordsieck , K. H., & Nook , M. A. 1996, , 111, 856
1996
-
[103]
2021, , 919, 35
Zucker , C., Goodman , A., Alves , J., et al. 2021, , 919, 35
2021
Reviewed August 12, 2026 · model on record in the stance chip above.
Discussion (0). Continue with ORCID to comment.