REVIEW 4 major objections 4 minor 69 references
HETDEX-LOFAR Spectroscopic Redshift Catalog
T0 review · 4 major / 4 minor · reviewed 2026-08-12 · deepseek-v4-flash
Pith's one-line read Blind HETDEX spectroscopy gives 9,710 LOFAR radio sources firm redshifts, most of them new.
desk verdict Useful new catalog with a real data release, but the headline sample size and validation numbers are internally inconsistent and need reconciliation. read the letter →
The pith
A machine-rendered reading of the paper's core claim, the machinery that carries it, and where it could break.
The reading
What carries the argument
The load-bearing mechanism is the redshift and classification pipeline. Diagnose is an automatic spectral classifier that fits principal-component templates for stars, galaxies, and quasars to each VIRUS-resolution spectrum by $\chi^2$ minimization and returns a label plus redshift when the best fit is statistically distinct from the second-best fit. Sources without a confident Diagnose result are matched to HDR4 catalog entries within 2 arcseconds, with an estimated spurious match fraction of about 5 percent, and the two sets of redshifts are combined through the adjudication rules in Appendix A. For the star formation analysis, the paper fits photometry plus synthetic narrowband fluxes with an energy-balance spectral energy distribution model and applies the adopted power-law form to derive the new 150 MHz luminosity, star formation rate, and stellar mass relation.
What would settle it
Take the roughly 220 sources where the two redshift estimators disagreed and observe each with an independent spectrograph covering wavelengths outside the 3470-5540 Å window; if more than about 2.3% of those targets fail to confirm the published redshift, the adjudication rules are biased and the claimed outlier fraction is too optimistic.
Extended reading notes
Core claim
The central discovery is a spectroscopic redshift catalog built from 28,705 HETDEX spectra extracted at LoTSS DR1 positions. Redshifts are assigned by an automatic classifier, supplemented by the HDR4 value-added catalog and by archival redshifts, and the paper reports that disagreements between the two main classifiers are reduced to a 2.3% outlier fraction by adjudication rules based on a Lyα classification probability, a g-band magnitude cutoff, and an AGN flag. The final sample contains 197 stars, 804 AGN, 6,394 low-redshift galaxies, 1,075 high-redshift Lyα galaxies, and 757 archival objects. For the 6,499 galaxies with $0.01<z<0.47$, the paper derives stellar masses and star formation rates and fits the mass-dependent relation $\log_{10}L_{150\,\mathrm{MHz}} = (22.341\pm0.016)+(0.526\pm0.017)\log_{10}\psi+(0.384\pm0.017)\log_{10}(M/10^{10}M_\odot)$, which has a shallower slope than three earlier relations.
Load-bearing premise
The load-bearing premise is that the rules used to decide between two disagreeing redshift measurements are correct even though those rules were invented by examining the very sources they are used to settle; if the rules misclassify even a few percent of those sources, the catalog's stated 2.3% outlier rate understates the true error and some published redshifts will be badly wrong.
Editorial extensions
If this is right
- The released catalog gives 9,710 LOFAR-selected sources a spectroscopic redshift and one of five optical labels, so the radio sample can be split into stars, AGN, and star-forming galaxies without extra follow-up.
- For the 6,499 galaxies with $0.01<z<0.47$, the release includes stellar masses and star formation rates from SED fitting, so users can study the radio-SFR connection immediately.
- The new mass-dependent 150 MHz-SFR relation gives a shallower slope than earlier fits, providing an updated calibration for low-frequency radio luminosity as an SFR tracer.
- The catalog's redshift distribution, with most sources at $z<0.5$ or $1.9<z<3.5$, directly supports studies of [O II] in low-redshift radio galaxies and Lyα in higher-redshift radio galaxies and quasars.
Reading between the lines
- Rerunning the same pipeline on the completed HETDEX survey should grow the sample to roughly 40,000 sources; the larger volume may fill in the radio luminosity extremes that the paper identifies as a possible bias in its slope.
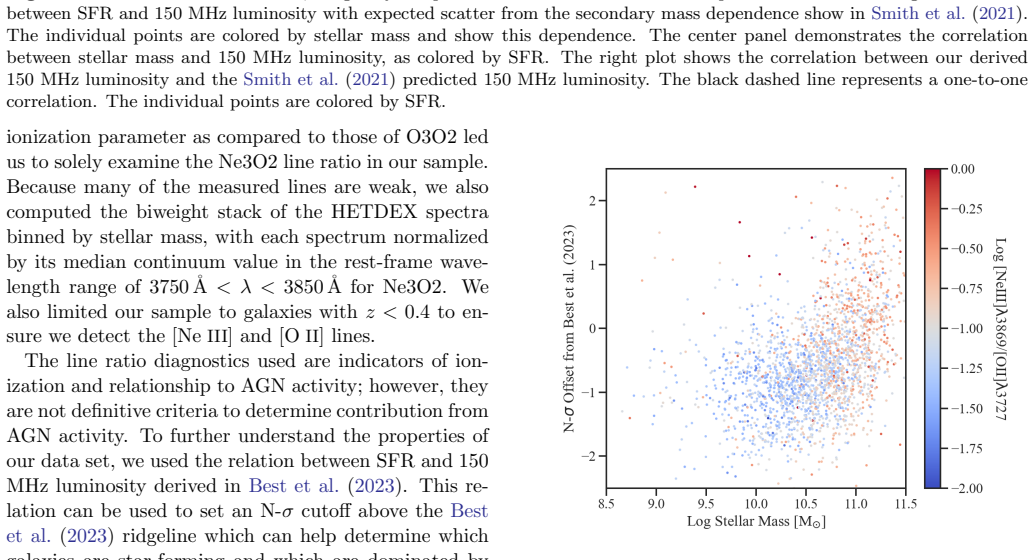
- The paper's stacked spectra by stellar mass, colored by offset from the comparison 150 MHz-SFR relation, suggest AGN contribution becomes visible above $\log_{10}(M/M_\odot)\approx10.5$; a direct follow-up could test whether that offset is driven by emission-line hardness rather than radio excess.
- The adjudication rules for discrepant redshifts were tuned on roughly 220 sources, so their transferability to other radio-optical overlap samples is an open question until an independent redshift check is run.
Signed reviews
Editorial analysis
A structured set of objections, weighed in public.
Referee Report
Summary. The paper constructs a spectroscopic redshift catalog for LoTSS DR1 sources that have fiber coverage in the HETDEX internal fourth data release. Starting from 28,705 extracted HETDEX spectra, the authors run the Diagnose classifier, supplement it with HDR4/ELiXer classifications, and add archival spectroscopic redshifts from the LoTSS value-added catalog. They report a final sample of 9,710 spectroscopic redshifts divided into five classes, and they derive stellar masses, star formation rates, and 150 MHz luminosities for a subset using MCSED fitting, including a new mass-dependent SFR-L150MHz relation. Validation includes comparisons with HDR4 redshifts, archival spectroscopic redshifts, and photometric redshifts, with quoted outlier fractions of 2.3%, 7.6%, and a photometric sigma_z of 0.0614.
Significance. If the catalog-size arithmetic is corrected and the adjudication procedure is validated, the paper is a useful data release: it combines two major surveys, provides public spectra and derived quantities on Zenodo, and offers a new SFR-L150MHz relation with quantified uncertainties. Strengths include the public Diagnose code, the reproducible pipeline description, and direct comparisons against archival spectroscopic and photometric redshifts. However, the central quantitative claim, namely the size and completeness of the final 9,710-source catalog, is currently not reproducible from the paper's own counts, so the significance of the release cannot be assessed until the inconsistencies are resolved.
major comments (4)
- [§3.6, Table 1, abstract] The five final class counts in §3.6 and Table 1 sum to 197 + 804 + 6,394 + 1,075 + 757 = 9,227, not the 9,710 stated in the same section, in Table 1, in §5, and in the abstract. Independently, the abstract's 9,087 new redshifts plus 757 ARCHIVE sources would give 9,844 if the two categories are disjoint. The headline catalog-size claim is therefore not reproducible from the text; the released catalog must be audited and either the counts or the class definitions reconciled before the quoted sample size can be accepted.
- [§5, §2.2.1, abstract] Section 5 states that the authors 'extracted 18,267 spectra from the HETDEX database,' whereas §2.2.1 and the abstract state 28,705 extracted spectra, and the same 28,705 value is used for the matching statistics in §3.2 through §3.4. This is not a cosmetic discrepancy: the extracted-spectrum total is the denominator for the catalog's completeness and matching fractions, so the paper needs to state which number is correct and correct the others.
- [§3.3, Appendix A] The outlier fraction is reduced from 6.7% to 2.3% by adjudication rules (plya cutoff 0.85, g-band cutoff 22, agn flag criteria) that were developed by inspecting the same discrepant sources to which they are then applied, and the 0.85 cutoff is calibrated using HDR4 labels that themselves inherit Diagnose classifications for g < 22 sources. The 2.3% figure is therefore an in-sample estimate rather than an unbiased validation statistic; the paper should either present it explicitly as in-sample, provide an independent validation sample, or quantify the sensitivity of the outlier fraction to the chosen cutoffs.
- [§3.4, Figure 3] The text reports 1,701 sources in common between the archival spectroscopic redshifts and the HETDEX-LOFAR catalog, while the Figure 3 caption reports 1,098 LoTSS sources with previous spectroscopic redshift counterparts. These numbers govern the archival validation sample and must be reconciled, since the quoted 7.6% outlier fraction is computed from the overlap sample.
minor comments (4)
- [§3.3] The counting in this section is internally inconsistent: 6,480 confident Diagnose classifications plus 21,081 sources without a reliable classification plus 998 sources with insufficient spectral coverage sums to 28,559, not the stated 28,705 LoTSS sources, leaving 146 sources unaccounted for.
- [Appendix A, Figure 12] The phrase 'plya classifcation' is misspelled consistently in the text and figure; it should be 'plya classification'. The paper also uses 'ELiXer' and 'ElixerWidget' interchangeably with HDR4, and this terminology should be unified.
- [§4.2] The sentence saying that all galaxies have SFR and stellar mass estimates derived from 'energy balance spectral energy distribution fitting using redshifts and aperture-matched forced photometry from the LoTSS Deep Fields data release' appears to reference the LoTSS Deep Fields rather than the LoTSS DR1 value-added catalog used elsewhere; please clarify which photometry and catalog is meant.
- [Abstract] The phrase 'the highest substantial fraction of LOFAR galaxies with spectroscopic redshift information' is vague; the authors should specify the comparison sample or quantity used to justify this claim.
Circularity Check
Catalog redshifts are genuine measurements, but the internal HDR4-Diagnose agreement is partly built-in by construction (as the paper concedes), and the Appendix A adjudication rules are calibrated in-sample on the very sources they resolve, so the quoted 2.3% outlier fraction is a training-set statistic rather than an independent validation.
-
self definitional
[Section 3.3 (Combining Diagnose and HDR4), paragraph 2]
"When comparing the sources with both a Diagnose and HDR4 redshift, we find good agreement, with 92.3% of the objects agreeing to within Δz = 0.05. This is not entirely surprising as the HDR4 classification scheme uses Diagnose for sources with continuum g-band magnitudes brighter than 22."
The 92.3% agreement is presented as mutual validation of two redshift determinations, but for sources with g<22 the HDR4 label IS a Diagnose label, so that subset agrees with itself by construction. The agreement statistic therefore cannot independently confirm Diagnose's reliability; it is partially a self-comparison. The paper openly concedes this, and independent content survives only through the g>22 subset and the separate archival comparison, which shows a notably higher outlier fraction (7.6%).
-
fitted input called prediction
[Appendix A (Diagnose and HDR4 Redshift) and Section 3.3, final paragraph]
"In order to utilize this probability, we determined a cutoff of ‘plya classification’ = 0.85 using the HDR4 classification scheme that uses Diagnose redshifts for g-band magnitudes brighter than 22. ... After applying all of the criteria to the different groups of spurious matches, the outlier fraction reduces from 6.7% to 2.3%."
The rules that decide between conflicting Diagnose and HDR4 redshifts were calibrated on the same ~220 discrepant sources they are then used to adjudicate, with HDR4 labels (themselves Diagnose-derived for g<22) treated as ground truth. The post-adjudication outlier fraction of 2.3% is therefore an in-sample error estimate on the training set, not an out-of-sample validation; its value is forced by the fitted cutoff and inherits the HDR4-Diagnose dependence. The independent archival comparison grounds the catalog overall but does not validate the 2.3% figure.
full rationale
The central product of this paper is a measured catalog: spectroscopic redshifts extracted from VIRUS spectra of LoTSS positions, with assignments from the Diagnose code, the HDR4 catalog, and archival sources. Redshifts are read off real spectral features, so the catalog is not a derived quantity equivalent to its inputs. Independent external grounding exists: 1,701 overlaps with archival spectroscopic redshifts give σz = 0.0002 with a 7.6% outlier fraction, and the photometric comparison gives σz = 0.0614, providing support not traceable to the paper's own pipeline. The SFR-L150MHz fit is a genuine empirical fit to MCSED-derived quantities and is benchmarked against Gürkan et al. (2018), Smith et al. (2021), and Das et al. (2024), so it is not circular. Two partial circularities do exist and are flagged above. First, the 92.3% HDR4-Diagnose agreement is partly built-in because HDR4 uses Diagnose for g<22 sources; the paper itself concedes this, and the concession is in-scope evidence weighing against treating 92.3% as independent validation. Second, the Appendix A plya cutoff and magnitude rules were calibrated on the same discrepant sources they resolve, using ground truth that partially derives from Diagnose, so the headline reliability statistic (outlier fraction reduced to 2.3%) is an in-sample number. The affected subset is roughly 220 of 9,710 sources, and archival comparisons provide some external control, so the circularity is partial rather than total. Separately, but not circularity: the paper's own arithmetic does not reproduce the headline total (197+804+6,394+1,075+757 = 9,227, not 9,710; and 9,087 new + 757 archival = 9,844; Section 5 also gives 18,267 extractions versus 28,705 elsewhere). These inconsistencies are reproducibility and correctness concerns that compound the reliability question, but they are not reductions-by-construction and do not by themselves raise the circularity score.
Assumptions & free parameters
free parameters (4)
- SFR-L150MHz relation parameters (log10 LC, beta, gamma) =
log10 LC = 22.341 +/- 0.016, beta = 0.526 +/- 0.017, gamma = 0.384 +/- 0.017
- Stellar mass cut for SFR-L150MHz fit =
log10(M/Msun) < 11.0
- plya classification cutoff =
0.85
- g-band magnitude cutoff for redshift adjudication =
22
assumptions (6)
- domain assumption Flat Lambda-CDM cosmology with H0 = 67.66 km/s/Mpc and Omega_m = 0.30966 (Planck 2020) is used to compute luminosities and distances.
- domain assumption Redrock PCA templates capture the spectral diversity of stars, galaxies, and quasars at VIRUS resolution.
- domain assumption A Moffat PSF with beta = 3.5 and the differential atmospheric refraction model describe the VIRUS fiber light distribution.
- domain assumption The 2D uniform plus Gaussian model in matching offset space gives a reliable spurious match fraction of about 5% at a 2 arcsecond radius.
- domain assumption HDR4 catalog classifications and redshifts are reliable for sources with strong emission lines.
- domain assumption The MCSED SED model (FSPS stellar library, Chabrier IMF, Calzetti dust, fixed log U = -2.5, non-parametric SFH) yields unbiased stellar masses and star formation rates.
Cite this review
Pith. "Pith review of HETDEX-LOFAR Spectroscopic Redshift Catalog." pith.science (2026). https://pith.science/paper/KPV5SOWT
@misc{pith2026241108974,
  author       = {Pith},
  title        = {Pith review of: HETDEX-LOFAR Spectroscopic Redshift Catalog},
  year         = {2026},
  howpublished = {\url{https://pith.science/paper/KPV5SOWT}},
  note         = {Machine review of arXiv:2411.08974}
}
abstract
We combine the power of blind integral field spectroscopy from the Hobby-Eberly Telescope (HET) Dark Energy Experiment (HETDEX) with sources detected by the Low Frequency Array (LOFAR) to construct the HETDEX-LOFAR Spectroscopic Redshift Catalog. Starting from the first data release of the LOFAR Two-metre Sky Survey (LoTSS), including a value-added catalog with photometric redshifts, we extracted 28,705 HETDEX spectra. Using an automatic classifying algorithm, we assigned each object a star, galaxy, or quasar label along with a velocity/redshift, with supplemental classifications coming from the continuum and emission line catalogs of the internal, fourth data release from HETDEX (HDR4). We measured 9,087 new redshifts; in combination with the value-added catalog, our final spectroscopic redshift sample is 9,710 sources. This new catalog contains the highest substantial fraction of LOFAR galaxies with spectroscopic redshift information; it improves archival spectroscopic redshifts, and facilitates research to determine the [O II] emission properties of radio galaxies from $0.0 < z < 0.5$, and the Ly$\alpha$ emission characteristics of both radio galaxies and quasars from $1.9 < z < 3.5$. Additionally, by combining the unique properties of LOFAR and HETDEX, we are able to measure star formation rates (SFR) and stellar masses. Using the Visible Integral-field Replicable Unit Spectrograph (VIRUS), we measure the emission lines of [O III], [Ne III], and [O II] and evaluate line-ratio diagnostics to determine whether the emission from these galaxies is dominated by AGN or star formation and fit a new SFR-L$_{150MHz}$ relationship.
Figures


Figures from the paper (11 more)




Reference graph
Works this paper leans on
-
[1]
Abolfathi, B., Aguado, D. S., Aguilar, G., et al. 2018, ApJS, 235, 42, doi: 10.3847/1538-4365/aa9e8a
- [2]
-
[3]
F., Argudo-Fern´ andez, M., et al
Almeida, A., Anderson, S. F., Argudo-Fern´ andez, M., et al. 2023, ApJS, 267, 44, doi: 10.3847/1538-4365/acda98
-
[4]
Baldwin, J. A., Phillips, M. M., & Terlevich, R. 1981, PASP, 93, 5, doi: 10.1086/130766
doi:10.1086/130766 1981
-
[5]
1994, A&AS, 106, 275
Bertelli, G., Bressan, A., Chiosi, C., Fagotto, F., & Nasi, E. 1994, A&AS, 106, 275
1994
-
[6]
2014, MNRAS, 445, 955, doi: 10.1093/mnras/stu1776
Sabater, J. 2014, MNRAS, 445, 955, doi: 10.1093/mnras/stu1776
-
[7]
N., Kondapally, R., Williams, W
Best, P. N., Kondapally, R., Williams, W. L., et al. 2023, MNRAS, 523, 1729, doi: 10.1093/mnras/stad1308
-
[8]
Bolton, A. S., Schlegel, D. J., Aubourg, ´E., et al. 2012, AJ, 144, 144, doi: 10.1088/0004-6256/144/5/144
Show all 69 references
-
[9]
2013, MNRAS, 436, 3759, doi: 10.1093/mnras/stt1879
Bonzini, M., Padovani, P., Mainieri, V., et al. 2013, MNRAS, 436, 3759, doi: 10.1093/mnras/stt1879
2013 doi
-
[10]
J., Brunetti, G., et al
Botteon, A., van Weeren, R. J., Brunetti, G., et al. 2020, MNRAS, 499, L11, doi: 10.1093/mnrasl/slaa142
2020 doi
-
[11]
P., Zeimann, G
Bowman, W. P., Zeimann, G. R., Nagaraj, G., et al. 2020, ApJ, 899, 7, doi: 10.3847/1538-4357/ab9f3c
2020 doi
-
[12]
J., Conroy, C., & Johnson, B
Byler, N., Dalcanton, J. J., Conroy, C., & Johnson, B. D. 2017, ApJ, 840, 44, doi: 10.3847/1538-4357/aa6c66
2017 doi
-
[13]
C., et al
Calzetti, D., Armus, L., Bohlin, R. C., et al. 2000, ApJ, 533, 682, doi: 10.1086/308692
2000 doi
-
[14]
2023, MNRAS, 526, 3273, doi: 10.1093/mnras/stad2597
Cappellari, M. 2023, MNRAS, 526, 3273, doi: 10.1093/mnras/stad2597
2023 doi
-
[15]
2003, PASP, 115, 763, doi: 10.1086/376392
Chabrier, G. 2003, PASP, 115, 763, doi: 10.1086/376392
2003 doi
-
[16]
C., Magnier, E
Chambers, K. C., Magnier, E. A., Metcalfe, N., et al. 2016, arXiv e-prints, arXiv:1612.05560. https://arxiv.org/abs/1612.05560
2016 arXiv
-
[17]
J., Cotton, W
Condon, J. J., Cotton, W. D., & Broderick, J. J. 2002, AJ, 124, 675, doi: 10.1086/341650
2002 doi
-
[18]
Conroy, C., & Gunn, J. E. 2010, FSPS: Flexible Stellar Population Synthesis, Astrophysics Source Code Library, record ascl:1010.043
2010
-
[19]
E., & White, M
Conroy, C., Gunn, J. E., & White, M. 2009, ApJ, 699, 486, doi: 10.1088/0004-637X/699/1/486
2009 doi
-
[20]
M., Timmerman, R., Miley, G
Cordun, C. M., Timmerman, R., Miley, G. K., et al. 2023, A&A, 676, A29, doi: 10.1051/0004-6361/202346320
2023 doi
-
[21]
C., Abrams, D
Dalton, G., Trager, S. C., Abrams, D. C., et al. 2012, in Society of Photo-Optical Instrumentation Engineers (SPIE) Conference Series, Vol. 8446, Ground-based and Airborne Instrumentation for Astronomy IV, ed. I. S
2012
-
[22]
McLean, S. K. Ramsay, & H. Takami, 84460P, doi: 10.1117/12.925950 15
-
[23]
C., et al
Dalton, G., Trager, S., Abrams, D. C., et al. 2014, in Society of Photo-Optical Instrumentation Engineers (SPIE) Conference Series, Vol. 9147, Ground-based and Airborne Instrumentation for Astronomy V, ed. S. K
2014
-
[24]
Ramsay, I. S. McLean, & H. Takami, 91470L, doi: 10.1117/12.2055132
-
[25]
Das, S., Smith, D. J. B., Haskell, P., et al. 2024, MNRAS, 531, 977, doi: 10.1093/mnras/stae1204
2024 doi
-
[26]
R., Lund, M
Davies, G. R., Lund, M. N., Miglio, A., et al. 2017, A&A, 598, L4, doi: 10.1051/0004-6361/201630066
2017 doi
-
[27]
M., et al
Davis, D., Gebhardt, K., Cooper, E. M., et al. 2023, ApJ, 946, 86, doi: 10.3847/1538-4357/acb0ca De Zotti, G., Bonato, M., & Cai, Z.-Y. 2019, in 3rd Cosmology School, Introduction to Cosmology, ed. K. Bajan, M. Biernacka, & A. Pollo, Vol. 9, 125–150, doi: 10.48550/arXiv.1802.06561
-
[28]
2024, Diagnose
Debski, M., & Zeimann, G. 2024, Diagnose. https://doi.org/10.5281/zenodo.13755510
2024 doi
- [29]
-
[30]
J., Sabater, J., R¨ ottgering, H
Duncan, K. J., Sabater, J., R¨ ottgering, H. J. A., et al. 2019, A&A, 622, A3, doi: 10.1051/0004-6361/201833562
2019 doi
-
[31]
2012, A&A Rv, 20, 54, doi: 10.1007/s00159-012-0054-z
Feretti, L., Giovannini, G., Govoni, F., & Murgia, M. 2012, A&A Rv, 20, 54, doi: 10.1007/s00159-012-0054-z
2012 doi
-
[32]
J., Korista, K
Ferland, G. J., Korista, K. T., Verner, D. A., et al. 1998, PASP, 110, 761, doi: 10.1086/316190
1998 doi
- [33]
-
[34]
W., Lang, D., & Goodman, J
Foreman-Mackey, D., Hogg, D. W., Lang, D., & Goodman, J. 2013, PASP, 125, 306, doi: 10.1086/670067
2013 doi
-
[35]
2019, The Journal of Open Source Software, 4, 1864, doi: 10.21105/joss.01864
Foreman-Mackey, D., Farr, W., Sinha, M., et al. 2019, The Journal of Open Source Software, 4, 1864, doi: 10.21105/joss.01864
2019 doi
-
[36]
2021, ApJ, 923, 217, doi: 10.3847/1538-4357/ac2e03
Gebhardt, K., Mentuch Cooper, E., Ciardullo, R., et al. 2021, ApJ, 923, 217, doi: 10.3847/1538-4357/ac2e03
2021 doi
-
[37]
2000, VizieR Online Data Catalog: Low-mass stars evolutionary tracks & isochrones (Girardi+, 2000), VizieR On-line Data Catalog: J/A+AS/141/371
Girardi, L., Bressan, A., Bertelli, G., & Chiosi, C. 2000, VizieR Online Data Catalog: Low-mass stars evolutionary tracks & isochrones (Girardi+, 2000), VizieR On-line Data Catalog: J/A+AS/141/371. Originally published in: 2000A&AS..141..371G
2000
-
[38]
J., Duncan, K
Gloudemans, A. J., Duncan, K. J., R¨ ottgering, H. J. A., et al. 2021, A&A, 656, A137, doi: 10.1051/0004-6361/202141722
2021 doi
-
[39]
2017, Astronomy Reports, 61, 288, doi: 10.1134/S1063772917040059 G¨ urkan, G., Hardcastle, M
Grainge, K., Alachkar, B., Amy, S., et al. 2017, Astronomy Reports, 61, 288, doi: 10.1134/S1063772917040059 G¨ urkan, G., Hardcastle, M. J., Smith, D. J. B., et al. 2018, MNRAS, 475, 3010, doi: 10.1093/mnras/sty016
2017 doi
-
[40]
K., et al
Heesen, V., Brinks, E., Leroy, A. K., et al. 2014, AJ, 147, 103, doi: 10.1088/0004-6256/147/5/103
2014 doi
-
[41]
J., Lee, H., MacQueen, P
Hill, G. J., Lee, H., MacQueen, P. J., et al. 2021, AJ, 162, 298, doi: 10.3847/1538-3881/ac2c02
2021 doi
-
[42]
1986, PASP, 98, 609, doi: 10.1086/131801
Horne, K. 1986, PASP, 98, 609, doi: 10.1086/131801
1986 doi
-
[43]
2023, A&A, 674, A198, doi: 10.1051/0004-6361/202245691
Kukreti, P., Morganti, R., Tadhunter, C., & Santoro, F. 2023, A&A, 674, A198, doi: 10.1051/0004-6361/202245691
2023 doi
-
[44]
M., & Richardson, M
Levesque, E. M., & Richardson, M. L. A. 2014, ApJ, 780, 100, doi: 10.1088/0004-637X/780/1/100
2014 doi
-
[45]
2008, A&A, 482, 883, doi: 10.1051/0004-6361:20078467 Mentuch Cooper, E., Gebhardt, K., Davis, D., et al
Marigo, P., Girardi, L., Bressan, A., et al. 2008, A&A, 482, 883, doi: 10.1051/0004-6361:20078467 Mentuch Cooper, E., Gebhardt, K., Davis, D., et al. 2023, ApJ, 943, 177, doi: 10.3847/1538-4357/aca962
2008 doi
-
[46]
H., Hardcastle, M
Mingo, B., Croston, J. H., Hardcastle, M. J., et al. 2019, MNRAS, 488, 2701, doi: 10.1093/mnras/stz1901
2019 doi
-
[47]
H., Best, P
Mingo, B., Croston, J. H., Best, P. N., et al. 2022, MNRAS, 511, 3250, doi: 10.1093/mnras/stac140
2022 doi
-
[48]
Moffat, A. F. J. 1969, A&A, 3, 455
1969
-
[49]
G., Brammer, G
Momcheva, I. G., Brammer, G. B., van Dokkum, P. G., et al. 2016, ApJS, 225, 27, doi: 10.3847/0067-0049/225/2/27
2016 doi
-
[50]
2006, A&A, 459, 85, doi: 10.1051/0004-6361:20065216
Nagao, T., Maiolino, R., & Marconi, A. 2006, A&A, 459, 85, doi: 10.1051/0004-6361:20065216
2006 doi
-
[51]
I., et al
Padovani, P., Bonzini, M., Kellermann, K. I., et al. 2015, MNRAS, 452, 1263, doi: 10.1093/mnras/stv1375
2015 doi
-
[52]
I., et al
Padovani, P., Miller, N., Kellermann, K. I., et al. 2011, ApJ, 740, 20, doi: 10.1088/0004-637X/740/1/20
2011 doi
-
[53]
L., Daddi, E., et al
Pannella, M., Carilli, C. L., Daddi, E., et al. 2009, ApJL, 698, L116, doi: 10.1088/0004-637X/698/2/L116 Planck Collaboration, Aghanim, N., Akrami, Y., et al. 2020, A&A, 641, A6, doi: 10.1051/0004-6361/201833910
2009 doi
-
[54]
W., Adams, M
Ramsey, L. W., Adams, M. T., Barnes, T. G., et al. 1998, in Society of Photo-Optical Instrumentation Engineers (SPIE) Conference Series, Vol. 3352, Advanced Technology Optical/IR Telescopes VI, ed. L. M. Stepp, 34–42, doi: 10.1117/12.319287
1998 doi
-
[55]
N., & LOF AR Collaboration
Sabater, J., Best, P. N., & LOF AR Collaboration. 2019, in Highlights on Spanish Astrophysics X, ed. B. Montesinos, A. Asensio Ramos, F. Buitrago, R. Sch¨ odel, E. Villaver, S. P´ erez-Hoyos, & I. Ord´ o˜ nez-Etxeberria, 231–231
2019
-
[56]
W., R¨ ottgering, H
Shimwell, T. W., R¨ ottgering, H. J. A., Best, P. N., et al. 2017, A&A, 598, A104, doi: 10.1051/0004-6361/201629313
2017 doi
-
[57]
W., Tasse, C., Hardcastle, M
Shimwell, T. W., Tasse, C., Hardcastle, M. J., et al. 2019, A&A, 622, A1, doi: 10.1051/0004-6361/201833559
2019 doi
-
[58]
2001, AJ, 122, 1172, doi: 10.1086/322105 16
Ehle, M. 2001, AJ, 122, 1172, doi: 10.1086/322105 16
2001 doi
-
[59]
Smith, D. J. B., Best, P. N., Duncan, K. J., et al. 2016, in SF2A-2016: Proceedings of the Annual meeting of the French Society of Astronomy and Astrophysics, ed. C. Reyl´ e, J. Richard, L. Cambr´ esy, M. Deleuil, E. P´ econtal, L. Tresse, & I. Vauglin, 271–280. https://arxiv....
2016 arXiv
-
[60]
Smith, D. J. B., Haskell, P., G¨ urkan, G., et al. 2021, A&A, 648, A6, doi: 10.1051/0004-6361/202039343
2021 doi
- [61]
-
[62]
P., R¨ ottgering, H
Venemans, B. P., R¨ ottgering, H. J. A., Miley, G. K., et al. 2007, A&A, 461, 823, doi: 10.1051/0004-6361:20053941
2007 doi
- [63]
-
[64]
L., Hardcastle, M
Williams, W. L., Hardcastle, M. J., Best, P. N., et al. 2019, A&A, 622, A2, doi: 10.1051/0004-6361/201833564
2019 doi
-
[65]
L., Eisenhardt, P
Wright, E. L., Eisenhardt, P. R. M., Mainzer, A. K., et al. 2010, AJ, 140, 1868, doi: 10.1088/0004-6256/140/6/1868
2010 doi
-
[66]
2013, ApJ, 769, 79, doi: 10.1088/0004-637X/769/1/79
Wylezalek, D., Galametz, A., Stern, D., et al. 2013, ApJ, 769, 79, doi: 10.1088/0004-637X/769/1/79
2013 doi
-
[67]
A., et al
Yue, M., Eilers, A.-C., Simcoe, R. A., et al. 2023, ApJ, 950, 105, doi: 10.3847/1538-4357/accf20
2023 doi
-
[68]
S., Reddy, N
Yun, M. S., Reddy, N. A., & Condon, J. J. 2001, ApJ, 554, 803, doi: 10.1086/323145
2001 doi
-
[69]
R., Debski, M
Zeimann, G. R., Debski, M. H., Schneider, D. P., et al. 2024, ApJ, 966, 14, doi: 10.3847/1538-4357/ad35b8 17 APPENDIX A. DIAGNOSE AND HDR4 REDSHIFT There were 149 sources with 2 .0 < zHDR 4 < 3.5 and 0.0 < zDiagnose < 0.5, which demonstrate the common issue of Diagnose identif...
2024 doi
Reviewed August 12, 2026 · model on record in the stance chip above.
Discussion (0). Continue with ORCID to comment.