REVIEW 4 major objections 5 minor 80 references
Rapid identification of lensed type Ia supernovae with color-magnitude selection
T0 review · 4 major / 5 minor · reviewed 2026-08-12 · deepseek-v4-flash
Pith's one-line read The paper claims that a modified 'red limit' in color-magnitude space can pick out strongly lensed type Ia supernovae from unlensed ones across redshifts up to z=3.
desk verdict Useful incremental step, but the headline efficiencies are in-sample and the CC contamination claim is contradicted by the paper's own observed sample. read the letter →
The pith
A machine-rendered reading of the paper's core claim, the machinery that carries it, and where it could break.
The reading
What carries the argument
The central object is the observed color-magnitude diagram (CMD) built from SALT2 light-curve simulations and lensing observables; the load-bearing device is the proposed red limit, a straight line in that plane. The light curves are evaluated at fixed observer-frame epochs, three days before and seven days after the $i$-band peak, for both unresolved total flux and resolved individual images. The red limit does the selection: points above the line are candidates for lensed SNe Ia, and the analysis maps how the lensed and unlensed populations fall on either side under varying redshift, phase, and supernova type.
What would settle it
Run the proposed red limits on the first season of real LSST difference-imaging detections with spectroscopic classifications, and compare the fraction of confirmed unlensed SNe Ia that fall above the limit to the simulated 91–99% rejection; if real photometric noise, detection thresholds, or PSF-blended images push ordinary SNe Ia above the line more often, the reported efficiencies will not reproduce.
Extended reading notes
Core claim
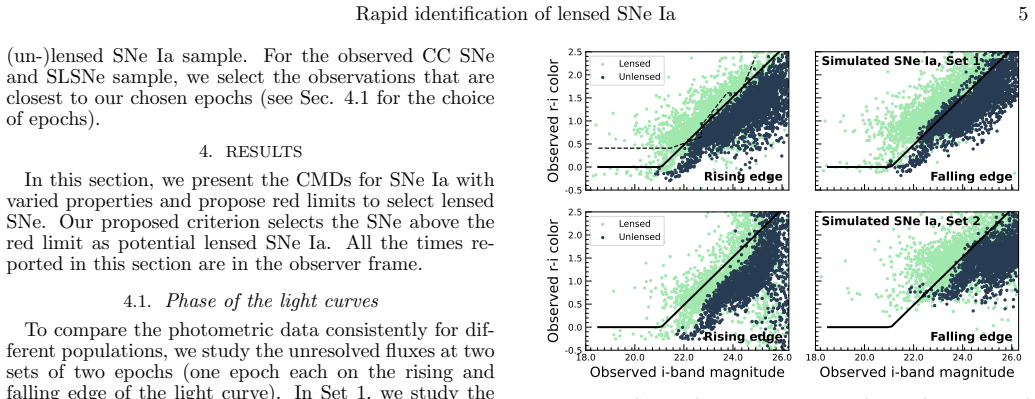
The paper's central claim is that a subset of strongly lensed SNe Ia occupies a region of the observed color-magnitude diagram that unlensed SNe Ia do not, and that a straight-line boundary captures this separation. Lensing magnification makes the supernova appear brighter, while the preferentially higher source redshifts shift its spectral energy distribution redward, pushing candidates above the boundary. The proposed modified red limit is $m_r-m_i > 0.52 m_i - 10.96$ when $m_i > 21.02$ for sources with $z<1.64$, and $m_z-m_y > 0.59 m_y - 13.67$ when $m_y > 23.63$ for $1.64<z<3$. In simulations, the low-redshift cut selects about 44% of lensed SNe Ia while rejecting about 99% of unlensed SNe Ia on the rising edge, and about 67% versus 91% on the falling edge; the high-redshift cut selects about 46% and 45% on the two edges while rejecting 99.5% and 98%. The same limit also selects the known lensed systems PS1-10afx, iPTF16geu, and SN Zwicky in archival photometry.
Load-bearing premise
The analysis assumes that the simulated photometry of lensed and unlensed supernovae, produced without noise, detection limits, PSF size, cadence, or microlensing, is representative of real LSST observations.
Editorial extensions
If this is right
- If the limit holds in real LSST data, transient alert streams could be filtered in near-real time, cutting the millions of alerts down to a few hundred candidate lensed SNe Ia before spectroscopy is triggered.
- The method works on the falling edge of the light curve, so supernovae discovered near peak, when falling-phase follow-up is the norm, can still be selected rather than only those caught while rising.
- The high-redshift extension using $z-y$ color and $y$-band magnitude opens the selection to lensed SNe Ia out to $z=3$, beyond the reach of the original red limit.
- Contamination from unlensed core-collapse supernovae is predicted to be negligible, while a small fraction of lensed Type Ib and Ic supernovae may be flagged as candidates.
- Archival tests with the known lensed systems PS1-10afx, iPTF16geu, and SN Zwicky place them above the limit, while most observed unlensed SNe Ia and superluminous supernovae fall below it.
Reading between the lines
- Beyond the paper: if the red limit is confirmed on real LSST alerts, it could be combined with light-curve shape or host-galaxy proximity checks to build a fully automated lensed-SN candidate pipeline rather than a single-epoch cut.
- Beyond the paper: the same logic, magnification plus redshift pushing a standard candle redward, might extend to selecting magnified quasars or other standardizable transients, although the paper only tests supernovae.
- Beyond the paper: microlensing was deliberately excluded, and since early-time lensed SN Ia colors are nearly achromatic, a multi-epoch requirement that an object stay above the line on consecutive nights could suppress microlensing-induced scatter in a real survey.
Editorial analysis
A structured set of objections, weighed in public.
Referee Report
Summary. The paper proposes a color-magnitude (CM) selection criterion for identifying strongly lensed type Ia supernovae (SNe Ia) in LSST-era surveys. The authors simulate LSST-like photometry of lensed and unlensed SNe Ia using SNCosmo and lensing observables from a realistic lens population, and show that a subset of lensed SNe Ia occupy a redder region of the CM plane than unlensed SNe Ia on both rising and falling phases of the light curve and out to z=3. They define a modified 'red limit' (Eqs. 6 and 7), report selection efficiencies of roughly 44-67% of lensed SNe Ia at 91-99.5% rejection of unlensed SNe Ia, find negligible simulated contamination from unlensed core-collapse SNe, and validate the criterion against archival samples of SNe Ia, CC SNe, SLSNe, and three known lensed SNe. The central claim is that the modified red limit is a rapid, effective pre-filter for lensed SNe Ia candidates in LSST alerts.
Significance. If the claimed separation and rejection rates hold under realistic survey conditions, this would be a practically useful, inexpensive filter for a regime (lensed SNe Ia) that is scientifically valuable but extremely rare. The paper's strengths include the use of a realistic lens population from the HSC catalog, the extension of CM selection to the falling edge and to z=3 via z-y colors, and the independent check against the known lensed systems PS1-10afx, iPTF16geu, and SN Zwicky, which do lie above the proposed limit. The pipeline is built from public tools (SNCosmo, Glafic, SNData) and the methodology is reproducible in principle. However, the quantitative efficiency claims are weakened by in-sample fitting of the selection curve and by an unresolved internal contradiction between the simulated CC contamination estimate and the observed CC validation sample; these issues must be addressed before the headline numbers can be taken at face value.
major comments (4)
- [4.4-4.5 and Abstract] There is a direct internal contradiction in the core-collapse contamination estimate. Section 4.4 concludes from simulations that contamination by unlensed CC SNe is 'very low to negligible (<0.05%)', and the abstract repeats this. Section 4.5, applying the same limit to the observed SDSS-II CC SNe, states that 'the cut is, however, found to select a majority of the low redshift unlensed CC SNe sample.' Since CC SNe vastly outnumber lensed SNe Ia in an LSST alert stream, a majority selection of observed CC SNe would dominate the candidate list even if the simulated CC rejection fractions are correct. The authors attribute the discrepancy to a small sample and defer a full study, but the tension is not resolved: either the simulated CC templates or luminosity functions are too faint or too blue, the red limit is not robust to real CC SEDs, or the bandpass mismatch makes the validation invalid for LSST. In any of these cases, the quantitative rejection claim in the abstract and Sec. 4.4 is not supported by the paper's own evidence. This must be resolved by either re-fitting the CC simulation ingredients, quantifying the expected number of CC SNe passing the cut relative to lensed SNe Ia using realistic number densities, or explicitly retracting the '<0.05%' claim.
- [4.1, Eqs. (6)-(7)] The selection efficiencies (≈44%/67% for Set 1 low-z, ≈46%/45% for high-z) are computed on the same simulated distributions that were used to fit the modified red limit. The curve in Eq. (6) is described as selected to 'better suit our Set 1 distribution,' and the reported completeness figures are therefore in-sample calibration, not independent predictions. The paper should either perform out-of-sample validation (e.g., fitting on one simulation draw and testing on an independent draw, or a cross-validation split) or clearly state that the reported numbers are in-sample efficiencies that may overstate performance when applied to real data.
- [2.3, 4.1, 5] The simulations contain no photometric noise, detection limits, PSF size, cadence, or microlensing, as the authors acknowledge in Sec. 2.3 and Sec. 5. These are not minor omissions for a method whose purpose is to filter LSST alerts: real detections will be biased toward brighter, noisier, and epoch-restricted light curves, and photometric scatter will smear objects across the sharp red limit in Eqs. (6)-(7). The paper already notes a companion study that injects SNe into HSC data with an LSST-like cadence, which is appropriate, but as it stands the quantitative LSST applicability of Sec. 4.1 is not established. I recommend that the paper either present the idealized efficiencies as upper limits with an explicit caveat, or include a simple noise-injection experiment (e.g., adding magnitude errors and a detection threshold) to show how the efficiencies degrade.
- [3 and 4.5] The observed validation uses photometry from survey-specific r/i bands (DES, ESSENCE, JLA, ZTF, SDSS) that differ from the LSST bandpasses for which the red limit was defined. The paper acknowledges this in Sec. 4.5 but does not quantify the effect. As a result, the 'works well on observed data' claim is qualitative and cannot be used to independently confirm the simulated rejection percentages. The authors should either apply bandpass corrections (or approximate transformations) to place the observed data on the LSST system, or explicitly restrict the validation claim to a demonstration of qualitative separation without quoting effective rejection rates.
minor comments (5)
- [3] Sec. 3 contains a typo: 'Trasient' should be 'Transient' in 'Zwicky Trasient Facility'.
- [4.1] The units for the magnitude and color in Eqs. (6) and (7) are not stated; since the paper defines AB magnitudes, it would be helpful to write 'magnitudes in AB' explicitly near the equations. Also, the thresholds 21.02 and 23.63 should be described as apparent i- and y-band magnitudes, respectively.
- [4.5 / Fig. 5] The text says the criterion 'selects the known lensed SNe Ia systems on the falling edges of respective light curves,' but Fig. 5 shows both rising and falling edge panels. Please clarify whether the known lensed systems are selected on both edges or only the falling edge, and whether the rising-edge panels are also consistent with the textual claim.
- [2.3 / 5] The phrase 'Mane et al., 2025, in prep.' is not a citable reference; if the companion study is not yet public, it should be referred to as 'companion study in preparation' in the text and omitted from the reference list, or the arXiv number should be provided if posted.
- [Data Availability] The data availability statement says 'All simulated data are available from the corresponding author upon request.' For reproducibility, it would be better to place the simulation scripts, the HSC galaxy catalog subset, and the generated light curves in a public repository (e.g., Zenodo or GitHub), since the paper aims to provide a practical filter for LSST.
Circularity Check
Headline lensed-SN selection efficiencies are measured on the same simulated CMD used to tune the modified red limit, so the 44-67% completeness and 91-99.5% rejection numbers are in-sample fits rather than independent predictions.
-
fitted input called prediction
[Section 4.1, Figure 2, Equation 6]
"We modify this curve slightly to better suit our Set 1 distribution and propose the modified red limit (black bold curve in figure 2). We observe that in our sample, the proposed criterion selects lensed SNe Ia more efficiently using the modified red limit and hence continue to use this modified curve throughout the remainder of this paper. We find that this curve selects ≈ 44% of lensed SNe Ia while rejecting ≈ 99% of unlensed SNe Ia on the rising edge, and selects ≈ 67% of lensed SNe Ia while rejecting ≈ 91% of unlensed SNe Ia on the falling edge."
The curve in Equation 6 is introduced as a modification that "better suit[s] our Set 1 distribution," meaning it is tuned to the very simulated lensed and unlensed SNe Ia CMD shown in Figure 2. The reported completeness (44% and 67%) and rejection (99% and 91%) are then measured on that same Set 1 simulation. By construction, moving the curve upward or downward changes these percentages, so the numbers are summaries of the fitted curve's placement relative to the training data, not predictions on independent data. No held-out simulated sample or noise-realized test set is used for these headline efficiencies.
-
fitted input called prediction
[Section 4.2, Figure 3, Equation 7]
"Similar to the case of low redshift SNe Ia in the r−i versus i panel, a subset of even high redshift lensed SNe Ia occupy a non-overlapping region of CM parameter space with the high redshift unlensed SNe Ia in the z−y versus y panel. This allows us to determine the red limit for the high-redshift SNe Ia sample as well. ... This curve selects ≈ 46% of lensed SNe Ia at high redshift while rejecting ≈ 99.5% of unlensed SNe Ia on the rising edge, and selects ≈ 45% of lensed SNe Ia while rejecting ≈ 98% of unlensed SNe Ia on the falling edge."
The high-redshift red limit in Equation 7 is derived from the same simulated high-z lensed and unlensed SNe Ia distributions shown in Figure 3, and the quoted selection and rejection efficiencies are computed on those same distributions. The phrase "this allows us to determine the red limit" shows that the boundary is drawn from the data being evaluated, so the resulting 46%/45% completeness and 99.5%/98% rejection are in-sample descriptions of the fit rather than independent predictions of the criterion's performance.
full rationale
The paper's central quantitative claims—the 44-67% lensed-SN completeness and 91-99.5% unlensed-SN rejection for the proposed red limit—are computed on the same simulated Set 1 and high-z CMDs that were used to tune the curves in Equations 6 and 7. The authors state explicitly that they modified the Quimby et al. curve "to better suit our Set 1 distribution," and then measured efficiency on that same distribution. This is a fitted-input-called-prediction pattern and accounts for the score of 6. There is meaningful independent content that prevents a higher score: the starting point is the earlier Quimby et al. (2014) limit, the three observed lensed SNe (PS1-10afx, iPTF16geu, SN Zwicky) were not used to define the curve, and the observed unlensed SNe Ia and SLSNe in Figure 5 are mostly rejected. However, those external checks are qualitative and do not validate the specific efficiency numbers. The paper also contains a serious internal inconsistency that is not circularity but undermines the CC-contamination claim: Section 4.4 reports simulated unlensed CC contamination below 0.05%, while Section 4.5 states the same cut "select[s] a majority of the low redshift unlensed CC SNe sample" in observed SDSS data. This contradiction, together with the paper's own caveats that LSST PSF, cadence, noise, and microlensing are not modeled (Sections 2.3 and 5), means the headline rejection rates should be read as idealized in-sample values rather than validated predictions for LSST.
Assumptions & free parameters
free parameters (8)
- low-z red limit slope =
0.52
- low-z red limit intercept =
-10.96
- low-z red limit magnitude threshold =
21.02
- high-z red limit slope =
0.59
- high-z red limit intercept =
-13.67
- high-z red limit magnitude threshold =
23.63
- optical depth boost factor =
not specified
- epoch choices for Set 1 =
3 days before and 7 days after i-band peak
assumptions (6)
- domain assumption Strong lensing by SIE mass profile with mass following light, no external shear
- domain assumption L-sigma_v scaling relation from Parker et al. (2007) converts galaxy luminosity to velocity dispersion
- domain assumption SALT2 model accurately represents SNe Ia spectral energy distributions and colors out to z=3
- domain assumption SNe Ia volumetric rates from Dilday et al. (2008) and Hounsell et al. (2018)
- ad hoc to paper No photometric noise, detection limits, cadence, PSF, or microlensing in simulated photometry
- domain assumption Lensed SNe Ia are redder than unlensed SNe Ia at a given magnitude, so a single red limit separates them
Cite this review
Pith. "Pith review of Rapid identification of lensed type Ia supernovae with color-magnitude selection." pith.science (2026). https://pith.science/paper/D3QAOGLY
@misc{pith2026241109412,
  author       = {Pith},
  title        = {Pith review of: Rapid identification of lensed type Ia supernovae with color-magnitude selection},
  year         = {2026},
  howpublished = {\url{https://pith.science/paper/D3QAOGLY}},
  note         = {Machine review of arXiv:2411.09412}
}
abstract
Strongly lensed type Ia supernovae (SNe Ia) provide a unique cosmological probe to address the Hubble tension problem in cosmology. In addition to the sensitivity of the time delays to the value of the Hubble constant, the transient and standard candle nature of SNe Ia also enable valuable joint constraints on the model of the lens and the cosmological parameters. The upcoming Legacy Survey of Space and Time (LSST) with the Vera C. Rubin Observatory is expected to increase the number of observed SNe Ia by an order of magnitude in ten years of its lifetime. However, finding such systems in the LSST data is a challenge. In this work, we revisit the color-magnitude (CM) diagram used previously as a means to identify lensed SNe Ia and extend the work further as follows. We simulate LSST-like photometric data ($rizy$-bands) of lensed SNe Ia and analyze it in the CM parameter space. We find that a subset of lensed SNe Ia are redder compared to unlensed SNe Ia at a given magnitude, both in the rising and falling phases of their light curves and for SNe up to $z=3$. We propose a modified selection criterion based on these new results. We show that the contamination coming from unlensed core-collapse (CC) SNe is negligible, whereas a small fraction of lensed CC SNe types Ib and Ic may get selected by this criterion as potential lensed SNe. Finally, we demonstrate that our criterion works well on a wide sample of observed unlensed SNe Ia, a handful of known multiply-imaged lensed SNe systems, and a representative sample of observed CC SNe as well as super-luminous supernovae.
Figures


Figures from the paper (1 more)

Reference graph
Works this paper leans on
-
[1]
Abell, P. A., Allison, J., Anderson, S. F., et al. 2009, arXiv preprint arXiv:0912.0201
arXiv 2009
-
[2]
2020, Astronomy & Astrophysics, 641, A6
Aghanim, N., Akrami, Y., Ashdown, M., et al. 2020, Astronomy & Astrophysics, 641, A6
work page 2020
-
[3]
2024, Monthly Notices of the Royal Astronomical Society, 531, 3509
Arendse, N., Dhawan, S., Sagu´ es Carracedo, A., et al. 2024, Monthly Notices of the Royal Astronomical Society, 531, 3509
work page 2024
-
[4]
2016, Astrophysics Source Code Library, ascl
Barbary, K., Barclay, T., Biswas, R., et al. 2016, Astrophysics Source Code Library, ascl
work page 2016
-
[5]
E., Branch, D., & Hauschildt, P
Baron, E., Nugent, P. E., Branch, D., & Hauschildt, P. H. 2004, The Astrophysical Journal, 616, L91
work page 2004
-
[6]
2014, Astronomy & Astrophysics, 568, A22
Betoule, M., Kessler, R., Guy, J., et al. 2014, Astronomy & Astrophysics, 568, A22
work page 2014
-
[7]
2020, Astronomy & Astrophysics, 643, A165
Birrer, S., Shajib, A., Galan, A., et al. 2020, Astronomy & Astrophysics, 643, A165
work page 2020
-
[8]
2019, The Astrophysical Journal, 874, 106
Brout, D., Sako, M., Scolnic, D., et al. 2019, The Astrophysical Journal, 874, 106
work page 2019
Show all 80 references
-
[9]
C., Fassnacht, C
Chen, G. C., Fassnacht, C. D., Suyu, S. H., et al. 2019, Monthly Notices of the Royal Astronomical Society, 490, 1743
2019
-
[10]
L., Oguri, M., et al
Chen, W., Kelly, P. L., Oguri, M., et al. 2022, Nature, 611, 256
2022
-
[11]
M., et al
Chomiuk, L., Chornock, R., Soderberg, A. M., et al. 2011, The Astrophysical Journal, 743, 114
2011
-
[12]
2024, Monthly notices of the royal astronomical society, 535, 2939 Di Carlo, E., Massi, F., Valentini, G., et al
Dhawan, S., Pierel, J., Gu, M., et al. 2024, Monthly notices of the royal astronomical society, 535, 2939 Di Carlo, E., Massi, F., Valentini, G., et al. 2002, The Astrophysical Journal, 573, 144
2024
-
[13]
A., et al
Dilday, B., Kessler, R., Frieman, J. A., et al. 2008, The Astrophysical Journal, 682, 262
2008
-
[14]
& Keeton, C
Dobler, G. & Keeton, C. R. 2006, The Astrophysical Journal, 653, 1391
2006
-
[15]
Crockett, R. M. 2013, Monthly Notices of the Royal Astronomical Society, 436, 774
2013
-
[16]
Filippenko, A. V. 1997, Annual Review of Astronomy and Astrophysics, 35, 309
1997
-
[17]
E., Vernardos, G., Goldstein, D
Foxley-Marrable, M., Collett, T. E., Vernardos, G., Goldstein, D. A., & Bacon, D. 2018, Monthly Notices of the Royal Astronomical Society, 478, 5081
2018
-
[18]
L., Madore, B
Freedman, W. L., Madore, B. F., Gibson, B. K., et al. 2001, The Astrophysical Journal, 553, 47
2001
-
[19]
L., Pascale, M., Pierel, J., et al
Frye, B. L., Pascale, M., Pierel, J., et al. 2024, The Astrophysical Journal, 961, 171
2024
-
[20]
2012, Science, 337, 927
Gal-Yam, A. 2012, Science, 337, 927
2012
-
[21]
2019, Annual Review of Astronomy and Astrophysics, 57, 305
Gal-Yam, A. 2019, Annual Review of Astronomy and Astrophysics, 57, 305
2019
-
[22]
L., Nugent, P
Gilliland, R. L., Nugent, P. E., & Phillips, M. 1999, The Astrophysical Journal, 521, 30
1999
-
[23]
Goldstein, D. A. & Nugent, P. E. 2016, The Astrophysical Journal Letters, 834, L5
2016
-
[24]
A., Nugent, P
Goldstein, D. A., Nugent, P. E., Kasen, D. N., & Collett, T. E. 2018, The Astrophysical Journal, 855, 22
2018
-
[25]
2017, Science, 356, 291
Goobar, A., Amanullah, R., Kulkarni, S., et al. 2017, Science, 356, 291
2017
-
[26]
2023, Nature Astronomy, 7, 1098
Goobar, A., Johansson, J., Schulze, S., et al. 2023, Nature Astronomy, 7, 1098
2023
-
[27]
2007, Astronomy & Astrophysics, 466, 11
Guy, J., Astier, P., Baumont, S., et al. 2007, Astronomy & Astrophysics, 466, 11
2007
-
[28]
2010, Astronomy & Astrophysics, 523, A7
Guy, J., Sullivan, M., Conley, A., et al. 2010, Astronomy & Astrophysics, 523, A7
2010
-
[29]
2018, The Astrophysical Journal, 867, 23
Hounsell, R., Scolnic, D., Foley, R., et al. 2018, The Astrophysical Journal, 867, 23
2018
-
[30]
2013, The Astrophysical Journal, 779, 98
Howell, D., Kasen, D., Lidman, C., et al. 2013, The Astrophysical Journal, 779, 98
2013
-
[31]
2021, Astronomy & Astrophysics, 646, A110
Huber, S., Suyu, S., Noebauer, U., et al. 2021, Astronomy & Astrophysics, 646, A110
2021
-
[32]
2013, The Astrophysical Journal, 770, 128
Inserra, C., Smartt, S., Jerkstrand, A., et al. 2013, The Astrophysical Journal, 770, 128
2013
-
[33]
J., Gall, E., et al
Inserra, C., Smartt, S. J., Gall, E., et al. 2018, Monthly Notices of the Royal Astronomical Society, 475, 1046 Ivezi´ c,ˇZ., Kahn, S. M., Tyson, J. A., et al. 2019, The Astrophysical Journal, 873, 111
2018
-
[34]
Ivezic, Z. et al. 2011, Large synoptic survey telescope (lsst) science requirements document
2011
-
[35]
L., Rodney, S., Treu, T., et al
Kelly, P. L., Rodney, S., Treu, T., et al. 2023, Science, 380, eabh1322
2023
-
[36]
L., Rodney, S
Kelly, P. L., Rodney, S. A., Treu, T., et al. 2015, Science, 347, 1123
2015
-
[37]
2009, The Astrophysical Journal, 703, L51
Koopmans, L., Bolton, A., Treu, T., et al. 2009, The Astrophysical Journal, 703, L51
2009
-
[38]
1994, Astronomy and Astrophysics (ISSN 0004-6361), vol
Kormann, R., Schneider, P., & Bartelmann, M. 1994, Astronomy and Astrophysics (ISSN 0004-6361), vol. 284, no. 1, p. 285-299, 284, 285
1994
-
[39]
2005, The Astrophysical Journal, 624, 880
Levan, A., Nugent, P., Fruchter, A., et al. 2005, The Astrophysical Journal, 624, 880
2005
-
[40]
2022, Chinese Physics Letters, 39, 119801
Liao, K., Biesiada, M., & Zhu, Z.-H. 2022, Chinese Physics Letters, 39, 119801
2022
-
[41]
2015, The Astrophysical Journal, 800, 11
Liao, K., Treu, T., Marshall, P., et al. 2015, The Astrophysical Journal, 800, 11
2015
-
[42]
Linder, E. V. 2004, Physical Review D, 70, 043534
2004
-
[43]
Linder, E. V. 2011, Physical Review D, 84, 123529
2011
-
[44]
2015, The Astrophysical Journal, 804, 90
Lunnan, R., Chornock, R., Berger, E., et al. 2015, The Astrophysical Journal, 804, 90
2015
-
[45]
& Dickinson, M
Madau, P. & Dickinson, M. 2014, Annual Review of Astronomy and Astrophysics, 52, 415
2014
-
[46]
2023, Monthly Notices of the Royal Astronomical Society, 525, 542
Magee, M., Sainz de Murieta, A., Collett, T., & Enzi, W. 2023, Monthly Notices of the Royal Astronomical Society, 525, 542
2023
-
[47]
2015, Monthly Notices of the Royal Astronomical Society, 448, 1206
McCrum, M., Smartt, S., Rest, A., et al. 2015, Monthly Notices of the Royal Astronomical Society, 448, 1206
2015
-
[48]
1979, in A Source Book in Astronomy and Astrophysics, 1900–1975 (Harvard University Press), 478–480
Minkowski, R. 1979, in A Source Book in Astronomy and Astrophysics, 1900–1975 (Harvard University Press), 478–480
1979
-
[49]
& More, S
More, A. & More, S. 2022, Monthly Notices of the Royal Astronomical Society, 515, 1044
2022
-
[50]
E., et al
Narayan, G., Rest, A., Tucker, B. E., et al. 2016, The Astrophysical Journal Supplement Series, 224, 3
2016
-
[51]
2017, The Astrophysical Journal, 850, 55 Rapid identification of lensed SNe Ia 9
Nicholl, M., Guillochon, J., & Berger, E. 2017, The Astrophysical Journal, 850, 55 Rapid identification of lensed SNe Ia 9
2017
-
[52]
2014, Monthly Notices of the Royal Astronomical Society, 444, 2096
Nicholl, M., Smartt, S., Jerkstrand, A., et al. 2014, Monthly Notices of the Royal Astronomical Society, 444, 2096
2014
-
[53]
2002, Publications of the Astronomical Society of the Pacific, 114, 803
Nugent, P., Kim, A., & Perlmutter, S. 2002, Publications of the Astronomical Society of the Pacific, 114, 803
2002
-
[54]
2010, Astrophysics Source Code Library, ascl
Oguri, M. 2010, Astrophysics Source Code Library, ascl
2010
-
[55]
2019, Reports on Progress in Physics, 82, 126901
Oguri, M. 2019, Reports on Progress in Physics, 82, 126901
2019
-
[56]
& Kawano, Y
Oguri, M. & Kawano, Y. 2003, Monthly Notices of the Royal Astronomical Society, 338, L25
2003
-
[57]
& Marshall, P
Oguri, M. & Marshall, P. J. 2010, Monthly Notices of the Royal Astronomical Society, 405, 2579
2010
-
[58]
2007, The Astrophysical Journal, 669, 21
Mellier, Y. 2007, The Astrophysical Journal, 669, 21
2007
-
[59]
L., Pierel, J
Pascale, M., Frye, B. L., Pierel, J. D., et al. 2025, The Astrophysical Journal, 979, 13
2025
-
[60]
2024, The Astrophysical Journal Letters, 967, L37
Pierel, J., Newman, A., Dhawan, S., et al. 2024, The Astrophysical Journal Letters, 967, L37
2024
-
[61]
2011, Nature, 474, 487
Quimby, R., Kulkarni, S., Kasliwal, M., et al. 2011, Nature, 474, 487
2011
-
[62]
M., Oguri, M., More, A., et al
Quimby, R. M., Oguri, M., More, A., et al. 2014, Science, 344, 396
2014
-
[63]
1964, Monthly Notices of the Royal Astronomical Society, 128, 307
Refsdal, S. 1964, Monthly Notices of the Royal Astronomical Society, 128, 307
1964
-
[64]
L., Wright, J., & Maddox, L
Richardson, D., Jenkins III, R. L., Wright, J., & Maddox, L. 2014, The Astronomical Journal, 147, 118
2014
-
[65]
G., Casertano, S., Yuan, W., et al
Riess, A. G., Casertano, S., Yuan, W., et al. 2021, The Astrophysical Journal Letters, 908, L6
2021
-
[66]
2025, Astronomy & Astrophysics, 694, A1
Rigault, M., Smith, M., Goobar, A., et al. 2025, Astronomy & Astrophysics, 694, A1
2025
-
[67]
A., Brammer, G
Rodney, S. A., Brammer, G. B., Pierel, J. D., et al. 2021, Nature Astronomy, 5, 1118
2021
-
[68]
C., et al
Sako, M., Bassett, B., Becker, A. C., et al. 2018, Publications of the Astronomical Society of the Pacific, 130, 064002
2018
-
[69]
& Kessler, R
Scolnic, D. & Kessler, R. 2016, The Astrophysical Journal Letters, 822, L35
2016
-
[70]
J., Birrer, S., Treu, T., et al
Shajib, A. J., Birrer, S., Treu, T., et al. 2020, Monthly Notices of the Royal Astronomical Society, 494, 6072
2020
-
[71]
2017, Publications of the Astronomical Society of the Pacific, 129, 054201
Shivvers, I., Modjaz, M., Zheng, W., et al. 2017, Publications of the Astronomical Society of the Pacific, 129, 054201
2017
-
[72]
2009, Monthly Notices of the Royal Astronomical Society, 395, 1409
Smartt, S., Eldridge, J., Crockett, R., & Maund, J. 2009, Monthly Notices of the Royal Astronomical Society, 395, 1409
2009
-
[73]
H., Bonvin, V., Courbin, F., et al
Suyu, S. H., Bonvin, V., Courbin, F., et al. 2017, Monthly Notices of the Royal Astronomical Society, 468, 2590
2017
-
[74]
H., Goobar, A., Collett, T., More, A., & Vernardos, G
Suyu, S. H., Goobar, A., Collett, T., More, A., & Vernardos, G. 2024, Space Science Reviews, 220, 13
2024
-
[75]
S., et al
Townsend, A., Nordin, J., Carracedo, A. S., et al. 2025, Astronomy & Astrophysics, 694, A146
2025
-
[76]
A., Nicholl, M., & Berger, E
Villar, V. A., Nicholl, M., & Berger, E. 2018, The Astrophysical Journal, 869, 166
2018
-
[77]
2019, Monthly Notices of the Royal Astronomical Society, 489, 5802
Vincenzi, M., Sullivan, M., Firth, R., et al. 2019, Monthly Notices of the Royal Astronomical Society, 489, 5802
2019
-
[78]
2019, Monthly Notices of the Royal Astronomical Society, 487, 3342
Wojtak, R., Hjorth, J., & Gall, C. 2019, Monthly Notices of the Royal Astronomical Society, 487, 3342
2019
-
[79]
C., Suyu, S
Wong, K. C., Suyu, S. H., Auger, M. W., et al. 2017, Monthly Notices of the Royal Astronomical Society, 465, 4895
2017
-
[80]
C., Suyu, S
Wong, K. C., Suyu, S. H., Chen, G. C., et al. 2020, Monthly Notices of the Royal Astronomical Society, 498, 1420 APPENDIX ADDITIONAL CMDS Additional CMDs showing the comparison between re- solved and unresolved SNe Ia and CC SNe separated by their subtypes are added here inste...
2020
Reviewed August 12, 2026 · model on record in the stance chip above.
Discussion (0). Continue with ORCID to comment.