REVIEW 3 major objections 5 minor 57 references
Accuracy of Stellar Mass-to-light Ratios of Nearby Galaxies in the Near-Infrared
T0 review · 3 major / 5 minor · reviewed 2026-08-12 · deepseek-v4-flash
Pith's one-line read Stellar masses of nearby galaxies can be pinned down to 0.02 dex using 1.6 micron light plus a star-formation-rate correction.
desk verdict A useful wavelength-resolved map of M*/L scatter for SPHEREx, but the headline 0.02 dex 'accuracy' is in-sample precision around the same fitted model, not external accuracy. read the letter →
The pith
A machine-rendered reading of the paper's core claim, the machinery that carries it, and where it could break.
The reading
What carries the argument
The analysis rests on synthetic SEDs built by fitting multi-wavelength photometry with a two-component (old plus young) star-formation history, a fixed initial mass function, a dust attenuation curve, and nebular emission. From those SEDs the paper computes luminosity and $M_*/L$ in 68 spectral elements of resolution $\sim 40$ spanning $0.75$–$5.0\,\mu$m. At each wavelength it measures the scatter in $\log(M_*/L)$, regresses out the weak stellar-mass dependence, and then fits the sSFR dependence with a smoothly broken power law, Eq. (1): $\log(M_*/L)=a\left(\frac{1}{2}\left[1+\left(\frac{\log \mathrm{sSFR}}{\delta}\right)^{1/\beta}\right]\right)^{-\alpha\beta}$. This relation is the load-bearing identity of the paper: removing it from the data collapses the scatter at $\sim 1.6\,\mu$m from $\sim 0.10$ dex to $\sim 0.02$ dex.
What would settle it
Take a sample of nearby galaxies with independent dynamical stellar masses and H-$\alpha$ star-formation rates, compute their $\sim 1.6\,\mu$m $M_*/L$ from stellar-only light, subtract the paper's sSFR-corrected relation, and measure the residual scatter; if it is appreciably larger than $0.02$ dex for galaxies with complex star-formation histories, the claimed accuracy is an artifact of the assumed two-component star-formation model.
Extended reading notes
Core claim
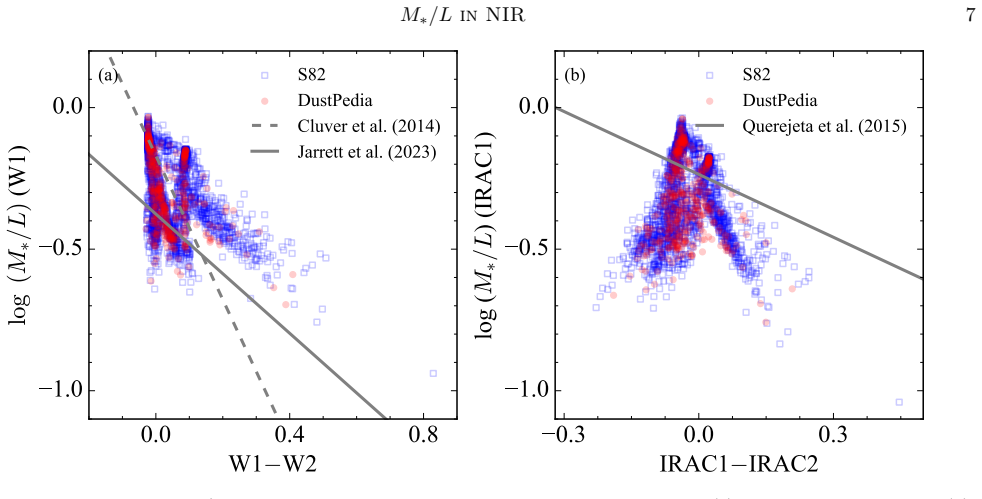
The paper's central claim is that the near-infrared stellar mass-to-light ratio is almost entirely set by the specific star-formation rate once dust contribution is removed from the light. At $\sim 1.6\,\mu$m, using only stellar light, the scatter in $\log(M_*/L)$ across the combined sample is $\sim 0.10$ dex; after correcting for the smoothly broken power-law dependence on sSFR, that scatter drops to $\sim 0.02$ dex. The authors conclude that stellar masses of nearby galaxies can be estimated to an accuracy of $\sim 0.02$ dex from $\sim 1.6\,\mu$m spectral data when an SFR estimate is available. They also show that total-luminosity $M_*/L$ values are systematically contaminated by dust continuum and the 3.3 $\mu$m polycyclic aromatic hydrocarbon (PAH) feature, and that the standard near-infrared colors (W1$-$W2 or IRAC1$-$IRAC2) cannot reliably remove that contamination, whereas a spectral color between 3 and 4 $\mu$m traces the dust fraction well.
Load-bearing premise
The load-bearing premise is that the SED-fitting model's estimates of stellar mass, star-formation rate, and starlight are close enough to the truth that the remaining 0.02 dex scatter measures estimation accuracy, rather than just the internal consistency of one assumed star-formation history.
Editorial extensions
If this is right
- All-sky near-infrared spectral surveys can, in principle, produce stellar masses for huge numbers of nearby galaxies at $\sim 0.02$ dex scatter, provided each galaxy has a star-formation-rate estimate.
- Wavelengths beyond roughly $2\,\mu$m require spectral dust removal; two-band colors like W1$-$W2 are not enough because the 3.3 $\mu$m PAH feature and warm dust push the color in opposite directions.
- The $\sim 1.6\,\mu$m region is the natural choice for mass estimation because stellar-light $M_*/L$ is least scattered there and dust contamination is minimal.
- A spectrum that also provides an SFR indicator, such as hydrogen recombination lines or PAH emission, can supply both the correction and the mass, so no external SFR catalog is needed.
- The $0.02$ dex figure is internal to the adopted stellar population models; systematic offsets from the initial mass function, star-formation history, and stellar-population modeling are not included and can be larger.
Reading between the lines
- If real galaxies follow the same sSFR-$M_*/L$ relation, the paper's table of broken power-law parameters becomes a ready-made calibration for future surveys; a straightforward check is to apply it to galaxies with independent dynamical masses.
- The very small post-correction scatter suggests that, within the assumed two-component star-formation history, sSFR almost fully determines the recent-to-total stellar mass ratio, so the claimed 0.02 dex may partly reflect the structure of the model rather than an intrinsic property of galaxies.
- The paper's spectral color-dust relation between 3 and 4 $\mu$m can be tested against high-spatial-resolution near-infrared spectroscopy of nearby star-forming galaxies; if dust fraction and $m_{3\mu m}-m_{4\mu m}$ decouple at low metallicity, the dust model would need revision.
- Because the sSFR correction requires an initial stellar mass estimate, routine implementation will need the iterative scheme the paper sketches; a practical extension is to test how the iteration converges when the SFR and the spectrum are noisy.
Editorial analysis
A structured set of objections, weighed in public.
Referee Report
Summary. The paper uses CIGALE spectral energy distribution (SED) fits to 2853 nearby galaxies (435 from DustPedia, 2418 from Stripe 82) to compute stellar mass-to-light ratios M*/L over 0.75-5.0 microns, motivated by SPHEREx-like all-sky near-infrared spectroscopy. It reports that the scatter in M*/L is minimized near 1.6 microns (~0.10 dex for stellar-only luminosity), that M*/L is weakly correlated with stellar mass and strongly correlated with specific star formation rate (sSFR), and that after correcting the sSFR dependence with a broken power law the scatter drops to ~0.02 dex. The abstract concludes that stellar masses can be estimated with ~0.02 dex accuracy given a prior knowledge of SFR from future infrared spectra.
Significance. The wavelength-resolved M*/L scatter maps (Figs. 4, 5; Table 1) are useful products for planning SPHEREx-type surveys, and the comparisons against Meidt et al. (2014), Querejeta et al. (2015), and Jarrett et al. (2023) provide valuable external anchors. The demonstration that 3.3 micron PAH emission complicates simple NIR color corrections (Figs. 6-8) is an interesting and likely robust result. If the headline 0.02 dex number were a genuine external accuracy, it would be a major advance; as presented, however, it is an in-sample scatter around a relation fitted to the same SED-fitting outputs that produced M*, SFR, and M*/L. The paper is commendably honest in its footnotes and appendices about several missing systematics, but the abstract and conclusions do not carry those caveats, and the forecast for future surveys is therefore overstated.
major comments (3)
- [Abstract; Section 4.2; Eq. (1)] The central claim that stellar mass can be estimated with ~0.02 dex accuracy is not supported by the analysis as presented. In Section 2.2, the stellar mass M*, the SFR, and the stellar-only luminosity used to compute M*/L all come from the same CIGALE fit with the adopted double-exponential SFH (old 12 Gyr plus young 10-5000 Myr), and sSFR is defined as SFR/M* from that same fit. Section 4.2 itself states that the tight M*/L-sSFR relation is 'rather expected' because sSFR approximately traces the old-to-young mass ratio in that SFH. Equation (1) therefore fits the internal covariance of a single model family, and the ~0.02 dex residual in Figure 12 measures how well the broken power law reproduces CIGALE's own outputs, not the accuracy with which a real spectrum plus an independent SFR estimate recovers true stellar mass. This statement should be reframed as model-conditional precision, and the abstract should not call it 'accuracy.'
- [Footnote 1; Appendix A; Appendix B] The systematics that the 0.02 dex number omits are substantial and should be folded into any accuracy statement. Footnote 1 in Section 3.1 concedes that parameterized star formation histories can produce zero-point offsets up to 0.3-0.4 dex. Appendix A shows that changing from the flexible delayed SFH plus Salpeter IMF to the adopted setup changes M* with a scatter of ~0.12 dex. Appendix B reports that the best-fit models underestimate the JHKs fluxes by up to ~0.04 dex, which the paper notes could bias NIR-based M*/L low by a similar amount. None of these terms enters the 0.02 dex residual. At minimum, the paper should report internal precision and external systematics separately, and it should avoid quoting 0.02 dex as the expected error budget for future surveys.
- [Section 4.2; Section 2.2; Section 4.3] The practical recipe implied by the abstract requires an SFR prior, but the paper does not propagate the uncertainty of that prior. Equation (1) uses sSFR, so any application requires a stellar mass estimate before the correction can be applied; Section 4.3 acknowledges this iterativeness but does not quantify the resulting error. More importantly, the SFR from CIGALE is an instantaneous SFR, whereas the SFR indicators proposed for SPHEREx-type data (hydrogen recombination lines, 3.3 micron PAH) trace averages over ~10 Myr and differ from CIGALE's definition, as the paper notes in Section 4.2. The comparison quoted in Section 2.2 already shows a large dispersion in SFR relative to GSWLC-2 (-0.12 +/- 0.56 dex). With a fitted slope alpha ~0.2 in Equation (1), a 0.3-0.5 dex uncertainty in sSFR translates into roughly 0.06-0.1 dex in M*/L, dwarfing the 0.02 dex residual. This propagation needs to be quantified before the forecast is made.
minor comments (5)
- [Table 3] The broken-power-law fit parameters show discontinuous jumps around 3.4 and 4.4 microns (for example, beta changes from ~0.6 to 0.007 and back, while the residual scatter sigma increases from ~0.02 to ~0.05 dex). The authors should explain whether these are separate fit branches or degeneracies and should report fit-parameter uncertainties; the current presentation makes the wavelength dependence of the correction hard to interpret.
- [Figure 12; Table 3] Please state explicitly in the captions that the reported ~0.02 dex is the residual scatter after the Equation (1) fit is subtracted, not the raw scatter of M*/L; this distinction is central to the paper's claims.
- [Section 3.2] The Gaussian approximation for SPHEREx channel transmission is used for all numerical results; please add a short justification or sensitivity test showing that the exact channel shape does not change the scatter estimates.
- [Abstract; Section 1] There are several formatting and typographical issues: in the abstract, 'theinfraredspectraldatafacilitatethepreciseestimation' lacks word spaces; 'Hershel' should be 'Herschel'; and the wavelength range is given inconsistently as '0.75-5 um' and '0.75-5.0 microns.'
- [Data availability] No data or code availability statement is provided; consider making Table 1 and the per-wavelength fit results available in machine-readable form to support reproducibility.
Circularity Check
The 0.02 dex 'accuracy' is the in-sample scatter around an M*/L–sSFR relation fitted to the same CIGALE double-exponential SFH outputs; it is model covariance, not an externally calibrated accuracy.
-
fitted input called prediction
[Abstract; Section 4.2 (Eq. 1, Figs. 11 and 12)]
"Upon adequately correcting the dependence of M∗/L on the specific SFR, the scatter in the M∗/L further reduces to 0.02 dex at ∼1.6 µm. This indicates that the stellar mass can be estimated with an accuracy of ∼0.02 dex with a prior knowledge of SFR, which can be estimated using the infrared spectra obtained with future survey missions."
M*, SFR, and the stellar-only luminosity entering M*/L are all outputs of one CIGALE fit with the same double-exponential SFH, and sSFR is the model's own SFR/M*. The 0.02 dex figure is the residual scatter of M*/L around Eq. 1 fitted to those same outputs, not a comparison against independent stellar masses or independent SFR indicators. The paper itself notes that common SFR indicators (H-alpha, PAH, UV, IR) trace average SFR and may differ from the CIGALE instantaneous SFR, so the quoted accuracy does not automatically carry over to the proposed SPHEREx application.
-
self definitional
[Section 2.2; Section 4.2 (Fig. 11)]
"The stellar population was modeled with a double-exponential SFH, comprising an old stellar population with an age of 12 Gyr and a young stellar population with an age range from 10 to 5000 Myr. ... This trend is rather expected from the adopted SFH with two components (old and young stellar populations) because the sSFR approximately traces the mass ratio of the old stellar population to the young stellar population."
Within the adopted two-component SFH, both M*/L and sSFR are determined by the same old-to-young mass ratio, so their tight correlation is largely imposed by the parameterization rather than discovered from data. Correcting M*/L for sSFR therefore removes a covariance that the model itself builds in; the remaining 0.02 dex scatter is conditional on that SFH and does not include the SFH-related systematics the paper quantifies elsewhere (Appendix A: ~0.12 dex; footnote 1: up to 0.3–0.4 dex zero-point).
full rationale
The paper's headline accuracy claim is not supported as an external, model-independent accuracy. The central reduction—from ~0.10 dex scatter in M*/L to 0.02 dex after an sSFR correction—operates entirely on CIGALE outputs derived from one assumed double-exponential SFH. The paper explicitly concedes that the tight M*/L–sSFR relation is 'rather expected' from that two-component SFH, and the residual scatter is an in-sample measure of how well Eq. 1 fits the same model-generated points. External anchors exist (mean M*/L at W1/IRAC1 compared with Meidt et al., Jarrett et al., Querejeta et al.; M* compared with GSWLC-2 with 0.01 ± 0.11 dex scatter), but none of them validates the 0.02 dex precision claim for future SPHEREx spectra. The self-citations to Li et al. (2023) and Lee et al. (submitted) are present but are not the load-bearing mechanism for the numerical claim; the load-bearing issue is that the corrected scatter is internal to the model family. Because the paper itself flags several unmodeled systematics (SFH zero-point up to 0.3–0.4 dex, ~0.12 dex SFH/IMF variation, ~0.04 dex NIR flux underestimation), the 0.02 dex number should be read as conditional precision, not absolute accuracy. This is a genuine partial circularity, though not a fully definitional one, so a score of 6 is appropriate.
Assumptions & free parameters
free parameters (6)
- a, normalization of M*/L-sSFR broken power law =
varies per wavelength, e.g., 0.180 at 0.75 um and -0.062 at 3.40 to 4.33 um
- delta, pivot sSFR of broken power law =
0.006 to 0.0155 Gyr^-1
- alpha, power-law slope above pivot sSFR =
0.17 to 0.32
- beta, smoothness of broken power law =
0.007 to 1.064
- b, slope of M*/L versus log M* =
0.066 to 0.141
- SED fitting grid choices =
old age 12 Gyr, young age 10 to 5000 Myr, metallicity 0.004 to 0.02, qPAH=2.5, dust alpha=2, Umin 0.1 to 25, gamma…
assumptions (5)
- domain assumption Bruzual and Charlot (2003) SSP models correctly predict NIR stellar fluxes including the TP-AGB contribution
- ad hoc to paper The two-component double-exponential SFH (old 12 Gyr, young 10 to 5000 Myr) adequately represents real galaxy star formation histories, so sSFR from this model maps to M*/L
- domain assumption CIGALE-derived stellar masses and SFRs are unbiased ground truth for evaluating M*/L accuracy
- domain assumption The Calzetti attenuation curve with modified power-law slope and the adopted dust emission model correctly separate dust and stellar light
- standard math A Gaussian R=40 spectral response adequately approximates SPHEREx channels
Cite this review
Pith. "Pith review of Accuracy of Stellar Mass-to-light Ratios of Nearby Galaxies in the Near-Infrared." pith.science (2026). https://pith.science/paper/RTWJSB63
@misc{pith2026241110981,
  author       = {Pith},
  title        = {Pith review of: Accuracy of Stellar Mass-to-light Ratios of Nearby Galaxies in the Near-Infrared},
  year         = {2026},
  howpublished = {\url{https://pith.science/paper/RTWJSB63}},
  note         = {Machine review of arXiv:2411.10981}
}
abstract
Future satellite missions are expected to perform all-sky surveys, thus providing the entire sky near-infrared spectral data and consequently opening a new window to investigate the evolution of galaxies. Specifically, the infrared spectral data facilitate the precise estimation of stellar masses of numerous low-redshift galaxies. We utilize the synthetic spectral energy distribution (SED) of 2853 nearby galaxies drawn from the DustPedia (435) and Stripe 82 regions (2418). The stellar mass-to-light ratio ($M_*/L$) estimation accuracy over a wavelength range of $0.75-5.0$ $\mu$m is computed through the SED fitting of the multi-wavelength photometric dataset, which has not yet been intensively explored in previous studies. We find that the scatter in $M_*/L$ is significantly larger in the shorter and longer wavelength regimes due to the effect of the young stellar population and the dust contribution, respectively. While the scatter in $M_*/L$ approaches its minimum ($\sim0.10$ dex) at $\sim1.6$ $\mu$m, it remains sensitive to the adopted star formation history model. Furthermore, $M_*/L$ demonstrates weak and strong correlations with the stellar mass and the specific star formation rate (SFR), respectively. Upon adequately correcting the dependence of $M_*/L$ on the specific SFR, the scatter in the $M_*/L$ further reduces to $0.02$ dex at $\sim1.6$ $\mu$m. This indicates that the stellar mass can be estimated with an accuracy of $\sim0.02$ dex with a prior knowledge of SFR, which can be estimated using the infrared spectra obtained with future survey missions.
Figures


Figures from the paper (5 more)



Reference graph
Works this paper leans on
-
[1]
Belfiore, F., Leroy, A. K., Williams, T. G., et al. 2023, A&A, 678, A129
work page 2023
-
[2]
F., McIntosh, D
Bell, E. F., McIntosh, D. H., Katz, N., & Weinberg, M. D. 2003, ApJS, 149, 289
2003
-
[3]
2019, A&A, 622, A103
Boquien, M., Burgarella, D., Roehlly, Y., et al. 2019, A&A, 622, A103
2019
-
[4]
Brown, M. J. I., Moustakas, J., Smith, J. D. T., et al. 2014, ApJS, 212, 18
work page 2014
-
[5]
2003, MNRAS, 344, 1000 12 Kim et al
Bruzual, G., & Charlot, S. 2003, MNRAS, 344, 1000 12 Kim et al. J H Ks W1 W2 Filters 0.4 0.2 0.0 0.2 0.4 mobs − mmodel −0.08+0.10 −0.12 −0.10+0.13 −0.16 −0.11+0.15 −0.14 0.00+0.08 −0.10 −0.07+0.12 −0.11 Figure A2. Distributions of residual magnitudes between the observed magnitudes (mobs) and the model magnitudes (mmodel) derived from the best-fit SED in ...
work page 2003
- [6]
-
[7]
C., et al
Calzetti, D., Armus, L., Bohlin, R. C., et al. 2000, ApJ, 533, 682
2000
-
[8]
2003, PASP, 115, 763
Chabrier, G. 2003, PASP, 115, 763
2003
Show all 57 references
-
[9]
Clark, C. J. R., Verstocken, S., Bianchi, S., et al. 2018, A&A, 609, A37
2018
-
[10]
E., Jarrett, T
Cluver, M. E., Jarrett, T. H., Hopkins, A. M., et al. 2014, ApJ, 782, 90
2014
-
[11]
2013, ARA&A, 51, 393
Conroy, C. 2013, ARA&A, 51, 393
2013
-
[12]
Conselice, C. J. 2014, ARA&A, 52, 291
2014
-
[13]
P., Werner, M., Akeson, R., et al
Crill, B. P., Werner, M., Akeson, R., et al. 2020, in Society of Photo-Optical Instrumentation Engineers (SPIE) Conference Series, Vol. 11443, Space Telescopes and Instrumentation 2020: Optical, Infrared, and Millimeter Wave, ed. M. Lystrup & M. D. Perrin, 114430I
2020
-
[14]
M., Skrutskie, M
Cutri, R. M., Skrutskie, M. F., van Dyk, S., et al. 2003, 2MASS All Sky Catalog of point sources
2003
-
[15]
I., Baes, M., Bianchi, S., et al
Davies, J. I., Baes, M., Bianchi, S., et al. 2017, PASP, 129, 044102 Doré, O., Werner, M. W., Ashby, M., et al. 2016, arXiv e-prints, arXiv:1606.07039
2017 arXiv
-
[16]
2006, MNRAS, 366, 767
Fritz, J., Franceschini, A., & Hatziminaoglou, E. 2006, MNRAS, 366, 767
2006
-
[17]
Hon, D. S. H., Graham, A. W., Davis, B. L., & Marconi, A. 2022, MNRAS, 514, 3410
2022
-
[18]
2018, A&A, 617, A130
Inami, H., Armus, L., Matsuhara, H., et al. 2018, A&A, 617, A130
2018
-
[19]
Inoue, A. K. 2011, MNRAS, 415, 2920
2011
-
[20]
2013, MNRAS, 430, 2715
Into, T., & Portinari, L. 2013, MNRAS, 430, 2715
2013
-
[21]
H., Chester, T., Cutri, R., et al
Jarrett, T. H., Chester, T., Cutri, R., et al. 2000, AJ, 119, 2498
2000
-
[22]
H., Cluver, M
Jarrett, T. H., Cluver, M. E., Taylor, E. N., et al. 2023, ApJ, 946, 95
2023
-
[23]
P., Fanciullo, L., Köhler, M., et al
Jones, A. P., Fanciullo, L., Köhler, M., et al. 2013, A&A, 558, A62
2013
-
[24]
C., & Evans, N
Kennicutt, R. C., & Evans, N. J. 2012, ARA&A, 50, 531
2012
-
[25]
2018, MNRAS, 473, 776
Kettlety, T., Hesling, J., Phillipps, S., et al. 2018, MNRAS, 473, 776
2018
-
[26]
H., Im, M., Lee, H
Kim, J. H., Im, M., Lee, H. M., et al. 2012, ApJ, 760, 120
2012
-
[27]
Kormendy, J., & Ho, L. C. 2013, ARA&A, 51, 511
2013
-
[28]
M., Bock, J
Korngut, P. M., Bock, J. J., Akeson, R., et al. 2018, in Society of Photo-Optical Instrumentation Engineers (SPIE) Conference Series, Vol. 10698, Space Telescopes and Instrumentation 2018: Optical, Infrared, and Millimeter Wave, ed. M. Lystrup, H. A. MacEwen, G. G
2018
-
[29]
Lai, T. S. Y., Smith, J. D. T., Baba, S., Spoon, H. W. W., & Imanishi, M. 2020, ApJ, 905, 55
2020
-
[30]
W., & Schlegel, D
Lang, D., Hogg, D. W., & Schlegel, D. J. 2016, AJ, 151, 36
2016
-
[31]
B., & Tinsley, B
Larson, R. B., & Tinsley, B. M. 1978, ApJ, 219, 46
1978
-
[32]
C., Hwang, H
Lee, J. C., Hwang, H. S., Lee, M. G., Kim, M., & Lee, J. H. 2012, ApJ, 756, 95
2012
-
[33]
A., Ho, L
Li, Y. A., Ho, L. C., Shangguan, J., Zhuang, M.-Y., & Li, R. 2023, ApJS, 267, 17
2023
-
[34]
2020, ApJ, 904, 33
Lower, S., Narayanan, D., Leja, J., et al. 2020, ApJ, 904, 33
2020
-
[35]
2014, ARA&A, 52, 415
Madau, P., & Dickinson, M. 2014, ARA&A, 52, 415
2014
-
[36]
2019, A&A Rv, 27, 3
Maiolino, R., & Mannucci, F. 2019, A&A Rv, 27, 3
2019
-
[37]
2006, ApJ, 652, 85 M∗/L in NIR 13
Maraston, C., Daddi, E., Renzini, A., et al. 2006, ApJ, 652, 85 M∗/L in NIR 13
2006
-
[38]
E., Schinnerer, E., Knapen, J
Meidt, S. E., Schinnerer, E., Knapen, J. H., et al. 2012, ApJ, 744, 17
2012
-
[39]
E., Schinnerer, E., van de Ven, G., et al
Meidt, S. E., Schinnerer, E., van de Ven, G., et al. 2014, ApJ, 788, 144
2014
-
[40]
M., Bianchi, S., et al
Nersesian, A., Xilouris, E. M., Bianchi, S., et al. 2019, A&A, 624, A80
2019
-
[41]
A., Van de Ven, G., Schinnerer, E., et al
Norris, M. A., Van de Ven, G., Schinnerer, E., et al. 2016, ApJ, 832, 198
2016
-
[42]
2004, MNRAS, 347, 691
Portinari, L., Sommer-Larsen, J., & Tantalo, R. 2004, MNRAS, 347, 691
2004
-
[43]
E., Schinnerer, E., et al
Querejeta, M., Meidt, S. E., Schinnerer, E., et al. 2015, ApJS, 219, 5
2015
-
[44]
2015, ApJL, 801, L29
Renzini, A., & Peng, Y.-j. 2015, ApJL, 801, L29
2015
-
[45]
C., & Courteau, S
Roediger, J. C., & Courteau, S. 2015, MNRAS, 452, 3209
2015
-
[46]
Salim, S., Boquien, M., & Lee, J. C. 2018, ApJ, 859, 11
2018
-
[47]
Salpeter, E. E. 1955, ApJ, 121, 161
1955
-
[48]
S., Jeong, W.-S., et al
Shim, H., Hwang, H. S., Jeong, W.-S., et al. 2023, AJ, 165, 31
2023
-
[49]
N., Hopkins, A
Taylor, E. N., Hopkins, A. M., Baldry, I. K., et al. 2011, MNRAS, 418, 1587
2011
-
[50]
H., & Tinker, J
Wechsler, R. H., & Tinker, J. L. 2018, ARA&A, 56, 435
2018
-
[51]
W., Roellig, T
Werner, M. W., Roellig, T. L., Low, F. J., et al. 2004, ApJS, 154, 1
2004
-
[52]
M., Smith, J
Whitcomb, C. M., Smith, J. D. T., Sandstrom, K., et al. 2024, ApJ, 974, 20
2024
-
[53]
L., Eisenhardt, P
Wright, E. L., Eisenhardt, P. R. M., Mainzer, A. K., et al. 2010, AJ, 140, 1868
2010
-
[54]
2013, PASJ, 65, 103
Yamada, R., Oyabu, S., Kaneda, H., et al. 2013, PASJ, 65, 103
2013
-
[55]
Zhang, L., & Ho, L. C. 2023, ApJ, 943, 60
2023
-
[56]
C., & Xie, Y
Zhang, L., Ho, L. C., & Xie, Y. 2021, AJ, 161, 29
2021
-
[57]
2009, MNRAS, 400, 1181 14 Kim et al
Zibetti, S., Charlot, S., & Rix, H.-W. 2009, MNRAS, 400, 1181 14 Kim et al. T able 1. Mass-to-light ratio in NIR Spectrum Total Luminosity Stellar Luminosity DustPedia S82 All DustPedia S82 All λc log (M∗/L) σ log (M∗/L) σ log (M∗/L) σ log (M∗/L) σ log (M∗/L) σ log (M∗/L) σ (1...
2009
Reviewed August 12, 2026 · model on record in the stance chip above.
Discussion (0). Continue with ORCID to comment.