REVIEW 4 major objections 4 minor 13 references
Non-Invasive Glucose Level Monitoring from PPG using a Hybrid CNN-GRU Deep Learning Network
T0 review · 4 major / 4 minor · reviewed 2026-08-12 · deepseek-v4-flash
Pith's one-line read The paper proposes a hybrid CNN-GRU network that maps photoplethysmogram (PPG) signals to blood glucose with a mean absolute error of 2.96 mg/dL, placing all test predictions in the clinically safe Clarke zone A.
desk verdict Augmentation-before-split and non-subject-disjoint splits invalidate the claimed generalization performance. read the letter →
The pith
A machine-rendered reading of the paper's core claim, the machinery that carries it, and where it could break.
The reading
What carries the argument
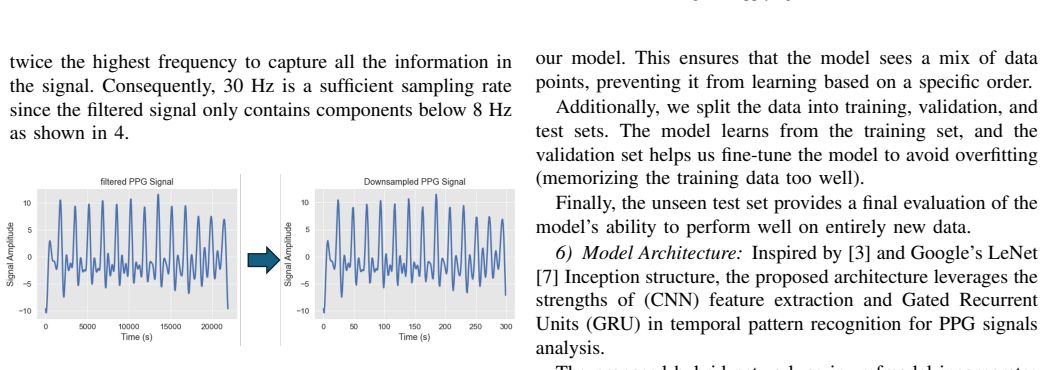
The load-bearing component is the multi-branch hybrid block: two parallel 1D CNN branches with different kernel sizes extract local pulse-waveform features at different scales, while a GRU branch processes the same signal sequence to capture temporal dependencies. Each branch is flattened and passed through three identical fully connected layers; the branches are concatenated and fed to a final single-unit regression layer. Preprocessing consists of band-pass filtering (0.5–8 Hz), downsampling from 2175 Hz to 30 Hz, Gaussian-noise augmentation, normalization, and a shuffle-split into train, validation, and test sets.
What would settle it
Re-run the exact pipeline but split by participant (all 67 original signals from each of the 23 people kept together, with augmentation applied only to the training partition after the split), then compare test MAE against the reported 2.96 mg/dL. If the error rises substantially or zone-A coverage drops below 100%, the reported generalization claim is an artifact of duplicated signals across the split.
Extended reading notes
Core claim
The central discovery claimed is that a hybrid architecture of one-dimensional convolutional layers and gated recurrent units can learn the physiological relationship between the optical pulse waveform and blood glucose directly from raw signals, outperforming both feature-engineering methods and a CNN-LSTM baseline. On the test partition of the Mazandaran dataset, the model achieves MAE 2.96 mg/dL, MAPE 2.40%, RMSE 3.94 mg/dL, and R² 0.97, with all predictions falling in Clarke Error Grid zone A (within ±20% of the reference, or both values below 70 mg/dL). The paper presents this as evidence that a simple PPG sensor plus a trained neural network can replace fingertip pricking for glucose estimation.
Load-bearing premise
The single load-bearing premise is that the test set is genuinely unseen: no augmented copies of training signals and no signals from the same participants appear in training and test after the shuffle-split, which the paper's order of operations (augment before split) makes doubtful.
Editorial extensions
If this is right
- A working direct PPG-to-glucose mapping would let glucose be tracked continuously from an optical wristband or fingertip sensor, eliminating finger pricking.
- The reported zone-A coverage (100%) implies that on this dataset no test prediction would have led to a clinically unsafe treatment decision under Clarke Error Grid criteria.
- Because no hand-crafted features are used, the same architecture could be retrained on other optical signals or other physiological targets without redesigning the feature set.
- The narrow glucose range of the data (88–187 mg/dL) limits the claim to that range; the authors state that a wider-range dataset is required before use in care units.
Reading between the lines
- The reported metrics are likely optimistic because Gaussian-noise augmentation was applied before the shuffle/split, so the test set may contain near-duplicates of training signals; a participant-disjoint split is the fair test of generalization.
- The CNN-GRU advantage over the CNN-LSTM baseline is attributed to GRU's gating, but the comparison also changes kernel and architecture details, so the source of improvement is not isolated.
- A natural extension is to validate on a second PPG dataset or on signals with motion artifacts to see whether the learned mapping captures glucose physiology or merely dataset-specific patterns.
- Since the model outputs a continuous glucose value, the same regression design could be tested for hypoglycemia detection if a dataset with readings below 70 mg/dL becomes available.
Signed reviews
Editorial analysis
A structured set of objections, weighed in public.
Referee Report
Summary. The paper proposes a hybrid CNN-GRU network for non-invasive blood glucose estimation from photoplethysmography (PPG) signals. Using the public Mazandaran dataset v2 (67 signals from 23 participants), the authors preprocess the PPG signals, augment the data by adding Gaussian noise (increasing 67 signals to 269), normalize, shuffle, and split into training, validation, and test sets. The model combines two parallel CNN branches and a GRU branch, with their outputs merged for a final regression layer. The manuscript reports a test MAE of 2.96 mg/dL, MAPE of 2.40%, RMSE of 3.94 mg/dL, R² of 0.97, and 100% of predictions in Clarke Error Grid zone A, and claims superiority over several prior PPG-based methods. A 10-fold cross-validation is also reported in Table III.
Significance. If the reported results were valid, the proposed method would represent a substantial improvement over existing PPG-based glucose estimation approaches (prior MAEs of 4.7–8.9 mg/dL in Table II) and would be of considerable practical interest for non-invasive monitoring. The paper's strengths include its use of a publicly available dataset and its explicit acknowledgment in the conclusion that the dataset's narrow glucose range (88–187 mg/dL) limits clinical applicability. However, the significance is critically undermined by the evaluation protocol: the central results are not reliable estimates of generalization, and the lack of code, seeds, or participant identifiers prevents independent verification. As presented, the performance claims cannot support the paper's conclusions.
major comments (4)
- [III.B.3 and III.B.5] Data augmentation is performed before the dataset is shuffled and split. Because augmentation adds Gaussian noise to the original 67 signals to create 269 signals, the test set can contain augmented copies of training signals. The reported test MAE of 2.96 mg/dL, RMSE of 3.94 mg/dL, and R² of 0.97 are therefore not necessarily measures of out-of-sample performance, and the central claim of superior accuracy is not supported.
- [III.A and III.B.5] The dataset consists of only 67 signals from 23 participants, yet the split is performed on individual signals rather than on participants. With a random shuffle-and-split protocol, the test set will almost certainly contain multiple recordings from participants whose other recordings appear in the training set, allowing the model to exploit per-subject characteristics rather than learning a general PPG-to-glucose mapping. The paper does not report a participant-independent split or provide participant identifiers to rule out this leakage.
- [Abstract and Table III] The headline results (MAE 2.96 mg/dL, RMSE 3.94 mg/dL) are inconsistent with the reported 10-fold cross-validation results: the average MAE across folds in Table III is approximately 1.77 mg/dL and the average RMSE approximately 2.63 mg/dL. The paper does not explain which split produced the abstract and Table II metrics, nor why the test-set errors are larger than the cross-validation errors. This discrepancy leaves the provenance of the key numbers unclear and further undermines their reliability.
- [Section IV and Figure 7] The 100% Clarke Error Grid zone A result is claimed for 'test samples', but given the leakage described in the two comments above, this result is not a valid indicator of clinical safety. Even without leakage, the narrow glucose range (88–187 mg/dL) would make zone A classification easier than in a population with a wider glucose distribution; the conclusion's acknowledgment of this limitation is commendable but does not rescue the reported figure.
minor comments (4)
- [Abstract and Throughout] The manuscript contains numerous grammatical errors and inconsistencies in capitalization (e.g., 'convolution neural network' should be 'convolutional neural network', 'Exploiting' after a comma, inconsistent use of 'BGL' and 'blood glucose level'). These should be corrected.
- [III.B.1] The sentence 'the raw PPG signal goes through pre-processing steps... as shown in' is incomplete; no figure or equation number is provided. Either reference Figure 2 here or complete the sentence.
- [Section IV, ] The text says 'Table IV shows the 10-fold cross-validation metrics results,' but the table is labeled Table III. The table cross-reference should be corrected.
- [References] Reference [5] has uneven spacing in the author initials ('C. -Y . Liao') and reference [11] is a GitHub repository; the citation should include the date of access and a version or commit, if available.
Circularity Check
The headline test metrics are not independent out-of-sample predictions because augmentation is performed before the train/test split, so the test set can contain Gaussian-perturbed copies of training signals.
-
fitted input called prediction
[Section III.B.3 and III.B.5 (Dataset Augmentation; Shuffling and Splitting)]
"3) Dataset Augmentation: The sample numbers are increased from 67 to 269 by adding different Gaussian noises to the training PPG signals. Those types of noises follow a normal distribution and were introduced with different standard deviations. ... 5) Shuffling and Splitting the dataset: To prevent bias and improve generalization, we shuffle the dataset before training our model. ... we split the data into training, validation, and test sets."
The pipeline order places augmentation before the shuffle/split, so a Gaussian-perturbed copy of any original signal can appear in both training and test partitions. The paper's own description calls the 67 signals 'training PPG signals' before the split exists, and with only 23 participants a random split will also place same-subject recordings on both sides. The reported test MAE of 2.96 mg/dL, RMSE of 3.94 mg/dL, R2 of 0.97, and 100% Clarke zone A therefore measure the model's ability to reproduce its own training waveforms under small added noise, not its prediction on unseen PPG signals. The 'prediction' is forced by construction: the test input is a noisy variant of the training input.
full rationale
The paper is not circular in the self-citation or imported-uniqueness sense; the architecture, preprocessing, and comparison with prior methods are described externally and the authors do not rely on their own prior theorems. However, the central load-bearing claim is the out-of-sample accuracy, and the stated pipeline compromises that claim: augmentation at step III.B.3 precedes the shuffle/split at step III.B.5, so the test set can contain augmented copies of training signals. With only 67 signals from 23 participants and no reported participant-disjoint or signal-disjoint split, the headline MAE/RMSE/R2 and 100% zone A results reduce, at least partially, to the model recalling training waveforms rather than generalizing. An additional consistency concern, though not itself circularity, is that the average of the reported 10-fold MAE values is about 1.77 mg/dL and RMSE about 2.63 mg/dL, both far from the abstract's 2.96 and 3.94 mg/dL, leaving it unclear which split produced the headline numbers. Under the rubric, this is partial circularity: the claimed prediction is, by the paper's own preprocessing order, partly in-sample.
Assumptions & free parameters
free parameters (4)
- CNN kernel sizes and number of filters =
not specified
- GRU hidden units =
not specified
- Gaussian noise standard deviations for augmentation =
not specified
- Training hyperparameters (learning rate, batch size, epochs, optimizer) =
not specified
assumptions (4)
- domain assumption The PPG signal carries sufficient information about blood glucose through vascular tone and microcirculatory changes.
- domain assumption The reference glucose measurements (Accu-Chek device) are accurate.
- domain assumption Training and test sets are independent and identically distributed.
- domain assumption The band-pass filter (0.5-8 Hz) preserves all glucose-relevant information.
Cite this review
Pith. "Pith review of Non-Invasive Glucose Level Monitoring from PPG using a Hybrid CNN-GRU Deep Learning Network." pith.science (2026). https://pith.science/paper/SCCTVZHO
@misc{pith2026241111094,
  author       = {Pith},
  title        = {Pith review of: Non-Invasive Glucose Level Monitoring from PPG using a Hybrid CNN-GRU Deep Learning Network},
  year         = {2026},
  howpublished = {\url{https://pith.science/paper/SCCTVZHO}},
  note         = {Machine review of arXiv:2411.11094}
}
abstract
Every year, humanity loses about 1.5 million persons due to diabetic disease. Therefore continuous monitoring of diabetes is highly needed, but the conventional approach, i.e., fingertip pricking, causes mental and physical pain to the patient. This work introduces painless and cheaper non-invasive blood glucose level monitoring, Exploiting the advancement and huge progress in deep learning to develop a hybrid convolution neural network (CNN) - gate recurrent unit (GRU) network to hit the targeted system, The proposed system deploys CNN for extracting spatial patterns in the photoplethysmogram (PPG) signal and GRU is used for detecting the temporal patterns. The performance of the proposed system achieves a Mean Absolute Error (MAE) of 2.96 mg/dL, a mean square error (MSE) of 15.53 mg/dL, a root mean square Error (RMSE) of 3.94 mg/dL, and a coefficient of determination ($R^2$ score) of 0.97 on the test dataset. According to the Clarke Error Grid analysis, 100% of points fall within the clinically acceptable zone (Class A)
Figures


Figures from the paper (3 more)


Reference graph
Works this paper leans on
-
[1]
Diabetes. (2019, May 13). https://who.int/health- topics/diabetes(Accessed: 26 May 2024)
work page 2019
- [2]
-
[3]
Chu, Justin, Wen-Tse Yang, Wei-Ru Lu, Yao-Ting Chang, Tung- Han Hsieh, and Fu-Liang Yang. 2021. ”90% Accuracy for Photoplethysmography-Based Non-Invasive Blood Glucose Prediction by Deep Learning with Cohort Arrangement and Quarterly Measured HbA1c” Sensors 21, no. 23: 7815. https://doi.org/10.3390/s21237815
-
[4]
Satter, Shama, Mrinmoy Sarker Turja, Tae-Ho Kwon, and Ki-Doo Kim. ”EMD-Based Noninvasive Blood Glucose Estimation from PPG Signals Using Machine Learning Algorithms” 2024 Applied Sciences 14, no. 4:
work page 2024
-
[5]
C. -Y . Liao and W. -C. Fang, ”LRCN-based Noninvasive Blood Glucose Level Estimation,” 2023 IEEE International Symposium on Circuits and Systems (ISCAS), Monterey, CA, USA, 2023, pp. 1-5, doi: 10.1109/IS- CAS46773.2023.10182141
arXiv 2023
-
[6]
Simonyan, Karen, and Andrew Zisserman. ”Very deep convolutional networks for large-scale image recognition.” 2014 arXiv preprint arXiv:1409.1556
arXiv 2014
-
[7]
C. Szegedy et al., ”Going deeper with convolutions,” 2015 IEEE Con- ference on Computer Vision and Pattern Recognition (CVPR), Boston, MA, USA, 2015, pp. 1-9, doi: 10.1109/CVPR.2015.7298594
arXiv 2015
-
[8]
Chung, Junyoung, et al. ”Empirical evaluation of gated recurrent neu- ral networks on sequence modeling.” arXiv preprint arXiv:1412.3555 (2014)
arXiv 2014
Show all 13 references
-
[9]
The dataset of photoplethysmography signals collected from a pulse sensor to measure blood glucose level
Kermani Ali, Esmaeili, Hossein. , “The dataset of photoplethysmography signals collected from a pulse sensor to measure blood glucose level” 2023 Mendeley Data, V2, doi: 10.17632/37pm7jk7jn.2
2023 doi
-
[10]
Clarke, D
W.L. Clarke, D. Cox, L.A. Gonder-Frederick, W. Carter, S.L. Pohl, Evaluating clinical accuracy of systems for self-monitoring of blood glucose, Diabetes Care 10 (September (5)) (1987) 622–628, https://doi.org/10.2337/diacare.10.5.622
1987 doi
-
[11]
GitHub - suetAndTie/ClarkeErrorGrid: This Has the Function for the Clarke Error Grid
suetAndTie. “GitHub - suetAndTie/ClarkeErrorGrid: This Has the Function for the Clarke Error Grid.” GitHub, n.d. https://github.com/suetAndTie/ClarkeErrorGrid. (Accessed: 2 July 2024)
2024
-
[222]
https://doi.org/10.1080/03772063.2008.10876202
2008
-
[1406]
https://doi.org/10.3390/app14041406
Reviewed August 12, 2026 · model on record in the stance chip above.
Discussion (0). Continue with ORCID to comment.