REVIEW 4 major objections 5 minor 45 references
The Blue Horizontal-Branch Stars From the LAMOST Survey: Atmospheric Parameters
T0 review · 4 major / 5 minor · reviewed 2026-08-12 · deepseek-v4-flash
Pith's one-line read Adding photometric colors as training features lets a synthetic-spectrum model derive reliable stellar parameters for 5,355 BHB stars.
desk verdict Useful BHB-specific SLAM catalog with real low-S/N gains, but the headline error bars are validated on degraded HRS spectra rather than real LAMOST spectra and the color check is partly circular. read the letter →
The pith
A machine-rendered reading of the paper's core claim, the machinery that carries it, and where it could break.
The reading
What carries the argument
The central object is the SLAM model (Stellar Label Machine), a support vector regression that predicts stellar labels from normalized spectral flux. Here it is trained on synthetic spectra with four color indices – $(BP-G)$, $(G-RP)$, $(BP-RP)$, $(J-H)$ – appended as additional input features. The color indices provide a monotonic temperature scale that breaks the non-monotonic Balmer-line temperature sensitivity, and they anchor the model when spectral noise is high.
What would settle it
Compare the predicted $T_\mathrm{eff}$ for a large sample of BHB stars with independent high-resolution spectroscopic temperatures covering the full 7000–12000 K range; if the claimed 76 K scatter is real, the differences should follow that scatter, whereas a larger systematic offset at, say, $T_\mathrm{eff} > 10{,}000$ K or a metallicity-dependent trend would falsify the claim that the theoretical grid plus color features is unbiased.
Extended reading notes
Core claim
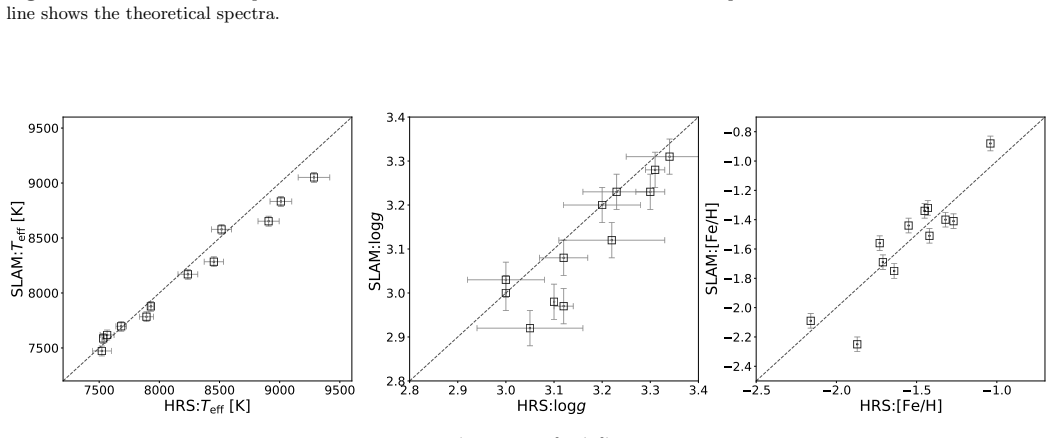
The paper establishes that a support-vector-regression model, trained on 5,000 theoretical A-type spectra generated from the grid of Allende Prieto et al. (2018) with four photometric color indices ($(BP-G)$, $(G-RP)$, $(BP-RP)$, $(J-H)$) appended as extra input dimensions, can predict $T_\mathrm{eff}$, $\log g$, and [Fe/H] for LAMOST low-resolution spectra of BHB stars. The predicted labels reproduce the color-temperature relation better than training on flux alone, and the scatter against 12 high-resolution reference stars is $\sigma(T_\mathrm{eff}) = 76$ K, $\sigma(\log g) = 0.04$ dex, and $\sigma([Fe/H]) = 0.09$ dex. The paper argues that the color indices act as a stable temperature metric, especially valuable when spectra have low signal-to-noise ratio.
Load-bearing premise
The load-bearing premise is that the theoretical A-type spectra, after Gaussian smoothing to $R \sim 1800$ and resampling to 390–580 nm, faithfully represent real LAMOST BHB spectra, and that the synthetic colors used for training are on the same photometric system as the dereddened observed Gaia and 2MASS colors; any bias in the grid or color zero-point transfers directly into every predicted label.
Editorial extensions
If this is right
- A public catalog of atmospheric parameters for 5,355 BHB stars from LAMOST DR5 becomes available for Galactic halo studies.
- The color-augmented training strategy could be applied to other surveys and to stars with similar Balmer degeneracy, extending reliable parameter estimation to faint, low-S/N spectra.
- Because the training set is purely synthetic, the method can be redeployed to new wavelength ranges or resolutions without requiring a large observed calibration sample.
- The parameter catalog will support distance estimates and kinematic studies of the halo, where BHB stars serve as standard candles.
- The reported random errors from duplicate observations (about 30 K, 0.1 dex, and 0.12 dex for $T_\mathrm{eff}$, $\log g$, and [Fe/H]) set expectations for the method on repeated low-S/N spectra.
Reading between the lines
- Editorial inference: the improvement from adding colors likely saturates once spectra are high signal-to-noise, so the method's chief advantage is for the roughly 40% of the sample with S/N below 40; extending it to even fainter surveys is a natural next step.
- Editorial inference: the 12-star high-resolution validation is small, so the quoted calibration uncertainties could change with a larger comparison sample; a natural test is to apply the trained model to BHB stars from other surveys with published high-resolution parameters.
- Editorial inference: reliance on theoretical spectra leaves the method vulnerable to missing physics such as diffusion, rotation, or alpha-element enhancement; stars with such peculiarities may show larger residuals than the quoted scatter.
- Editorial inference: the same color-feature trick could be tested on synthetic spectra with known diffusion stratification to see whether the model can be extended to hotter BHB stars, where the paper itself notes its metallicity predictions deviate.
Signed reviews
Editorial analysis
A structured set of objections, weighed in public.
Referee Report
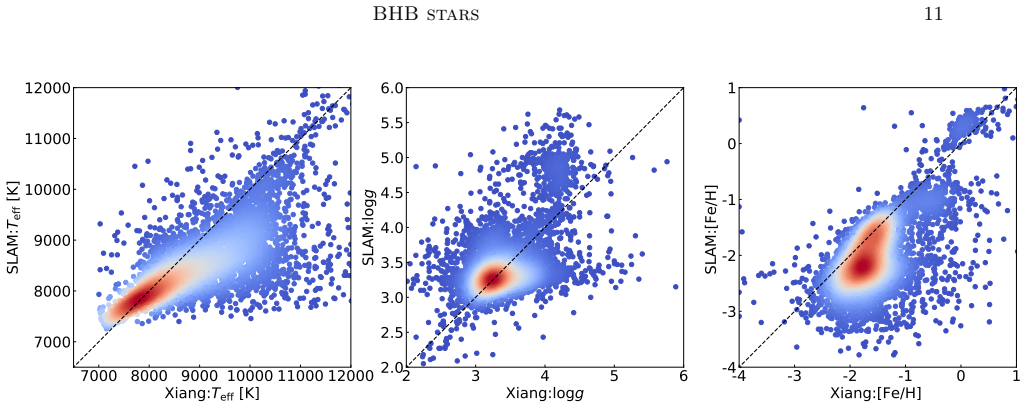
Summary. The paper applies the Stellar Label Machine (SLAM), an SVR-based data-driven model, to derive Teff, log g, and [Fe/H] for 5,355 blue horizontal-branch (BHB) stars from LAMOST DR5 low-resolution spectra. The training set consists of 5,000 synthetic A-type spectra from Allende Prieto et al. (2018), with four photometric colors ((BP-G), (G-RP), (BP-RP), (J-H)) added as extra input features. Validation includes five-fold cross-validation on noised synthetic spectra, duplicate observations, a comparison with Xiang et al. (2022), a color-consistency check against PARSEC synthetic colors, and a comparison with 12 high-resolution literature spectra. The paper claims that adding colors significantly improves Teff and log g accuracy at low S/N and quotes final uncertainties of 76 K, 0.04 dex, and 0.09 dex.
Significance. If the claimed accuracies are reliable, the resulting catalog would be a useful resource for Galactic-halo studies, and the idea of using broad-band colors to break the Balmer-line temperature degeneracy in A-type/BHB stars is sensible and potentially valuable for low-resolution surveys. The paper is transparent about some limitations, explicitly acknowledging the small high-resolution sample (Section 4.5), the 320 stars with unreliable out-of-grid log g and [Fe/H] (Section 4.1), and diffusion effects at Teff > 11,000 K. However, the central accuracy claims are not currently established: the main color-consistency validation is partly circular, and the external validation does not test the model on actual LAMOST spectra with their pipeline systematics. These issues are fixable but require additional analysis and revision.
major comments (4)
- [4.3] Section 4.3, Figure 7(d): The precision comparison used to claim that the flux+color model is more accurate than the flux-only model is not independent for the flux+color model. The observed (BP-RP)_0 colors used in the comparison were also used as input features in the flux+color training, so the small scatter (sigma = 0.020 mag) between these observed colors and the synthetic colors computed from the predicted parameters is largely a consequence of the model having been trained to reproduce those same colors. The flux-only panel (e) is not circular, but it cannot by itself establish the superiority of the flux+color model. The authors should validate the flux+color model on a held-out set, use a color not included as a training feature, or otherwise break the circularity.
- [4.5] Section 4.5, Figure 13: The external validation uses 12 stars that were not observed by LAMOST; their high-resolution spectra were downloaded from ESO, degraded to R ~ 1800, and then used for prediction. This tests the model on clean, carefully calibrated and normalized HRS data, not on LAMOST spectra with their own sky subtraction, fiber PSF, flux calibration, blue/red arm splicing, and normalization artifacts. The quoted uncertainties (76 K, 0.04 dex, 0.09 dex) therefore do not measure the accuracy on the 5,355 real LAMOST spectra. In addition, the text says the reference values are from Kinman et al. (2000) while the Figure 13 caption says Wilhelm et al. (1999); this discrepancy must be resolved.
- [4.1] Section 4.1: The text states that 320 of the 5,355 catalog stars have predicted labels outside the training parameter range, especially in log g and [Fe/H], and that for these stars "log g and metallicity are unreliable." Nevertheless these 320 stars are included in the final catalog (Table 1) and in the reported parameter distributions and statistics. The catalog claim for 5,355 stars is therefore overstated. The authors should either exclude these stars, flag them clearly in the catalog, or demonstrate that their inclusion does not affect the conclusions; the validation statistics should also be recomputed or reported separately for the reliable subset.
- [3.2] Section 3.2: The construction of the four color indexes used in training is not described in sufficient detail. The authors do not specify how the theoretical spectra were converted to Gaia and 2MASS colors (filter transmission curves, zero points, transformations), nor how these synthetic colors were placed on the same system as the dereddened observed colors. Since the colors dominate the temperature estimate at low S/N (Figure 4), any mismatch between the synthetic and observed color systems would bias Teff and, through the Teff-logg coupling, logg as well. A detailed description of the synthetic photometry and a demonstration of color-system consistency are needed.
minor comments (5)
- [Abstract] The abstract contains a typo, "precisoin", and the strikethrough markup "\sout{to}" should be removed.
- [1] Section 1 contains a typo: "Setion 5" should be "Section 5".
- [4.5] Section 4.5 contains a grammatical error: "The LAMOST survey have not observed these stars" should be "The LAMOST survey has not observed these stars".
- [4.1] Section 4.1 has several awkward phrasings, including "a small number of 320 stars" and the run-on sentence beginning "there may be other potential parameters that could account for these phenomena, their effects are likely to be secondary."
- [9] Figure 9: "around t=8000K" should be "around Teff = 8000 K", and there is a missing space in "abundance(Catelan 2009)".
Circularity Check
The central validation of the color-index improvement is circular: the same Gaia/2MASS colors used as SLAM input features are reused as the validation metric, so the small scatter in Figure 7(d) largely reflects the model's own input; the duplicate-observation error estimate is also anchored by constant photometric inputs.
-
fitted input called prediction
[Section 4.3, Figure 7 panel (d); cf. Section 3.2]
"In Section 3.2: 'we adopt these four color indexes as four pixels to be added to the training sample along with the flux'; Section 4.3: 'We have calculated the theoretical color indices (BP − RP) based on the atmospheric parameters estimated with color index (Figure 7 panel(d)) ... We compared these with the observed color indices ... The results show that σ(flux+color) = 0.020 ... indicating that SLAM training with color index provides more accurate temperature predictions.'"
The observed (BP−RP)_0 values used as the validation target in Figure 7(d) were included as four color-index features in the SLAM training set (Section 3.2). The model therefore learns a direct mapping from these colors to Teff; comparing the synthetic color of the predicted Teff with the same observed color measures only the internal consistency of that learned mapping, not independent accuracy. The test is not a prediction of a held-out quantity: the input color is reused as the output metric, so small scatter (0.020 mag) is expected by construction. The comparison with the flux-only model shows the feature's influence, but the claim that this demonstrates 'more accurate temperature predictions' is circular because the validation data were part of the input.
-
other
[Section 4.2, Figure 10]
"Section 4.2: 'It is due to the color index does not change between different spectra of the same star.' Also: 'The error of the training set with the color index included is significantly smaller than that of the training set without the color index considered.'"
The duplicate-observation scatter is presented as the random error of the pipeline, but the four color-index features are photometric quantities that are identical for every repeated spectrum of a given star. The paper explicitly attributes the improved precision to this constancy. Because the same input color is reused for all epochs, the Teff scatter across repeats is artificially anchored and no longer measures the full random error that would be present if the color input itself were re-measured or if the LAMOST spectrum were the only data. The quoted 'precision' thus indirectly re-imports the input feature as the error estimate.
full rationale
The core derivation is not wholly self-referential: SLAM is trained on external theoretical spectra (Allende Prieto et al. 2018), the catalog is an original prediction, and the 12-star HRS comparison is an independent external check, even though it degrades clean HRS data rather than testing actual LAMOST spectra. No load-bearing self-citation circularity is present; the citation of Ju et al. (2024) supplies the input sample, not the target atmospheric parameters. However, the paper's strongest validation of the claimed low-S/N improvement and the headline precision figures rests on a circular reuse of the same colors: the observed (BP−RP)_0 fed as a training feature is later used as the yardstick for the temperature accuracy, so the 0.020 mag scatter is largely a self-consistency measure. The duplicate-observation error estimate is similarly anchored by photometric colors that are constant across repeats. These issues make the central accuracy claims partially circular, warranting a score of 6 rather than a lower score; the catalog labels are not literally equal to the color inputs, and the HRS/PARSEC comparisons supply some independent content, so the paper is not fully circular.
Assumptions & free parameters
free parameters (3)
- SLAM hyperparameters (C, epsilon, gamma) =
C in {0.1,1,10}, epsilon=0.05, gamma in {0.1,1}
- Training set size =
5,000 randomly selected theoretical spectra
- Wavelength fitting window =
390 to 580 nm
assumptions (5)
- domain assumption The Allende Prieto et al. (2018) A-type synthetic grid is an unbiased representation of real BHB spectra after degradation and resampling.
- domain assumption Linear interpolation between grid points produces valid intermediate spectra.
- domain assumption Theoretical color indexes and observed dereddened Gaia/2MASS colors are on the same system.
- domain assumption The Wang & Chen (2019) extinction law and Green et al. (2019) reddening map correctly deredden the observed colors.
- domain assumption SVR with default hyperparameters generalizes from synthetic to observed spectra.
Cite this review
Pith. "Pith review of The Blue Horizontal-Branch Stars From the LAMOST Survey: Atmospheric Parameters." pith.science (2026). https://pith.science/paper/TDOTEBOV
@misc{pith2026241111250,
  author       = {Pith},
  title        = {Pith review of: The Blue Horizontal-Branch Stars From the LAMOST Survey: Atmospheric Parameters},
  year         = {2026},
  howpublished = {\url{https://pith.science/paper/TDOTEBOV}},
  note         = {Machine review of arXiv:2411.11250}
}
abstract
Blue horizontal-branch (BHB) stars are crucial for studying the structure of the Galactic halo. Accurate atmospheric parameters of BHB stars are essential for investigating the formation and evolution of the Galaxy. In this work, a data-driven technique named stellar label machine (SLAM) is used to estimate the atmospheric parameters of Large Sky Area Multi-Object Fiber Spectroscopic Telescope low-resolution spectra (LAMOST-LRS) for BHB stars with a set of A-type theoretical spectra as the training dataset. We add color indexes ($(BP-G), (G-RP), (BP-RP), (J-H)$) during the training process to constrain the stellar temperature further. Finally, we derive the atmospheric parameters ($T_\mathrm{eff}$, log\, $g$, [Fe/H]) for 5,355 BHB stars. Compared to existing literature results, our results are more robust, after taking the color index into account, the resulted precisoin of $T_\mathrm{eff}$, log\, $g$ is significantly improved, especially for the spectrum with low signal-to-noise ratio (S/N). Based on the duplicate observations with a S/N difference $< 20\%$, the random errors are around 30\,K, 0.1~dex, and 0.12~dex for $T_\mathrm{eff}$, log\,$g$, [Fe/H], respectively. The stellar labels provided by SLAM are also compared to those from the high-resolution spectra in literature. The standard deviation between the predicted star labels and the published values from the high-resolution spectra is adopted as \sout{to} the statistical uncertainty of our results. They are $\sigma$($T_\mathrm{eff}$) = 76\,K, $\sigma$(log\,$g$) = 0.04~dex, and $\sigma$([Fe/H]) = 0.09~dex, respectively.
Figures


Figures from the paper (11 more)




Reference graph
Works this paper leans on
-
[1]
2018, A&A, 618, A25, doi: 10.1051/0004-6361/201732484
Allende Prieto, C., Koesterke, L., Hubeny, I., et al. 2018, A&A, 618, A25, doi: 10.1051/0004-6361/201732484
-
[2]
Beers, T. C., Preston, G. W., Shectman, S. A., Doinidis, S. P., & Griffin, K. E. 1992, AJ, 103, 267, doi: 10.1086/116060
doi:10.1086/116060 1992
-
[3]
Behr, B. B. 2003, The Astrophysical Journal Supplement Series, 149, 67
work page 2003
-
[4]
Behr, B. B. 2003, ApJS, 149, 67, doi: 10.1086/377509
doi:10.1086/377509 2003
-
[5]
2012, MNRAS, 427, 127, doi: 10.1111/j.1365-2966.2012.21948.x
Bressan, A., Marigo, P., Girardi, L., et al. 2012, MNRAS, 427, 127, doi: 10.1111/j.1365-2966.2012.21948.x
arXiv 2012
-
[6]
2009, Ap&SS, 320, 261, doi: 10.1007/s10509-009-9987-8
Catelan, M. 2009, Ap&SS, 320, 261, doi: 10.1007/s10509-009-9987-8
-
[7]
2019, A&A, 632, A105, doi: 10.1051/0004-6361/201936612
Chen, Y., Girardi, L., Fu, X., et al. 2019, A&A, 632, A105, doi: 10.1051/0004-6361/201936612
-
[8]
2012, Research in Astronomy and Astrophysics, 12, 1197, doi: 10.1088/1674-4527/12/9/003
Cui, X.-Q., Zhao, Y.-H., Chu, Y.-Q., et al. 2012, Research in Astronomy and Astrophysics, 12, 1197, doi: 10.1088/1674-4527/12/9/003
Show all 45 references
-
[9]
2024, Astronomy & Astrophysics, 685, A134
Culpan, R., Dorsch, M., Geier, S., et al. 2024, Astronomy & Astrophysics, 685, A134
2024
-
[10]
2021, A&A, 654, A107, doi: 10.1051/0004-6361/202040074
Culpan, R., Pelisoli, I., & Geier, S. 2021, A&A, 654, A107, doi: 10.1051/0004-6361/202040074
2021 doi
-
[11]
J., Belokurov, V., & Evans, N
Deason, A. J., Belokurov, V., & Evans, N. W. 2011, MNRAS, 416, 2903, doi: 10.1111/j.1365-2966.2011.19237.x Gaia Collaboration, Brown, A. G. A., Vallenari, A., et al. 2021, A&A, 650, C3, doi: 10.1051/0004-6361/202039657e
2011
-
[12]
O., & Corbally, Christopher, J
Gray, R. O., & Corbally, Christopher, J. 2009, Stellar Spectral Classification
2009
-
[13]
2019, ApJ, 887, 93, doi: 10.3847/1538-4357/ab5362
Finkbeiner, D. 2019, ApJ, 887, 93, doi: 10.3847/1538-4357/ab5362
2019 doi
-
[14]
L., & Sargent, A
Greenstein, J. L., & Sargent, A. I. 1974, ApJS, 28, 157, doi: 10.1086/190315 Guo , Y., Zhang, B., Liu, C., et al. 2021, ApJS, 257, 54, doi: 10.3847/1538-4365/ac2ded
1974 doi
-
[15]
R., Pols, O
Hurley, J. R., Pols, O. R., & Tout, C. A. 2000, MNRAS, 315, 543, doi: 10.1046/j.1365-8711.2000.03426.x
2000
-
[16]
2016, ApJS, 226, 1, doi: 10.3847/0067-0049/226/1/1
Ji, W., Cui, W., Liu, C., et al. 2016, ApJS, 226, 1, doi: 10.3847/0067-0049/226/1/1
2016 doi
-
[17]
2024, ApJS, 270, 11, doi: 10.3847/1538-4365/ad0df9
Ju, J., Cui, W., Huo, Z., et al. 2024, ApJS, 270, 11, doi: 10.3847/1538-4365/ad0df9
2024 doi
- [18]
-
[19]
S., Beers, T
Lee, Y. S., Beers, T. C., Sivarani, T., et al. 2008, AJ, 136, 2022, doi: 10.1088/0004-6256/136/5/2022
2008 doi
-
[20]
2021, ApJS, 253, 45, doi: 10.3847/1538-4365/abe1c1
Li, J., Liu, C., Zhang, B., et al. 2021, ApJS, 253, 45, doi: 10.3847/1538-4365/abe1c1
2021 doi
-
[21]
L., Du, C.-D., et al
Li, Y.-B., Luo, A. L., Du, C.-D., et al. 2018, ApJS, 234, 31, doi: 10.3847/1538-4365/aaa415
2018 doi
-
[22]
2019, ApJS, 241, 32, doi: 10.3847/1538-4365/ab0a0d
Liu, Z., Cui, W., Liu, C., et al. 2019, ApJS, 241, 32, doi: 10.3847/1538-4365/ab0a0d
2019 doi
-
[23]
2023, Monthly Notices of the Royal Astronomical Society, 519, 995
Liu, Z., Cui, W., Zhao, G., et al. 2023, Monthly Notices of the Royal Astronomical Society, 519, 995
2023
-
[24]
2015, ApJ, 808, 16, doi: 10.1088/0004-637X/808/1/16
Zasowski, G. 2015, ApJ, 808, 16, doi: 10.1088/0004-637X/808/1/16
2015 doi
-
[25]
W., & Pe˜ narrubia, J
Niederste-Ostholt, M., Belokurov, V., Evans, N. W., & Pe˜ narrubia, J. 2010, ApJ, 712, 516, doi: 10.1088/0004-637X/712/1/516
2010 doi
-
[26]
E., & Hawkins, M
Norris, J. E., & Hawkins, M. R. S. 1991, ApJ, 380, 104, doi: 10.1086/170566 BHB stars 15
1991 doi
-
[27]
2009, Permutation Tests for Studying Classifier Performance
Ojala, M., & Garriga, G. 2009, Permutation Tests for Studying Classifier Performance. 2009 Ninth IEEE Int Conf Data Min, IEEE
2009
-
[28]
2015, Optics letters, 40, 882
Short, N., Hu, S., Gurram, P., Gurton, K., & Chan, A. 2015, Optics letters, 40, 882
2015
-
[29]
R., et al
Sirko, E., Goodman, J., Knapp, G. R., et al. 2004, AJ, 127, 899, doi: 10.1086/381483
2004 doi
-
[30]
F., Cutri, R
Skrutskie, M. F., Cutri, R. M., Stiening, R., et al. 2006, AJ, 131, 1163, doi: 10.1086/498708
2006 doi
- [31]
-
[32]
2019, MNRAS, 490, 5757, doi: 10.1093/mnras/stz2935
Starkenburg, E., Youakim, K., Martin, N., et al. 2019, MNRAS, 490, 5757, doi: 10.1093/mnras/stz2935
2019 doi
-
[33]
J., Li, Z.-Y., Smith, M
Vickers, J. J., Li, Z.-Y., Smith, M. C., & Shen, J. 2021, ApJ, 912, 32, doi: 10.3847/1538-4357/abe4d0
2021 doi
-
[34]
2019, ApJ, 877, 116, doi: 10.3847/1538-4357/ab1c61
Wang, S., & Chen, X. 2019, ApJ, 877, 116, doi: 10.3847/1538-4357/ab1c61
2019 doi
-
[35]
C., & Gray, R
Wilhelm, R., Beers, T. C., & Gray, R. O. 1999, AJ, 117, 2308, doi: 10.1086/300824
1999 doi
-
[36]
2021, ApJS, 253, 22, doi: 10.3847/1538-4365/abd6ba —
Xiang, M., Rix, H.-W., Ting, Y.-S., et al. 2021, ApJS, 253, 22, doi: 10.3847/1538-4365/abd6ba —. 2022, A&A, 662, A66, doi: 10.1051/0004-6361/202141570
2021 doi
-
[37]
X., Rix, H
Xue, X. X., Rix, H. W., Zhao, G., et al. 2008, ApJ, 684, 1143, doi: 10.1086/589500
2008 doi
-
[38]
2011, ApJ, 738, 79, doi: 10.1088/0004-637X/738/1/79
Xue, X.-X., Rix, H.-W., Yanny, B., et al. 2011, ApJ, 738, 79, doi: 10.1088/0004-637X/738/1/79
2011 doi
-
[39]
J., Kent, S., et al
Yanny, B., Newberg, H. J., Kent, S., et al. 2000, ApJ, 540, 825, doi: 10.1086/309386
2000 doi
-
[40]
J., Johnson, J
Yanny, B., Newberg, H. J., Johnson, J. A., et al. 2009, ApJ, 700, 1282, doi: 10.1088/0004-637X/700/2/1282
2009 doi
-
[41]
2017, ApJS, 232, 16, doi: 10.3847/1538-4365/aa88a9
Yao, Y., Liu, C., Deng, L., de Grijs, R., & Matsunaga, N. 2017, ApJS, 232, 16, doi: 10.3847/1538-4365/aa88a9
2017 doi
-
[42]
G., Adelman, J., Anderson, John E., J., et al
York, D. G., Adelman, J., Anderson, John E., J., et al. 2000, AJ, 120, 1579, doi: 10.1086/301513
2000 doi
-
[43]
2020a, ApJS, 246, 9, doi: 10.3847/1538-4365/ab55ef
Zhang, B., Liu, C., & Deng, L.-C. 2020a, ApJS, 246, 9, doi: 10.3847/1538-4365/ab55ef
-
[44]
2020b, Research in Astronomy and Astrophysics, 20, 051, doi: 10.1088/1674-4527/20/4/51
Zhang, B., Liu, C., Li, C.-Q., et al. 2020b, Research in Astronomy and Astrophysics, 20, 051, doi: 10.1088/1674-4527/20/4/51
-
[45]
2012, Research in Astronomy and Astrophysics, 12, 723, doi: 10.1088/1674-4527/12/7/002
Zhao, G., Zhao, Y.-H., Chu, Y.-Q., Jing, Y.-P., & Deng, L.-C. 2012, Research in Astronomy and Astrophysics, 12, 723, doi: 10.1088/1674-4527/12/7/002
2012 doi
Reviewed August 12, 2026 · model on record in the stance chip above.
Discussion (0). Continue with ORCID to comment.