REVIEW 3 major objections 4 minor 70 references
Intrinsic and Environmental Effects on the Distribution of Star Formation in TNG100 Galaxies
T0 review · 3 major / 4 minor · reviewed 2026-08-12 · deepseek-v4-flash
Pith's one-line read Using the TNG100 cosmological simulation, this paper argues that high-mass galaxies quench from the inside out through black-hole feedback, while low-mass galaxies quench from the outside in through their environments.
desk verdict A careful, useful TNG100 profile atlas that maps intrinsic and environmental drivers of radial star-formation structure; the causal language outruns the correlation-based evidence, but the descriptive core is solid. read the letter →
The pith
A machine-rendered reading of the paper's core claim, the machinery that carries it, and where it could break.
The reading
What carries the argument
The load-bearing tool is the population-averaged radial profile. The authors project stellar particles of each galaxy face-on, bin by $R/R_e$, and compute the luminosity-weighted age $\mathrm{age}_L$ from all particles in a bin and $\Delta\Sigma_{\mathrm{SFR}}$, the logarithmic offset of the star-formation surface density from the resolved star-forming main sequence, with unresolved bins assigned a fixed floor of $\mathrm{sSFR}=10^{-12}\,\mathrm{yr}^{-1}$. The gradient $\nabla_{1R_e}$ measured from $0$ to $1\,R_e$ turns a profile into one number: negative $\mathrm{age}_L$ slopes and positive $\Delta\Sigma_{\mathrm{SFR}}$ slopes mean inside-out quenching, while flat or positive outer $\mathrm{age}_L$ slopes mean outside-in quenching. For satellites, the joining redshift $z_j$ and the change in bound star-forming gas mass $\Delta M_{\mathrm{SFG}}$ since joining serve as direct diagnostics of how much environmental exposure a galaxy has experienced.
What would settle it
Recompute the low-mass satellite $\Delta\Sigma_{\mathrm{SFR}}$ and $\mathrm{age}_L$ profiles after removing or lowering the fixed star-formation floor, or repeat the same profile construction in a higher-resolution run of the same simulation; if the positive outer $\mathrm{age}_L$ slopes and quenched outer bins weaken, the outside-in conclusion is driven by the resolution floor.
Extended reading notes
Core claim
The paper's discovery is a division of labour between two quenching directions in the TNG100 universe. For high-mass galaxies ($M_*>10^{10.5}\,M_\odot$), the radial profiles steepen as black hole mass and cumulative quasar-mode feedback energy increase: gradients of $\mathrm{age}_L$ become more negative and gradients of $\Delta\Sigma_{\mathrm{SFR}}$ become more positive, signalling that star formation is being shut down first in the centre. Above roughly $M_{\mathrm{BH}}\sim10^{8.5}\,M_\odot$ and $\Sigma E_{\mathrm{QM}}\sim10^{17}$ these galaxies are entirely quenched, and further feedback only flattens the age profile. For low-mass galaxies ($M_*<10^{10}\,M_\odot$) black hole properties barely change the profiles; instead, low-mass centrals that are quenched tend to lack a seeded black hole, and low-mass satellites are quenched when they live in halos above $M_H\sim10^{13.5}{-}10^{14}\,M_\odot$, joined their hosts early, and have lost star-forming gas. The outskirts of such satellites are old and quenched while their centres can still form stars, which is the outside-in pattern. The overall conclusion is that intrinsic AGN feedback drives inside-out quenching at high mass, while environmental processes, primarily interactions with the host halo, drive outside-in quenching at low mass.
Load-bearing premise
The conclusion that low-mass galaxies quench from the outside in rests on the fixed star-formation floor of $10^{-12}\,\mathrm{yr}^{-1}$ assigned to spatial bins where TNG100 cannot resolve star formation, so the quenched outer regions could partly be a resolution effect rather than genuine environmental quenching.
Editorial extensions
If this is right
- High-mass galaxies in TNG100 quench through the same channel whether they are centrals or satellites, so black-hole feedback, not environment, sets their radial star-formation structure.
- Completely quenched high-mass systems have old, flat $\mathrm{age}_L$ profiles, so a flat profile should be read as the end stage of inside-out quenching rather than as a sign of environmental stripping.
- Low-mass satellite quenching in TNG100 is controlled by the host halo: quenched systems cluster at $M_H>10^{13.5}\,M_\odot$ with early joining times and $\Delta M_{\mathrm{SFG}}<0$, even when local overdensity is modest.
- Environmental quenching changes the outskirts first, so observations that measure beyond about one effective radius are needed to see it; inner gradients alone will miss the outside-in signal.
- The spread within any environmental bin is large, meaning averages conceal a wide range of individual stripping histories.
Reading between the lines
- One extension the authors leave implicit is to apply the same $\Delta M_{\mathrm{SFG}}$ accounting to high-redshift satellites, which would test whether outside-in quenching begins only after group infall or can precede it.
- If the fixed star-formation floor were removed or refined, the outer quenched regions of low-mass satellites should be re-examined; a weaker outside-in signal in a higher-resolution version of the simulation would indicate that part of the pattern is a resolution artefact.
- The comparison with observed galaxies would be sharper if the profile construction mimicked the spaxel-binning used by integral-field surveys, since the paper notes that unresolved bins depress $\Delta\Sigma_{\mathrm{SFR}}$ at intermediate radii.
Editorial analysis
A structured set of objections, weighed in public.
Referee Report
Summary. The manuscript uses the TNG100 cosmological simulation to construct radial profiles of luminosity-weighted stellar age (age_L) and the resolved star-forming main-sequence offset (ΔΣ_SFR) for high-mass (M* > 10^10.5 Msun) and low-mass (M* < 10^10 Msun) central and satellite galaxies. For each population, the profiles are subdivided by intrinsic parameters (SMBH mass, cumulative AGN feedback energy, morphology) and environmental parameters (halo mass, local galaxy overdensity, satellite joining time, and change in star-forming gas mass). The central claim is that high-mass galaxies are quenched from the inside out by AGN feedback, while environmental processes, dominant for low-mass galaxies, quench galaxies from the outside in. In particular, low-mass satellite quenching is argued to occur primarily in massive host halos through gas depletion.
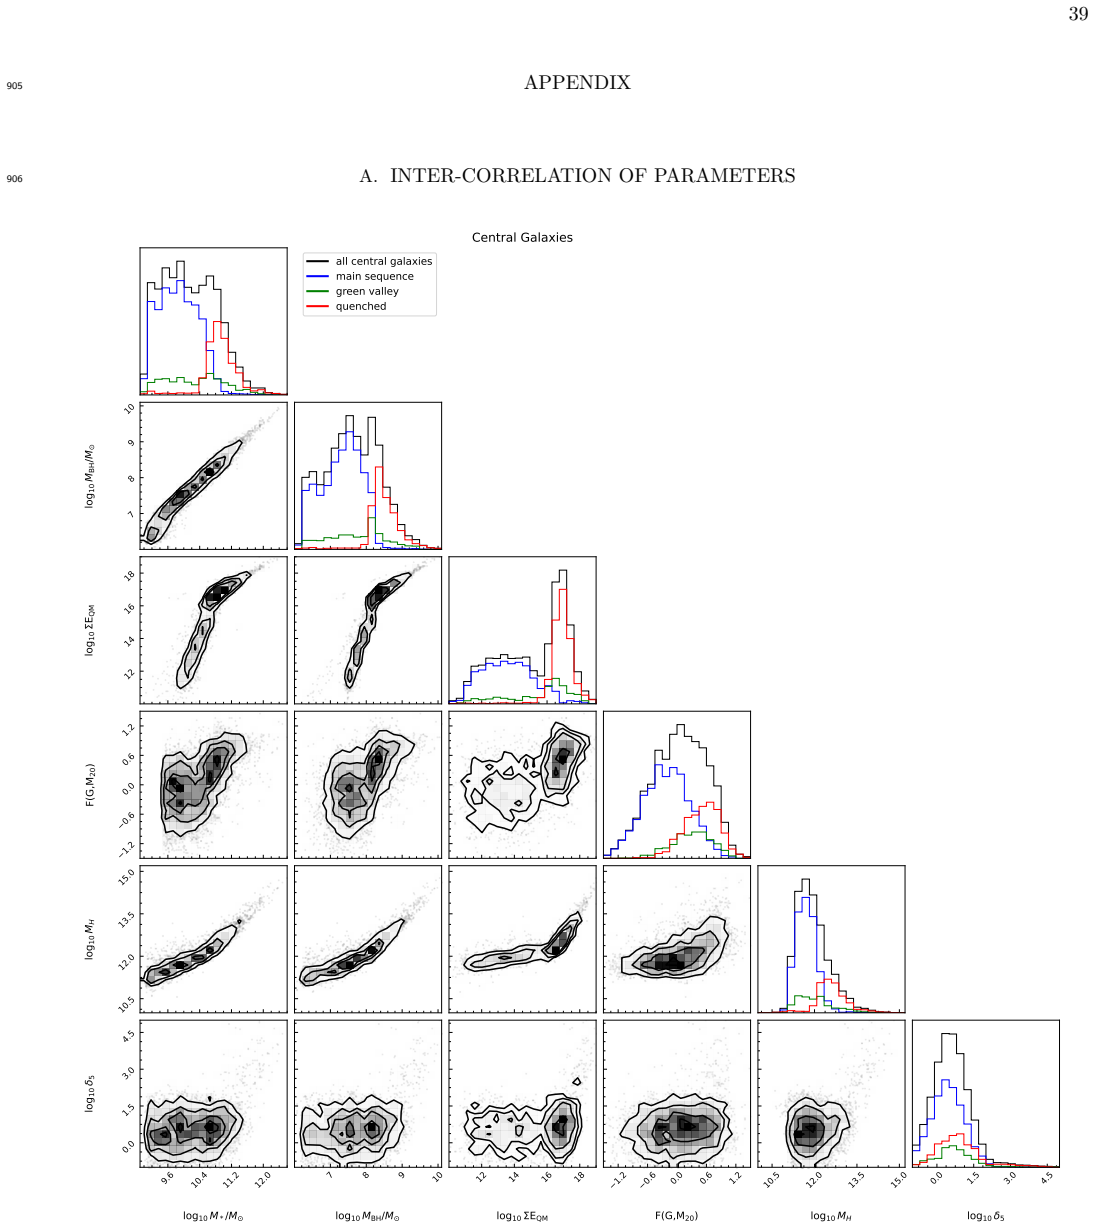
Significance. If confirmed, the paper provides a coherent and observationally relevant picture of quenching modes in a state-of-the-art cosmological simulation, linking AGN feedback to inside-out quenching at high mass and halo-driven processes to outside-in quenching at low mass. The analysis has notable strengths: bootstrap uncertainties, explicit and repeated caveats about simulation resolution and the unresolved-SFR floor, and an appendix (Appendix A) documenting inter-correlations among the parameters. The work is transparent and the claims are falsifiable. The main weaknesses are that the quantitative gradient metric is confined to R < 1Re and does not capture the outer-profile signatures on which the outside-in claim rests, the unresolved-SFR floor could contaminate the ΔΣ_SFR-based evidence, and the attribution to AGN feedback is partly degenerate with the tight stellar-mass–black-hole-mass correlation. These issues are addressable and do not, in my reading, invalidate the qualitative conclusions.
major comments (3)
- [Section 2 and Fig. 2] The fixed sSFR of 10^-12 yr^-1 assigned to bins with unresolved star formation is described in Section 2, and the text itself quotes McDonough et al. (2023) as noting that ΔΣ_SFR profiles are biased toward low values at intermediate radii. The abstract's claim that environmental processes drive quenching from the outside in is partly based on ΔΣ_SFR profiles at large radii (e.g., Fig. 8b for low-mass satellites in massive halos). The authors should demonstrate that this outer signal is not an artifact of the resolution floor, for instance by reporting the fraction of spatial bins at each radius that are assigned the fixed floor for each population, or by recomputing the profiles after excluding such bins.
- [Section 2 and Appendix B] The gradient ∇1Re is defined as the slope of a line fit over 0 ≤ r ≤ 1Re (Section 2), and all quantitative summaries in Appendix B report this quantity. However, the outside-in quenching evidence is described as a positive or flat slope at R ≳ 1Re (e.g., §4.1 for high-mass centrals with 10^13.5 < MH < 10^14, and §4.2 for δ5 > 10^1.5). Because the reported gradient excludes the region where the outside-in signal appears, the summary figures do not quantitatively support the central claim. Add an outer-radius gradient over, say, 1–1.5Re, or an outer-to-inner age contrast, and include it in the appendix summaries.
- [Section 3.1, §5.1, and Appendix A] The claim that AGN feedback drives inside-out quenching is based on the variation of profile shape and normalization with MBH and ΣEQM (Figs. 1–4). Appendix A (Fig. 17) demonstrates a tight correlation between stellar mass and MBH and ΣEQM for central galaxies, so the steepening gradients could be a mass effect. The text acknowledges these correlations but does not control for stellar mass. The authors should either show that the trends persist in narrow stellar-mass bins or perform a multivariate analysis (e.g., random forest or partial correlation) to separate the contributions of mass and BH properties. Without this, the assignment of the inside-out quenching to AGN feedback specifically remains underdetermined.
minor comments (4)
- [Section 3.1 (Figs. 3 and 4 legends)] The word 'negligable' appears in the legends of Figures 3 and 4; it should be 'negligible'.
- [Section 5.1] The sentence 'This indicating that mass rather than morphology likely drives quenching in high-mass TNG100 galaxies.' should read 'This indicates that mass rather than morphology likely drives quenching...'
- [Section 2] The phrase 'a combination of stellar particles formed in the last 20 and 100 Myr' is ambiguous about whether the ΣSFR maps are constructed from two separate tracer populations that are combined or averaged; please clarify.
- [Figure 15] The grey points that mark all individual low-mass central galaxies are difficult to identify behind the magenta density contours; a separate panel or a higher-contrast plotting style would improve readability.
Circularity Check
No significant circularity: all reported profiles are direct simulation measurements; the only self-references are prior methodological choices that do not force the conclusions.
full rationale
The paper's derived quantities (age_L and DeltaSigma_SFR radial profiles) are constructed directly from TNG100 stellar and gas particle data, not predicted from a fitted model. DeltaSigma_SFR is normalized to the resolved star-forming main sequence of McDonough et al. (2023), but that relation was established in prior work against observations and is not re-fit within this paper; using it as a reference frame does not make the reported profile shapes or their dependence on MBH, Sigma_EQM, halo mass, delta5, zj, or DeltaM_SFG circular. The high-/low-mass division is also taken from the same prior paper, but it is a sample-selection choice rather than a definition of the conclusion; the new subpopulations could have contradicted the earlier inside-out picture and therefore carry independent content. The fixed sSFR = 10^-12 yr^-1 floor for unresolved bins is a resolution limitation explicitly acknowledged in Section 2 and is not a fitted parameter renamed as a prediction; moreover, the outside-in quenching signal is also present in age_L profiles that do not depend on that floor. The MBH-Sigma_EQM degeneracy is acknowledged in Appendix A, and the paper benchmarks against external MaNGA results (Bluck et al. 2020b). No load-bearing step reduces by construction to its own input, no uniqueness theorem is imported from the authors, and no ansatz is smuggled in via self-citation.
Assumptions & free parameters
free parameters (3)
- Unresolved sSFR floor =
10^-12 yr^-1
- High/low stellar mass thresholds =
10^10.5 and 10^10 Msun
- Quenched galaxy definition =
>=1.1 dex below the star-forming main sequence
assumptions (3)
- domain assumption TNG100 subgrid models for AGN feedback and star formation are a faithful representation of galaxy evolution
- domain assumption Luminosity-weighted age profiles trace quenching rather than only natural inside-out aging
- ad hoc to paper The resolved star-forming main sequence from McDonough et al. (2023) is a valid baseline for ΔΣ_SFR
Cite this review
Pith. "Pith review of Intrinsic and Environmental Effects on the Distribution of Star Formation in TNG100 Galaxies." pith.science (2026). https://pith.science/paper/VERVJMI5
@misc{pith2026241113666,
  author       = {Pith},
  title        = {Pith review of: Intrinsic and Environmental Effects on the Distribution of Star Formation in TNG100 Galaxies},
  year         = {2026},
  howpublished = {\url{https://pith.science/paper/VERVJMI5}},
  note         = {Machine review of arXiv:2411.13666}
}
abstract
We present radial profiles of luminosity-weighted age, $age_L$, and $\Delta \Sigma_{SFR}$ for various populations of high- and low- mass central and satellite galaxies in the TNG100 cosmological simulation. Using these profiles, we investigate the impact of intrinsic and environmental factors on the radial distribution of star formation. For both central galaxies and satellites, we investigate the effects of black hole mass, cumulative AGN feedback energy, morphology, halo mass, and local galaxy overdensity on the profiles. In addition, we investigate the dependence of radial profiles of the satellite galaxies as a function of the redshifts at which they joined their hosts, as well as the net change in star-forming gas mass since the satellites joined their host. We find that high-mass ($M_*>10^{10.5} M_{\odot}$) central and satellite galaxies show evidence of inside-out quenching driven by AGN feedback. Effects from environmental processes only become apparent in averaged profiles at extreme halo masses and local overdensities. We find that the dominant quenching process for low-mass galaxies ($M_*<10^{10} M_{\odot}$) is environmental, generally occurring at low halo mass and high local galaxy overdensity for low-mass central galaxies and at high host halo masses for low-mass satellite galaxies. Overall, we find that environmental processes generally drive quenching from the outside-in.
Figures


Figures from the paper (30 more)




Reference graph
Works this paper leans on
-
[1]
, " * write output.state after.block = add.period write newline
ENTRY address archivePrefix author booktitle chapter doi edition editor eprint howpublished institution journal key month number organization pages publisher school series title misctitle type volume year version url label extra.label sort.label short.list INTEGERS output.state before.all mid.sentence after.sentence after.block FUNCTION init.state.consts ...
-
[2]
write newline
" write newline "" before.all 'output.state := FUNCTION format.url url empty "" new.block "" url * "" * if FUNCTION format.eprint eprint empty "" archivePrefix empty "" archivePrefix "arXiv" = new.block " " eprint * " " * new.block " " eprint * " " * if if if FUNCTION format.doi doi empty "" " " doi * " " * if FUNCTION format.pid doi empty eprint empty ur...
-
[3]
5R)x0ybޒ q(c`5\2 zjr k 'Aw 8\ ئ i O= -?ͣCy 歳w c BM->_s` aw B-D OxLX/L|5 b 8 w 3`r v#; `^1 fn
thebibliography [1] 20pt to REFERENCES 6pt =0pt -12pt 10pt plus 3pt =0pt =0pt =1pt plus 1pt =0pt =0pt -12pt =13pt plus 1pt =20pt =13pt plus 1pt \@M =10000 =-1.0em =0pt =0pt 0pt =0pt =1.0em @enumiv\@empty 10000 10000 `\.\@m \@noitemerr \@latex@warning Empty `thebibliography' environment \@ifnextchar \@reference \@latexerr Missing key on reference command E...
arXiv 2020
-
[4]
G., van den Bergh , S., & Nair , P
Abraham , R. G., van den Bergh , S., & Nair , P. 2003, , 588, 218, 10.1086/373919
doi:10.1086/373919 2003
-
[5]
Astropy Collaboration , Robitaille , T. P., Tollerud , E. J., et al. 2013, , 558, A33, 10.1051/0004-6361/201322068
-
[6]
Astropy Collaboration , Price-Whelan , A. M., Sip o cz , B. M., et al. 2018, , 156, 123, 10.3847/1538-3881/aabc4f
-
[7]
Astropy Collaboration , Price-Whelan , A. M., Lim , P. L., et al. 2022, apj, 935, 167, 10.3847/1538-4357/ac7c74
-
[8]
Beifiori, A., Courteau, S., Corsini, E. M., & Zhu, Y. 2012, Monthly Notices of the Royal Astronomical Society, 419, 2497, 10.1111/j.1365-2966.2011.19903.x
arXiv 2012
Show all 70 references
-
[9]
Bluck , A. F. L., Maiolino , R., S \'a nchez , S. F., et al. 3001 2020a, , 492, 96, 10.1093/mnras/stz3264
-
[10]
Bluck , A. F. L., Mendel , J. T., Ellison , S. L., et al. 2014, , 441, 599, 10.1093/mnras/stu594
2014 doi
-
[11]
Bluck , A. F. L., Piotrowska , J. M., & Maiolino , R. 2023, , 944, 108, 10.3847/1538-4357/acac7c
2023 doi
-
[12]
Bluck , A. F. L., Mendel , J. T., Ellison , S. L., et al. 2016, , 462, 2559, 10.1093/mnras/stw1665
2016 doi
-
[13]
Bluck, A. F. L., Maiolino, R., Piotrowska, J. M., et al. 3002 2020b, Monthly Notices of the Royal Astronomical Society, 499, 230, 10.1093/mnras/staa2806
-
[14]
A., Law , D
Bundy , K., Bershady , M. A., Law , D. R., et al. 2015, , 798, 7, 10.1088/0004-637X/798/1/7
2015 doi
-
[15]
F., Zibetti , S., et al
Cano-D \' az , M., S \'a nchez , S. F., Zibetti , S., et al. 2016, , 821, L26, 10.3847/2041-8205/821/2/L26
2016 doi
-
[16]
F., Bolatto , A
Colombo , D., Sanchez , S. F., Bolatto , A. D., et al. 2020, , 644, A97, 10.1051/0004-6361/202039005
2020 doi
-
[17]
F., & L \'o pez-S \'a nchez , \'A
Corcho-Caballero , P., Ascasibar , Y., S \'a nchez , S. F., & L \'o pez-S \'a nchez , \'A . R. 2023, , 520, 193, 10.1093/mnras/stad147
2023 doi
-
[18]
2019, Monthly Notices of the Royal Astronomical Society, 485, 4817, 10.1093/mnras/stz712
Donnari, M., Pillepich, A., Nelson, D., et al. 2019, Monthly Notices of the Royal Astronomical Society, 485, 4817, 10.1093/mnras/stz712
2019 doi
-
[19]
L., S \'a nchez , S
Ellison , S. L., S \'a nchez , S. F., Ibarra-Medel , H., et al. 2018, , 474, 2039, 10.1093/mnras/stx2882
2018 doi
-
[20]
A., Desai , V., Rudnick , G., et al
Finn , R. A., Desai , V., Rudnick , G., et al. 2018, , 862, 149, 10.3847/1538-4357/aac32a
2018 doi
-
[21]
F., et al
Garc \' a-Benito , R., Zibetti , S., S \'a nchez , S. F., et al. 2015, , 576, A135, 10.1051/0004-6361/201425080
2015 doi
-
[22]
2018, , 474, 3976, 10.1093/mnras/stx3078
Genel , S., Nelson , D., Pillepich , A., et al. 2018, , 474, 3976, 10.1093/mnras/stx3078
2018 doi
-
[23]
M., P \'e rez , E., Cid Fernandes , R., et al
Gonz \'a lez Delgado , R. M., P \'e rez , E., Cid Fernandes , R., et al. 2014, , 562, A47, 10.1051/0004-6361/201322011
2014 doi
-
[24]
M., Cid Fernandes , R., P \'e rez , E., et al
Gonz \'a lez Delgado , R. M., Cid Fernandes , R., P \'e rez , E., et al. 2016, , 590, A44, 10.1051/0004-6361/201628174
2016 doi
-
[25]
2019, , 872, 50, 10.3847/1538-4357/aafa84
Lin , L., Hsieh , B.-C., Pan , H.-A., et al. 2019, , 872, 50, 10.3847/1538-4357/aafa84
2019 doi
-
[26]
M., Primack , J., & Madau , P
Lotz , J. M., Primack , J., & Madau , P. 2004, , 128, 163, 10.1086/421849
2004 doi
-
[27]
2022, , 941, 205, 10.3847/1538-4357/aca326
Ma , W., Liu , K., Guo , H., et al. 2022, , 941, 205, 10.3847/1538-4357/aca326
2022 doi
-
[28]
M., Fritz, J., et al
Marasco, A., Poggianti, B. M., Fritz, J., et al. 2023, Monthly Notices of the Royal Astronomical Society, 525, 5359, 10.1093/mnras/stad2604
2023 doi
-
[29]
2018, , 480, 5113, 10.1093/mnras/sty2206
Marinacci , F., Vogelsberger , M., Pakmor , R., et al. 2018, , 480, 5113, 10.1093/mnras/sty2206
2018 doi
-
[30]
2009, , 707, 250, 10.1088/0004-637X/707/1/250
Martig , M., Bournaud , F., Teyssier , R., & Dekel , A. 2009, , 707, 250, 10.1088/0004-637X/707/1/250
2009 doi
-
[31]
B., et al
Matharu , J., Muzzin , A., Brammer , G. B., et al. 2021, , 923, 222, 10.3847/1538-4357/ac26c3
2021 doi
-
[32]
McDonough , B., Curtis , O., & Brainerd , T. G. 2023, , 958, 19, 10.3847/1538-4357/acfe0b
2023 doi
-
[33]
Naab , T., & Ostriker , J. P. 2017, , 55, 59, 10.1146/annurev-astro-081913-040019
2017 doi
-
[34]
P., Pillepich , A., Springel , V., et al
Naiman , J. P., Pillepich , A., Springel , V., et al. 2018, , 477, 1206, 10.1093/mnras/sty618
2018 doi
-
[35]
2015, Astronomy and Computing, 13, 12, 10.1016/j.ascom.2015.09.003
Nelson , D., Pillepich , A., Genel , S., et al. 2015, Astronomy and Computing, 13, 12, 10.1016/j.ascom.2015.09.003
2015 doi
-
[36]
2018, , 475, 624, 10.1093/mnras/stx3040
Nelson , D., Pillepich , A., Springel , V., et al. 2018, , 475, 624, 10.1093/mnras/stx3040
2018 doi
-
[37]
2019, Comput
Nelson, D., Springel, V., Pillepich, A., et al. 2019, Comput. Astrophys., 6, 2
2019
-
[38]
J., Tacchella, S., Diemer, B., et al
Nelson, E. J., Tacchella, S., Diemer, B., et al. 2021, Monthly Notices of the Royal Astronomical Society, 508, 219, 10.1093/mnras/stab2131
2021 doi
-
[39]
A., Bundy , K., Westfall , K
Oyarz \'u n , G. A., Bundy , K., Westfall , K. B., et al. 2023, , 947, 13, 10.3847/1538-4357/acbbca
2023 doi
-
[40]
L., et al
Pan , H.-A., Lin , L., Ellison , S. L., et al. 2024, , 964, 120, 10.3847/1538-4357/ad28c1
2024 doi
-
[41]
J., Renzini , A., & Carollo , M
Peng , Y.-j., Lilly , S. J., Renzini , A., & Carollo , M. 2012, , 757, 4, 10.1088/0004-637X/757/1/4
2012 doi
-
[42]
J., Kova c , K., et al
Peng , Y.-j., Lilly , S. J., Kova c , K., et al. 2010, , 721, 193, 10.1088/0004-637X/721/1/193
2010 doi
-
[43]
2018, , 475, 648, 10.1093/mnras/stx3112
Pillepich , A., Nelson , D., Hernquist , L., et al. 2018, , 475, 648, 10.1093/mnras/stx3112
2018 doi
-
[44]
2016, A&A, 594, A13
Planck Collaboration . 2016, A&A, 594, A13
2016
-
[45]
E., & Volonteri , M
Reines , A. E., & Volonteri , M. 2015, , 813, 82, 10.1088/0004-637X/813/2/82
2015 doi
-
[46]
F., Lotz , J
Rodriguez-Gomez , V., Snyder , G. F., Lotz , J. M., et al. 2019, , 483, 4140, 10.1093/mnras/sty3345
2019 doi
-
[47]
P., Opitsch , M., Erwin , P., et al
Saglia , R. P., Opitsch , M., Erwin , P., et al. 2016, , 818, 47, 10.3847/0004-637X/818/1/47
2016 doi
-
[48]
S \'a nchez , S. F. 2020, , 58, 99, 10.1146/annurev-astro-012120-013326
2020 doi
-
[49]
F., Walcher , C
S \'a nchez , S. F., Walcher , C. J., Lopez-Cob \'a , C., et al. 2021, , 57, 3, 10.22201/ia.01851101p.2021.57.01.01
2021 doi
-
[50]
F., Rosales-Ortega , F
S \'a nchez , S. F., Rosales-Ortega , F. F., Jungwiert , B., et al. 2013, , 554, A58, 10.1051/0004-6361/201220669
2013 doi
-
[51]
C., et al
Sarzi , M., Rix , H.-W., Shields , J. C., et al. 2005, , 628, 169, 10.1086/428637
2005 doi
-
[52]
S \'e rsic , J. L. 1963, Boletin de la Asociacion Argentina de Astronomia La Plata Argentina, 6, 41
1963
-
[53]
Silk , J., & Mamon , G. A. 2012, Research in Astronomy and Astrophysics, 12, 917, 10.1088/1674-4527/12/8/004
2012 doi
-
[54]
C., Peeples , M
Simons , R. C., Peeples , M. S., Tumlinson , J., et al. 2020, , 905, 167, 10.3847/1538-4357/abc5b8
2020 doi
-
[55]
F., Torrey, P., Lotz, J
Snyder, G. F., Torrey, P., Lotz, J. M., et al. 2015, Monthly Notices of the Royal Astronomical Society, 454, 1886, 10.1093/mnras/stv2078
2015 doi
-
[56]
2016, , 462, 2418, 10.1093/mnras/stw1793
Sparre , M., & Springel , V. 2016, , 462, 2418, 10.1093/mnras/stw1793
2016 doi
-
[57]
2018, Monthly Notices of the Royal Astronomical Society, 476, 580, 10.1093/mnras/sty247
Spindler, A., Wake, D., Belfiore, F., et al. 2018, Monthly Notices of the Royal Astronomical Society, 476, 580, 10.1093/mnras/sty247
2018 doi
-
[58]
2018, , 475, 676, 10.1093/mnras/stx3304
Springel , V., Pakmor , R., Pillepich , A., et al. 2018, , 475, 676, 10.1093/mnras/stx3304
2018 doi
-
[59]
2020, , 494, 1114, 10.1093/mnras/staa775
Steyrleithner , P., Hensler , G., & Boselli , A. 2020, , 494, 1114, 10.1093/mnras/staa775
2020 doi
-
[60]
Tonnesen , S., & Bryan , G. L. 2008, , 684, L9, 10.1086/592066
2008 doi
-
[61]
L., & van Gorkom , J
Tonnesen , S., Bryan , G. L., & van Gorkom , J. H. 2007, , 671, 1434, 10.1086/523034
2007 doi
-
[62]
D., Vogel , S
Villanueva , V., Bolatto , A. D., Vogel , S. N., et al. 2024, , 962, 88, 10.3847/1538-4357/ad1387
2024 doi
-
[63]
2014, , 509, 177, 10.1038/nature13316
Vogelsberger , M., Genel , S., Springel , V., et al. 2014, , 509, 177, 10.1038/nature13316
2014 doi
-
[64]
H., & Tinker , J
Wechsler , R. H., & Tinker , J. L. 2018, , 56, 435, 10.1146/annurev-astro-081817-051756
2018 doi
-
[65]
2017, , 465, 3291, 10.1093/mnras/stw2944
Weinberger , R., Springel , V., Hernquist , L., et al. 2017, , 465, 3291, 10.1093/mnras/stw2944
2017 doi
-
[66]
2018, , 479, 4056, 10.1093/mnras/sty1733
Weinberger , R., Springel , V., Pakmor , R., et al. 2018, , 479, 4056, 10.1093/mnras/sty1733
2018 doi
-
[67]
2021, Monthly Notices of the Royal Astronomical Society, 504, 4533, 10.1093/mnras/stab965
Wilkinson, A., Almaini, O., Wild, V., et al. 2021, Monthly Notices of the Royal Astronomical Society, 504, 4533, 10.1093/mnras/stab965
2021 doi
-
[68]
M., & Koo , D
Woo , J., Dekel , A., Faber , S. M., & Koo , D. C. 2015, , 448, 237, 10.1093/mnras/stu2755
2015 doi
-
[69]
M., Nelson , E
Wuyts , S., F \"o rster Schreiber , N. M., Nelson , E. J., et al. 2013, , 779, 135, 10.1088/0004-637X/779/2/135
2013 doi
-
[70]
2017, , 465, 4572, 10.1093/mnras/stw3030
Zheng , Z., Wang , H., Ge , J., et al. 2017, , 465, 4572, 10.1093/mnras/stw3030
2017 doi
Reviewed August 12, 2026 · model on record in the stance chip above.
Discussion (0). Continue with ORCID to comment.